submitted to the
Combined Faculties for the Natural Sciences and for Mathematics
of the Ruperto-Carola University of Heidelberg, Germany
for the degree of
Doctor of Natural Sciences
presented by
Dipl. Phys.: Ulrich v. Pape
born in: Hamburg
Oral examination: 30th January, 2002
Human Eye
Referees: Prof. Dr. Josef Bille
Prof. Dr. Karl-Heinz Brenner
FortschritteinderchirurgischenTechnikzur KorrekturvonrefraktionsbedingtenSehfehlern
haben es ermoglicht, dass heute die Form der Hornhautvorderache auch ortsaufgelost
geandertwerdenkann. Die Refraktionsmessungenammenschlichen Augebeschrankten sich
allerdings auf die Messung von Sphare und Astigmatismus, und zwar bei einer einzigen
Pupillengrosse. Im Zugedieser Arbeitwurde- basierendauf einemHartmann-Shack Sensor
-einWellenfrontmessgeratzurortsaufgelostenRefraktionsmessungdesAugesentwickelt,das
den diagnostischen Anforderungen gerecht wird, die sich aus den neuen Moglichkeiten der
Augenchirurgie ergeben.
Der Aufbau des Gerates wird beschrieben. Die Ergebnisse vonMessungen an Test-Optiken
werden dargestellt und mitden theoretischen Moglichkeiten verglichen. Die Ergebnisse von
Messungen an menschlichen Augen fuhren zu Einschatzungen uberdie tatsachliche und die
erforderliche notwendigeAuosungdes Gerats. DieReproduzierbarkeitder Ergebnissewird
gepruft. Weitergehend wurde noch einaktiver Senk-Matrix-Spiegelin das Gerat implemen-
tiert, der die Wellenfrontkorrigieren und dem Patienten seine aberrationsfreie Sehfahigkeit
demonstrieren kann.
Es zeigt sich: Das Gerat ist in der Lage, die Refraktionsmessungen einfach, schnell und
reproduzierbar durchzufuhren, und zwar mit einer Genauigkeit, die die Erfordernisse noch
ubertrit.
abstract: Wavefront Sensing in the Human Eye
Mostrecenttechnicaladvancementsin therefractive surgeryfor correcting refractionerrors
of the eye allowa spatial-resolved reshaping of the cornea. The diagnostics up tonow have
been restricted tosphere and cylinder givinga meanvalue for one pupil size only.
For this study a wavefront sensor for spatial-resolved measurement of the refraction of the
eye - using the Hartmann-Shack principle- was developed. To meet the diagnostic require-
mentsof present day ophthalmology wasthe maingoal.
Thesetupofthedeviceisdescribed. Measurementsattest-opticsaredetailedand compared
totheory. Measurements onhumaneyesgiveevidencefortheactualresolution ofthedevice
and the requirements as well. In addition an active mirror was implemented. The use of
this mirrorlies in correcting the wavefront error and presenting the patient with wavefront
corrected images totest the non-optical-limitedcapability of hisvision.
The resultsshow: The deviceiswellsuited formeasuringthe refractionof theeye-working
fast,withresultsreproducible,and aprecision, thateven surpasses theneedsof ophthalmol-
ogy.
1 Introduction 1
2 The Human Eye 5
2.1 Anatomy of the Eye . . . 6
2.1.1 Tear Film . . . 7
2.1.2 Cornea . . . 7
2.1.3 Anterior Chamber . . . 8
2.1.4 Iris . . . 8
2.1.5 CrystallineLens . . . 9
2.1.6 Vitreous . . . 10
2.1.7 Retina . . . 10
2.2 The DioptricSystem . . . 11
2.3 Styles-Crawford Eect . . . 15
2.4 Magnication . . . 15
2.5 Eye Movements . . . 16
2.6 Accommodation . . . 16
2.7 MonochromaticAberrations . . . 17
2.7.1 Myopia and Hyperopia . . . 17
2.7.2 Astigmatism. . . 19
2.7.3 Higher Order Aberrations . . . 20
2.8 Chromatic Aberrations . . . 21
2.8.1 LCA . . . 21
2.8.2 TCA . . . 22
3 Basics of Wavefront Sensing 23 3.1 Wavefront Sensors inOphthalmology . . . 24
3.2 Principle of aHartmann-Shack Sensor . . . 27
3.2.1 Shape of the Microspots . . . 31
3.2.2 DynamicRange . . . 32
3.2.3 Resolution . . . 33
3.3 Zernike Polynomials . . . 34
3.4 Fourier Optics . . . 38
3.4.1 FourierTransformation . . . 38
3.4.2 OpticalImaging inFourier Representation . . . 38
3.5 Propagating Wavefronts . . . 40
3.5.1 Correcting Aberrationsin the Conjugate Plane . . . . 41
3.5.2 Usinga Telescope for CorrectingSphere . . . 41
3.5.3 Correcting Cylinder. . . 42
3.5.4 SpatialFiltering. . . 42
3.6 Single PassMeasurement . . . 43
3.7 Describing Optical ImagingQuality . . . 45
3.7.1 RootMean Square . . . 45
3.7.2 OpticalAberration Index. . . 46
3.7.3 ModulationTransfer Function . . . 47
3.7.4 Point SpreadFunction . . . 47
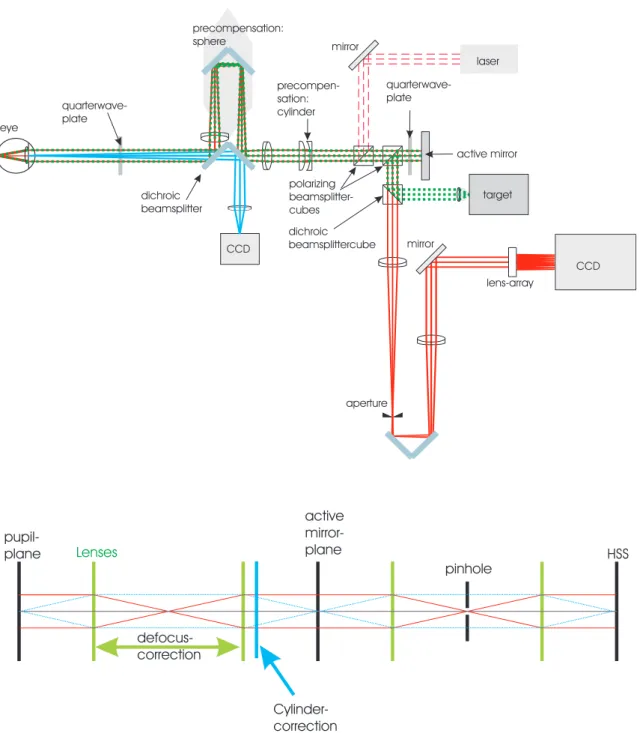
4 Setup 49 4.1 Specication of the System . . . 49
4.2 The OpticalSetup . . . 50
4.3 The Observation Unit . . . 53
4.3.1 Determination of the Axial Position of the Eye . . . 53
4.4 The Target and Vision-Chart Unit . . . 55
4.5 The Active Mirror . . . 57
4.6 The Measurement Unit . . . 57
4.6.1 LightSource . . . 58
4.6.2 Hartmann-Shack Sensor . . . 58
4.7 Software . . . 58
4.8 Precompensation of Lower Order Aberrations . . . 60
4.8.1 Pre-Correction of Sphere . . . 61
4.8.2 Pre-Correction of Astigmatism. . . 62
4.8.3 Calculating Sphero-CylindricalLenses . . . 62
4.8.4 The Use of Power Vectors . . . 63
4.9 Speckles . . . 64
4.10 Test Measurements onArticial Eyes . . . 66
4.10.1 Testing Sphero-Cylindrical Measurements . . . 66
4.10.2 Testing Higher Order AberrationMeasurements . . . . 69
4.10.3 Performance Test of the Active Mirror . . . 72
5 The Hartmann-Shack Sensor at the Human Eye 77 5.1 Measurements atthe Human Eye . . . 77
5.1.1 Comparing the Sphero-Cylindrical Refraction . . . 79
5.1.2 Reproducibilityof the Results . . . 81
5.2 Standard Deviationof Sphere and Cylinder. . . 82
5.3 Change of Higher Order Aberration . . . 83
5.3.1 Age . . . 83
5.3.2 Accommodation . . . 84
5.3.3 DailyFluctuations . . . 85
5.4 Perfect VisionStudy . . . 85
5.5 Excimer Study . . . 89
5.5.1 The Excimer Laser System . . . 92
5.5.2 Refractive SurgeryMethods . . . 93
5.5.3 Study Group . . . 93
5.5.4 Results. . . 94
6 Visual Acuity 95 6.1 VisionCharts . . . 95
6.1.1 Conditions ForVisual Acuity Measurements . . . 96
6.2 FundamentalLimitstoVisualPerformance . . . 97
6.2.1 OpticalLimits. . . 97
6.2.2 Retinal Limits . . . 100
6.3 Predicting VisualPerformance . . . 102
7 Conclusion and Outlook 105
List of Figures 107
Bibliography 111
Introduction
Inthe lastfewyears new techniques inrefractivelasersurgery have beende-
veloped and theeld hasprogressed rapidly. Prior tothese developmentswe
had excimer lasers with a potential to remove cornea tissue in a symmetric
way only, correctingsphere and - with limitations- cylinder.
Nowadays ying spotlaser orlaser scanning systems are capableto reshape
the cornea spatially resolved by sizes smallerthan 1mm.
This development has created new challenges for diagnostics. So far there
were subjective and objective methods like manifest refraction and autore-
fractometer, useful for measuring sphere and cylinder only. For the new
refractive surgery methodsthey were no support.
New eorts have been made - or older ones intensied - to avoid a gap be-
tween thetechniquesof surgeryandthetoolsfordiagnostics. Acombination
of corneal topography and manifest refraction was a rst approach. On the
assumptionthatmostofthehigherorderaberrationsoriginateinthecornea,
itwasthought that dealingwith the cornea shouldbe suÆcient. However it
turned out that the whole optical system has to be taken into account. At
this point wavefront sensors came inconsideration (e.g. see[Kl98]).
These sensors are based on a number of principles, the main ones being
Tscherning, Ray-Tracingand Hartmann-Shack or-asitiscalledinAmerica
- Shack-Hartmann.
The wavefront sensor used in our study is based on the Hartmann-Shack
principle. The ideabehindthis approachwas developed inastronomyinthe
seventies with the objective of determining the quality of telescope optics.
Liang in 1991, in our group in Heidelberg, was the rst to make a case for
using this method for measurements on the human eye [Li91]. In his dis-
sertation he layed out the theory and described how the rst experimental
setup wasbuilt.
Another main part of the waveform device originates in astronomy as well:
This is the adaptiveoptic, whichis a combinationof wavefront devices, one
for measuring (the HSS) and the other one for correction (active mirror,
ASKM). In astronomy it is used for correcting the aberrations caused by
the atmosphere in order to sharpen the images of objects in space. In our
deviceitisused tocorrectthehigherorderaberrationsoftheeye. Thisgives
a chance to demonstrate a patient the quality of vision he will achieve by
correction the higher orderaberrations.
Compared to man made optics the optic of the eye is very poor. So the
standard for the measurement at eyes is low too, especially compared to
astronomy. The problem here lies in the fact that the eye is alive and gets
damagedveryeasily. Thesecircumstancessettheframeforthedevelopment.
The setup for the measurements is detailed. In testing the device several
stepswere taken. Arst set oftests wasdesigned todeterminethe precision
of our measurements. Sphere, cylinder and higher order aberrations were
measured for awell known rigidtest optic.
Following this, tests were performed forhuman eyes. The results were com-
pared to those obtained from classical methods for determining refraction.
The reproducibilityof the values isestablished.
Higherorderaberrationsvaryontheirown inshortorlongtimeperiodsand
inprocessingaccommodationas well. Therange ofthese aberrationsgivesa
suggestionof the boundof precisionstillmaking sense. Theresults alsogive
anideaofthe minimumamountofaberrationalasersurgery maybehelpful
for.
Two applications of our device bring the study toa close.
\Perfect Vision\ and its opticalprerequisite isobject ofthe rst study. The
totheir higher order aberrations.
What results can be expected from excimer refractive surgery? This is the
questionasecondstudy centers around. 42patientswere treatedbothways,
with wavefront guided laser surgery on one eye and the traditional way on
the other. A glimpseat the potentialof the new method isgiven.
The Human Eye
Indealingwith theanatomyofthe human eyewe have toconsider two main
parts: The opticalunit and the retina.
The optical unit depicts the world around us upside down onto the retina.
The retina records the image, converts it into an electrical signal, does a
rst step of image-processing, and transmitsthe signal to otherparts of the
brain. (The retina is a part of the brain itself). Compared to man-made
optical apparatus the optical properties of the eye are quite inadequate -
even in a normal emmetropic eye. If the vision is still of a high quality,
this ismainlydue tothe excellent performance of the braininanalyzingthe
received image. However: The job of reconstructing a picture can't be done
without a minimum of information. The causes for loss in the quality of
vision vary over a wide range: Age-related loss of accommodation, Myopia,
Hyperopia, accidental damages of the cornea, opacity of the lens or retinal
damage. The deciencies can begrouped as below:
1. the optical imagingquality of the eye
2. the light scattering incornea and lens
3. the light scattering atthe retina
4. the neuronal use of the retina
The Hartmann-Shack Sensor is designed primarilyas a toolfor determining
the quality of the optical image. Moreover it is - via the brightness of the
visual axis
anterior chamber cornea
ciliary muscle posterior chamber
iris fovea
yellow spot
visual nerve retina papilla
sclera uvea lens
vitreous
lamina cribrosa zonula
fibers
Figure 2.1: Cross sectionof the eye
HSS spots - suitableto give informationabout eects of group 2 and 3. To
theneuronal use thereisnoaccessby Hartmann-Shack Sensors. Mostofthe
problems relatedtothe opticalunitcan dealt withby anintervention atthe
cornea- even if the problem doesnot originate inthis very place.
2.1 Anatomy of the Eye
This section gives a description of the elements of the eye with special em-
phasisontheir opticalproperties. The interaction between theseelementsis
the main subject of the next section.
The normal adult eye is approximately spherical with an anterior-posterior
diameteraveraging24.5mm.
The outer protective coating of the eye is the sclera. It is dense, white and
continues with the corneaanteriorly and the dural sheath of the optic nerve
posteriorly. The cornea is a transparent tissue inserted in the sclera at the
limbus.
The uveal tract is composed of the iris,the ciliarybody and the choroid. It
is the middle vascular layer of the eye and contributes blood supply to the
retina. The lens is a biconvex structure suspended behind the iris by the
zonules which connects it with the ciliary body. The retina is a thin multi-
layered semitransparent sheet of neural tissue that lines the inner aspect of
the posterior two-thirds of the wall of the globe.
2.1.1 Tear Film
A verythin lm- measuring about 10m -covers the cornea. For the optic
itisquiteimportant: Itisresponsiblefor asmoothsurface by compensating
rough parts of the cornea.
The lm consists of three layers. The outer lipid layer (0.02m-0.4m) -
mainly dierent fats - prevents evaporation. The middle aqueous layer -
mainly water (98%) and anorganic salts (1%) - is the thickest part. The
internal mucin - an extremely thin mucous layer of 0.2m - ensures the
adherence to the cornea. Abnormalities of the tear lm cause uctuations
and impair the opticalproperties of the eye. A tear inthe tear lmleads to
strong reections and aberrations to the eye.
2.1.2 Cornea
The cornea isthe most importantoptical part of the eye. The front may be
thoughtofasasectionofaspherewithdiameter16mm,thebase-circlebeing
12mmindiameter,the curvatureslightlydiminishingtowardstheperiphery.
The width of the layer increases from about 0.5mm in the center to about
0.8mmat the periphery.
The cornea is built in several layers: The epithelium in front, the Bow-
manMembrane,thestroma,theDescemetsMembraneandtheendothelium.
Makingup90%inthickness,the stromaisthe dominatingpart. The impor-
tanceof thecornealiesinthe factthatwith about43D(75%)the impact
on the total refraction of the eye is the largest. The refraction at the front
(49D) goes along with a much smaller refraction with a reverse sign at the
back (-6D).
The eect of the front is due to the extent of the dierence between the
refractionindex nof air(n=1.0) and corneatissue (n=1.376), the dierence
of nat the back being much smaller (Æn=0.04).
The front of the cornea has the shape of a ball, which is attened to the
periphery and mostly combined with some cylinder. A mathematical de-
scriptionof the shape may be:
z =
c
x x
2
+c
y y
2
1+ p
(1 (1+k)(c
x x
2
+c
y y
2
)
(2.1)
withz=heightc
x
=curvatureinx-direction,c
y
=curvatureiny-direction,k=conic
constant. This modeldoesnot regard rotation aroundthe z-axisand tilt.
In general the rear of the cornea has the same shape with a slightly smaller
curvature. The curvature of the cornea can vary by 0.06mm in the course
of eachday. This causes ashift in the refractionof about 0.3D. It may also
have an eect onthe cylinder.
2.1.3 Anterior Chamber
Thespacebetweenthe endotheliumofthe corneaandanteriorsurface ofthe
lens is calledthe Anterior Chamber.
It measures12mmindiameterand about3.6mmindepth. Bygrows ofthe
lens during lifethe depthdecreases continually.
Theaqueoushumor-asmediumveryclear-isresponsiblefortheintraocular
pressure. It is produced in the ciliary body and is diverted through the
trabeculaand the Schlemmscanal into the venous system.
2.1.4 Iris
The iris consists of anelastic diaphragm with a centralexpandable circular
opening, the pupil. The iris has a diameter of 12mm and a thickness of
about 0.6mm. The pupil is the aperture stop of the eye and limits the
passage of light into the eye. Its diameter is shifted by two muscles. The
musculus sphincter pupillae contracts the pupil and the musculus dilatator
pupillae widens it. The diameter can be changed between 2mm and 8mm,
corresponding toapproximately16 times variation in area. The apertureof
an optical system has always great inuence on the optical properties. A
stricture of the pupil has someeects onvision:
reducing the brightness
reducing the higher order aberration
increasing the diractioneects
increasing the depths of focus
Thehigherorderaberrationandthediractioneectsopposeeachotherwith
the change of the pupil size. The optimal vision quality will be achieved at
2mm-3mmdepending onthe eyes aberration.
The center of the pupil alsodenes - together with the fovea centralis - the
visualaxis of the eye.
2.1.5 Crystalline Lens
Thelens of theeyeismuchmore complexthanthe cornea. It canbe seenas
an asymmetric deformable biconvex gradient index lens. It has a diameter
of about 8mm, a thickness of about 4mmand a curvature radius of 10mm
at the front, and 8mm at the back. The refractive index of about n=1.4
decreases from the center to the periphery.
The lens keeps growing during lifetime. Starting with a small core at birth,
new layers of bres keep growing around this core continually. So the lens
can grow up todouble of its originalsize. As a consequence the inner parts
have a reduced metabolism and harden. This leads to a higher refractive
index and a smalleraccommodation range. The accommodation of children
can beup to14Dand goesdown toabout2Datthe age of50and less than
0.5D atthe age of 70. This causes ashift of the near point, from7cmfor a
childto more than 2m for aseventy year oldperson inan emmetropiceye.
The accommodation isregulated by the ciliarymuscles and by the zonula-
bres. The zonulabres pullthe lens inradial direction. Ifthe ciliarymuscles
are relaxed the refraction of the eye is at a minimum. By straining these
muscles the refraction rises.
2.1.6 Vitreous
Thevitreous formsthe largestpartof the eye. Itisthe transparentcolorless
and gelatinous mass - consisting to 99% of water and 1% of collagen and
hyaluronic acid - between the lens and the retina. The refraction index is
very close to the refractionindex of water.
The main importanceof the vitreous liesin itshigh refractive index.
2.1.7 Retina
Theretinaisthelightsensitivepart oftheeye. Itconvertsthe lightstimulus
intoa signal which can beprocessed by the brain.
The photosensitive cells can be classied in two groups, the rods and the
cones. These cells are arranged like a mosaic onthe retina. The cones sup-
port photopic (day, color) vision. The usually smallerrodssupportscotopic
(twilight) vision, which is in black and white only. In the fovea - the area
receivingthe sharpest image- there are norodsat all. Relativethe number
of rods increases to the periphery, as the number of cones decreases. The
total numberof rodsis about 100 million,compared to just7 million cones.
The size of the cones depends on the position in the eye. Their minimum
lies- with 2.5m to 4m - in the fovea.
Looking at the retina from the front two spots attract attention. On the
nasal side there is the optic papilla, the area where the nerves pass out of
the eye into the brain. In this area the retina has no light active cells and
the eye is blind.
The other spotis the macula. It contains the area with the sharpest vision
called the "fovea centralis". This part of the retina is built in a way that
minimizesdistortion of the image. There are no rods in the macula and no
blood vessels either. The cones dominating the vision in this area are very
small. The eld of view of the fovea centralis is very small (about 1 degree
or0.1%of the retina).
Stillthisarea isthe onlytargetofthe standardvisualacuitytests. Thisarea
isnight blind due tothe absence of rods.
The retina consistsof ten layers of cells. The most important are:
pigment epithelium.
this layer isresponsible forthe supply of the retina
lightsensitive layer.
Itconsistsofrodsand cones. Iflighthits thesecellsachemicalreaction
starts.
Layerof neurons called bipolarcells.
These cells transformthe chemicalsignal into anelectricalsignal.
The ganglioncells.
The innermost layerof neurons.
Layerof nerve ber.
Apartfromtheselayers thereare otherswhichestablishahorizontalconnec-
tion between the dierentareas of the retina.
In the retina some rst image processing is taking place. The number of
cells decrease with every layer. So the informationof more than 100 million
receptors can betransmitted with about 1 millionnerve bres.
The eective place of reection and the place of absorption - corresponding
tothe maximum -varies with the wavelength of the light.
2.2 The Dioptric System
Fromthe opticalpointofviewtheeyemustbeseen asasystem withfoural-
mostsphericalsurfaces-theanteriorand theposteriorsurfacesofthecornea
and the crystallinelens. The eect grows, as the dierence of the refraction
indexbetweenthe twomaterialsincreases, andthe radiusof curvatureofthe
surfaces decreases.
The total refractionof the eye isabout 59D, dominatedby the refraction of
the front of the cornea.
In contrastto most humanmade optical systems, the opticalaxisof the eye
is not identical with the functional axis of the eye. The visual axis is tilted
by about 5degrees against the optical axis (=symmetry axis) which causes
Optical Axis
Cornea
Lens Anterior Ocular Chamber
Aqueous Visual Axis
Figure2.2: Optical setup of the human eye
coma. The most important eye model was developed by Gullstrand at the
beginning of the 20th century. It is still in use for many applications, even
the most modern eye models are basedon the Gullstrand eye.
TheGullstrand eye hasjust onelens. The basicvaluesstemfrommeasuring
a very large number of emmetropic eyes, and taking mean values. In this
way he obtainedamodelforanon accommodatingeyewithathin lenswith
58.64D1.48mmbehindthe corneaand adistance of17.05mmbetween lens
and retina.
Apartfromthe refractivepropertiesof theeyethe transparencyhas another
decisiveroleforourapplication. Thetransparencyoftheopticalcomponents
depends toa great deal on the wavelength. This is shown in Fig.2.3. In the
visiblerange (550nm to750nm)as wellas inthe neighboured near infrared
range (750nm to 900nm) the transparency for the total optical path, from
cornea to retina, is about 75%. The transparency for a wavelength is not
constant throughoutlife. It decreases with age as shown in g.2.4.
wavelength
transmission
Figure2.3: The transparency of the human eye [Me96]
1) transmission of cornea
2) transmission of lens
3) transmission of the vitreous body
0 10 20 30 40 50 60 70 80
300 350 400 450 500 550 600 650 700 750 800
wavelength in nm
tr an sp ar en cy in %
30 years 70 years age:
Figure 2.4: Change of transparency with age
unit noaccommodation max accommodation
refractiveindex
cornea 1.376 1.376
aqueous 1.336 1.336
lens 1.386 1.386
core lens 1.406 1.406
place
corneafront mm 0 0
corneaback mm 0.5 0.5
lens front mm 3.6 3.2
lens back mm 7.2 7.2
radius of curvature
corneafront mm 7.7 - 7.8 7.7- 7.8
corneaback mm 6.8 6.8
lens front mm 10 5.33
lens back mm 6 5.33
total optical system
refractivepower D 58.64 70.57
place rst cardinalpoint mm 1.348 1.722
place secondcardinal point mm 1.602 2.086
place rst focus point mm -15.707 -12.397
place secondfocus point mm 24.387 21.016
front focallength mm -17.055 -14.169
back focal length mm 22.785 18.030
place of fovea mm 24.0 24
axial refraction D 1.0 -9.6
place of near point mm |{ -102
Table 2.1: The optical properties of the eye ([Me96])
n n´
h L L´ h´
air eye
a a´
Figure 2.5: The magnicationdepends fromthe lengthof the eye.
2.3 Styles-Crawford Eect
TheStyles-Crawfordeectliesinanangulardependenceofretinalsensitivity.
Rays parallel to retinal receptors, entering the pupil near its center, are
more eective (appear brighter) than oblique rays, entering the pupil near
itsmargins. Thisfactreduces theeectivepupil size. Thisphenomenon was
discovered by Styles and Crawford in1933. In a modelthis eect goes as a
lter, inwhich transmissiondecreases with diameter.
2.4 Magnication
In visual science the linear distance onthe retina corresponding to 1degree
of visualangle is called the retinalmagnication factor.
The magnication of the optics can be easily computed by applying Snells
law ona simpleeye model(g.2.5):
nsin( )=n`sin( `) (2.2)
which gives us - with the small angle approximation and taking the angles
trigonometricalequivalent:
h
L
= h`
L`
(2.3)
Sowenallyget forthe magnicationm
m= h`
h
= L`
L
(2.4)
SincethelengthL`growsfromahyperopictoamyopiceyethemagnication
alsogets larger. Forexample the magnicationfactor for a 10Dmyopic eye
Figure2.6: Accommodationof anemmetropic eye
a) the eye is maximallyaccommodated
b) the eye is not accommodated
is20%largerthanforanemmetropiceye-objectsinthesamedistanceseem
tobe larger and VisionCharts can be read better.
2.5 Eye Movements
Each eye is moved by six muscles, arranged in couples. Two of the pairs
areresponsibleformovingtheeyeup/downand right/leftand thethirdpair
inducesarotationoftheeyearoundthe visualaxis. The rotationguarantees
that the eye is always horizontal. This is most importantfor orientation.
Usuallyall six muscles work together. Onlyhorizontalviews, with the head
also being horizontal, can be achieved by using just one pair of muscles.
Horizontalmovements- e.g. used forreading -can berealizedvery fastand
precise.
2.6 Accommodation
Accommodationis theability of the eyeto changethe focus todierentdis-
tances. Theaccommodationisrealizedbytheabilityoftheeyetochangethe
shape of the lens (g.2.6). In the normal relaxed state the lens is relatively
at. By tensing a muscle the lens gets rounder in shape and the refraction
of the eye increases. Thus objects closer to the eye will be imaged on the
retina.
far point
near point accommodation
width max.
accommodation no accommodation
Figure 2.7: Accommodation of amyopic eye
The \near point\ (g.2.7) is the nearest point for which the sight is sharp.
Likewisethe furthermost point iscalled the"far point". The dierenceinD
iscalled"accommodationwidth". Inanormalyoung emmetropiceyethefar
point is in innity and the near point about 20cm in front of the eye. This
gives an accommodationwidth of 5D. Due to the hardening of the lens the
accommodationwidth decreases with age asdescribed above.
2.7 Monochromatic Aberrations
Deviationsfromthenormalabilitiesofvisionarecalledametropia. Thestan-
dardcaseofametropiaoccurswhentheimageofaninniteobject-withthe
eye relaxed - is not onthe retina. The main kinds of ametropia are myopia,
hyperopia and astigmatism. These classical refraction errors are superim-
posed by higherorder aberrationslike coma and sphericalaberrations.
2.7.1 Myopia and Hyperopia
The cause ofametropia normally liesinadeviation inthe length ofthe eye,
the distance between lens and retina. If this distance is too large the eye
is myopic, if the distance is to small the eye is hyperopic, like can be seen
in gure2.8. A deviation in the curvature of the cornea or in the grade of
refraction may alsocause ametropia,being minor ineect.
In arelaxed hyperopic eye the focus pointof anobject positionedininnity
liesbehindthe retina.
The focallengthcan beshortened by accommodatingso that the imagelies
Hyperopia 2dpt. Emmetropia Myopia -2dpt.
PSF
500 µm
500 µm 50 µm 50 µm 500 µm 500 µm
Figure2.8: Top: Refractiveerrors of the eye
Bottom: Formationof the PSF
horizontal focusline
vertical focusline minimal
focus diameter
beam shape
Figure2.9: Development of astigmatism
on the retina. The nearest point of sharp vision is further away. In an
emmetropic eye with rising age and falling accommodation range, the near
point willrise to some meters.
If the focus point is in front of the retina, the eye is myopic. Even with a
relaxed eye the far pointis nite.
By accommodation the area closer than this far point can be seen sharply.
The near point is closer thanin a normaleye.
In myopia and hyperopia the image of a point spreads to a blur as can be
seen in gure2.8.
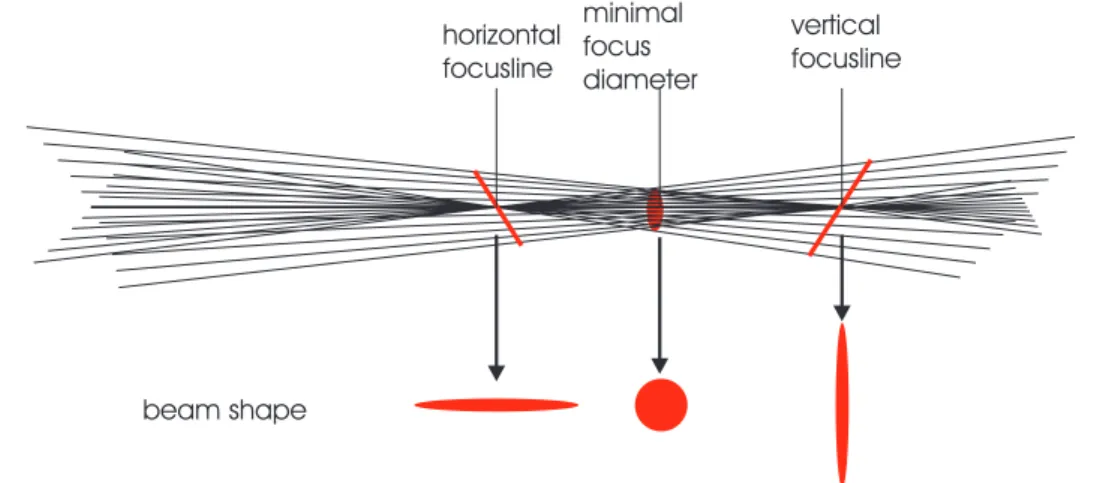
2.7.2 Astigmatism
The third kind of classic refraction failure is astigmatism. Astigmatismlies
in the factthat dierent axeshave dierent focallengths.
The main cause is a kind of barrel shape of the cornea or - in a minor
dimension - of the lens. An average eye has 0.5D of horizontal cylinder
called "regular cylinder". A dierence in the curvature of 0.1mm gives a
cylinder of 0.5D. With cylinder a point-lightsource gives - instead of one
focus point- two focus lines, with avery largefocus spotin between, as can
be seen in gure 2.9. If the cylinder is uncorrected, the eye focuses to the
spot with the minimaldiameter.
Figure 2.10: Development of sphericalaberration
2.7.3 Higher Order Aberrations
Apart from these deciencies there are higher order aberrations of a wide
range. For their classication and characterization Zernike-polynomials are
inuse. The most importantkinds of higher order aberrationsin the human
eye are sphericalaberrationsand coma.
Spherical aberrations occur if paraxial beams cross a sphericallens o-axis.
As shown in g.2.10 with a larger distance to the axis the focal length be-
comesshorter and the focus spotsmears.
Coma occurs if a beam crosses a lens o-axis or tilted. If coma exist, the
focalpointhas a shape likethe tailof a comet.
The higherorder aberrations mainlyoccur atthe corneaand at the lens.
Theclosetosphericalshapeinthecenterofthefrontofthe corneawillmake
up most of the spherical abberation. If a beam tilted by 5 degrees enters
the eye on the visual axis, it will also cause coma, which is even added by
a displacement of the center of the cornea to the visual axis. This can be
assumed the most importantaberrationscausedby the cornea.
The eect of the lens on the higher order aberrations is not quite easy to
see. It causes spherical aberration depending on the state of accommoda-
tion,coma and alsotriangularastigmatism,probablyinduced bythe 3pairs
of muscles.
Ifthe size of the pupil is large,the aberrationsobtainrelevance.
59 60 61 62
400 500 600 700 800
wavelength (nm)
to ta lr ef ract io n D
Theory values experimental values
Figure 2.11: Dependence of the total refraction of the eye from the wave-
length
2.8 Chromatic Aberrations
Inadditiontothemonochromaticaberrationstheeyealsosuersfromwave-
lengthdependentaberrations. Thechromaticaberrationsoccurintwoways.
The rst one relies on the fact that the refractive index of a materialis de-
pendent onthe wavelength. Therefractiveindexof theeye comparestothat
of water. The second way is generated by the fact that light of dierent
wavelength isabsorbed (and reected) in dierent layers of the retina.
Chromatic aberrations can bedivided into two kinds:
Longitudinal ChromaticAberration(LCA)
Transversal Chromatic Aberration (TCA)
2.8.1 LCA
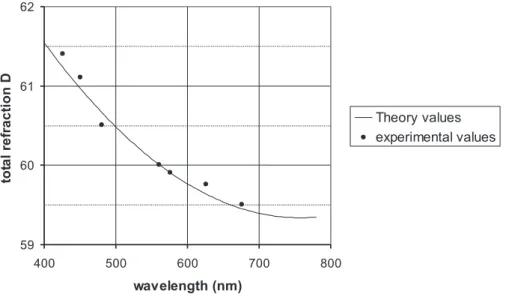
The shift of focal length with wavelength is called LCA. The eect is well
known in the visible range. The dierence in total refraction in an em-
metropiceyebetween400nmand600nmgoesbeyond1.5D.Thedependence
isshown ing.2.11. Thetheoreticalvaluesare basedonTucker[Tu74 ]. The
experimental meansare based onthe values of 20 measured eyes [Li97].
The theoreticalmodel-eyeTucker appliedisquitesimple. It has justone re-
fractive surface. The refractionindex changes inthe same way,as the index
of water does. In the visible range the theoretical results come very close
tothe experimental values. For the near infrared there are noexperimental
results for the LCA. So the assumption is that the models for visible light
are validalso inthis range.
2.8.2 TCA
TCA appears if polychromatic light enters the eye at an angle. The dif-
ference in the refraction index makes dierences for the refraction of beams
dependentontheircolor. Sothepositionoftheimageisshiftedtransversally
for oblique beams of dierent wavelength. This aects the magnicationof
the eye aswellasthe position ofthe image. Theinuence of the shiftinthe
reection depth onthe TCA isnegligible.
Theinuence ofthe TCA onourHSSmeasurementmaybe neglectedasthe
measurements are on-axis.
Basics of Wavefront Sensing
This chaptergives an introductionintoWavefront Sensing. It describes the
basicpropertiesofwavefrontsand informsaboutdierentwaysof measuring
anddescribing them. Furthermore theconnectionsof wavefrontstoophthal-
mologicalparameters are pointed out.
Beams from a pointsource are all in phase in the pointsource itself. If you
havedierentbeamsoriginatingfromonepointsourceatthesame timetheir
endpoints at any later time will generate a sphere (g.3.1). All points on
the surface of this sphere are in phase again. A surface like this is called a
wavefront: Wavefronts are phasefronts of light.
The direction of the propagation of light inside a medium is always orthog-
onal to the localsurface of the wavefront.
The qualityof anopticalsystem (forouruse) can bemeasured by itsability
to keep beams, originating from a pointsource, spherical. This is essential
for focussingthem back to one pointby anotherperfect opticalsystem.
The dierence inthe opticalpath between a wavefront surface and the best
tted sphero-cylindrical surface is called the higher order wavefront error.
The sphero-cylindricalsurface is always used as referencehere.
Detectorsonly respond tobrightness levelsand not tothe phase oflight. So
wavefrontsensorsregisterwavefrontsinamoreindirectway. Theytransform
optical pathdierences (OPD)to dierences in lightlevels.
WavefrontSensorsdierinkind: Directwavefrontsensorsmeasurethewave-
front itself (as in Radial Shear Interferometry). Indirect wavefront sensors
Figure 3.1: Denition of aWavefront
measure the dierential wavefront either in the pupil plane (e.g. knife edge
test) orin the image plane (e.g. Hartmann-Shack Sensor).
3.1 Wavefront Sensors in Ophthalmology
Asto applicationsforwavefront sensor systems, several uses can be thought
of, especially for measuring cornea topography or the space-resolved refrac-
tion of the eye. In this section will be described dierent setups for the
measurement of the space-resolved refraction.
Threetypesofthiskindareindevelopment: theThinbeamRaytracingAber-
rometer(g. 3.2), the Tscherning Aberrometer (g.3.3) and the Hartmann-
Shack Method (g.3.4).
The Raytracing Aberrometer uses the thin-beam principle of optical ray
tracing. It rapidly res a sequence of very small light beams into the eye.
ThroughabeamsplitteraveryfastPSD(PositioningSensingDetector)mea-
sures for every beam the position where it hits the retina. This is a great
advantageof this kindof sensor. Eachmeasurement gives the values forone
single beam. Even in case of strong aberration it is guaranteed that the
beams can be discriminated by time. About 64 beams are distributed over
the pupil size at random in a very short time (about 2ms). On the basis
of this the total refractive powerand higher order aberrationscan be deter-
Scanning
PSD
Positioning Sensing Detector
x
y
n=1 n=2 n=3 n=4
n=...
n=64
Figure 3.2: Thinbeam Ray-Tracing Aberrometer
mask of apertures
CCD
ophthalmoscope lens
resulting image
oberroscope lens
retinal image
Figure3.3: Tscherning Aberrometer
CCD collimated beam
lens array
retinal spot
Figure3.4: Hartmann-Shack Method
Figure3.5: Hartmanntestfortestingthequalityoflenses. WithaHartmann
apertureinfrontofthelenspictureswillbetakenatpointss
i ands
e
(infront
and behind the focus point)and the results willbecompared.
mined. Thepossibilitytovarythepatternofthe entrancepointsenablesthe
operator toconcentrate on special areas of the pupil.
TheTscherningAberrometer basesdirectlyonthe Hartmann-Testdescribed
inthe next chapter. Acollimatedlaser beam irradiatesa maskof about 160
holes. Thebeamsformedbythepatternwillbeimagedontheretina. Alens
in front of the eye focuses each point 1mm to 3mm in front of the retina,
so a grid with a diameter of 1mmforms on the retina. A ccd camera takes
pictures ofthisgridfromthe outsideofthe eye. Bythe distortionofthe grid
the wavefront canbecalculated. IncontrasttotheHartmann-Test, onlyone
image outside the focalplane is used. That amount of aberration that can
be measuredinthis waydepends onthe distance between the apertures and
that of the focalplane from the retina.
The Hartmann-Shack Sensor willbe described in detail inthe next chapter.
3.2 Principle of a Hartmann-Shack Sensor
Theconception oftheHartmann-Shack wavefrontsensorcomesfromastron-
omy. In 1900 Johannes Hartmann introduced a new method for specifying
the quality of large telescopes, called Hartmann test (g.3.5): An array of
apertures (HB=Hartmann Blende) are placed in front of a lens. Light of a
collimated beam passes through the lens. It is focussed with some aberra-
collimated beam
aberrated beam optical
system
lens arrray CCD-chip
Figure3.6: Idea of aHartmann-Shack Sensor
tion. Photographicplatesarepositionedinfrontandbehindthefocus. Every
aperture gives an image on each of the plates. By the total pattern taken
on the plates, every image-point can be associated with one aperture. The
focuspositionand thetotalaberrationofthe lensiscalculatedby takingthe
distance of the images fromthe opticalaxis and the positionsof the plates.
70 years later Shack and Platt introduced an advanced kind of Hartmann
sensor called Hartmann-Shack Sensor ([Pl71]). They proposed to use a lens
array inthe image planefollowed by a photographicplatein the focalplane
ofthe lens array (g.3.6). Later the photo-platewas replacedby accd-chip.
The improvement of this setup is remarkable. The number of planes for
measurement is reduced to one. This fact makes real-time measurements
possible, using a ccd-chip. The optical path of the system is not involved.
So it is possible to do measurements while the instrument is being used.
The newsetup makes measurementof the wavefront moreprecise and much
faster.
Figure3.7 shows the main idea of the Hartmann-Shack sensor on a single
lens. Acollimatedbeam hits asinglelens. The beam isfocussedby the lens
inthe focalplane. If the beam hits the lens parallel toaxis, the focus point
ison-axis. If the beam is tilted by an angle , the focus lieso-axis by
d=ftan( ) (3.1)
with f = focal length of the lens. The tilt of the focus is the clue to the
mean slope of the wavefront on the area of the lens. The extent, to which
f
d a
h
Figure 3.7: Functionality of a Hartmann-Shack Sensor demonstrated on a
single lens
the slope varies onthe diameterof the lens, should not be too large.
A Hartmann-Shack sensor uses a whole array of lenses instead of a single
lens. Thelensesdividethe beamintosub-beams. Eachsub-beamisfocussed
by a single lens on the ccd-chip. The position of the focus depends on the
mean slopeof the wavefront onevery microlens(g.3.8).
The result is the mean derivation in x- and y-axis forevery lens position:
P(x
n
;y
m )=
ÆW(x
n
;y
m )
Æx
= x
n;m
f
(3.2)
Q(x
n
;y
m )=
ÆW(x
n
;y
m )
Æy
= y
n;m
f
(3.3)
with W(x
n
;y
m
) = mean wavefront at the microlens (n;m), and x, y
the horizontal tiltof the axis.
This kindofmeasurement islimitedtomore orless continuous and dieren-
tiable wavefronts as seen in gure 3.9. Limitationsof the HSSare shown in
the diagram on the right. At the top the variation of the tilt between two
microlenses is so strong that the focus points change places. Below, a leap
in the wavefront between microlenses is shown. This leap has no inuence
on the result, so it cannot be measured. At the bottom lens the curvature
Figure3.8: Imageontheccd-chip. Thegreencrossesshowtheopticalaxesof
themicrolenses,thewhitepointsarethe focus pointsofanunevenwavefront
Figure3.9: Limitationsof the HSS
Left: A smooth wavefront reaches a HSS.
Right: A stronglyaberratedwavefront reaches the HSS.
of the wavefront is too large forhaving afocus pointat all.
Not only the position of the spots varies, their shape does so as well. The
curvature of the wavefront surface on the area of each single lens has to be
small. Therearethreepropertiesofthe HSS, whichaccountforthe dynamic
range and the resolution: the pitch of the microlenses, the focal length of
the microlenses (actually the distance between lens and ccd-chip) and the
resolution of the ccd-chip. Their eects will be described in the next three
subsections.
3.2.1 Shape of the Microspots
Ifthewavefront isnotdisturbed toomuch,eachpointcanbeseenasdirac-
tion limited. So we get an Airy Disc. The diameter depends on the size of
the aperture and the focal length of every microlensand the wavelength of
light:
s=f
h
=30mm
780nm
400m
60m (3.4)
with s = spotdiameter, = wavelength and h = pitch of the lens array.
With 60m the size of the spot is less than a sixth of the distance to the
next spot.
The shape of the spot gains relevance when stronger aberrations occur. For
the determinationof the focus-position the software uses a center of gravity
algorithm. Soa non-symmetric change in the shape of the spot could inu-
ence the result of the spotnding and hereby the shape of the wavefront.
If stronger aberrations occur two eects have to be taken into account for
calculating the spot shape.
Each HS spot is the image of the spot on the retina, imaged through the
optical path through the individual micro lens. So for simulating the shape
of the spots we need two PSF`s:
Firstly the PSF we get from the beam coming into the eye including the
precompensationof sphere and cylinder.
SecondlythePSFoftheopticalpathoutoftheeyeandthrough themachine
tothe HSS.
The nal shape of the spotis now the convolution of both PSF`s.
The rst PSF is identical for all microspots, since the same lightsource on
d
f a
r
Figure 3.10: Dynamic range of aHartmann-Shack Sensor.
the retina isused. The secondPSF is dierentfor everymicrolens, asevery
single lens is part of adierent optical path through the pupil. The quality
oftherst PSFwillnormallybeinferiorasthe beamdiameterislargerhere.
ThesecondPSFwillbeclosetodiractionlimited. Ifthereisnostronglocal
perturbation,the shapeofallmicrospotswillbeverysimilar totheshapeof
the focalpoint onthe retina.
A strong aberration of this spot will cause a shift in nding the center of
gravity. This deviationisnot thatserious,because itaectsallpointsinthe
same way. So it just changes the total tilt of the wavefront - which is not
used anyway.
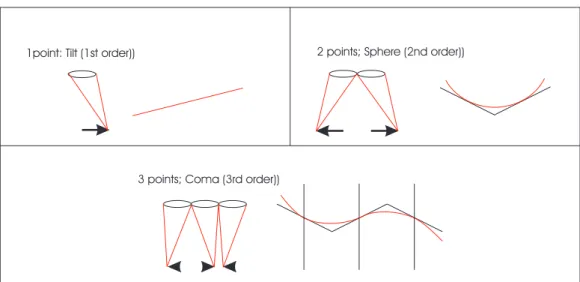
3.2.2 Dynamic Range
The dynamic range of a HSS species the range of aberrations that can be
measured. As shown ing.3.9the change in wavefronttilt may get so large
that two focalpoints may overlap oreven changeplaces. To distinguish the
focal points of dierent lenses we have to make sure that every focal point
lies within the area of its own lens. This can be done by a fourier lter in
the opticalpath.
Fig.3.10shows,inwhichwaythedynamicrangeislimited. Thedisplacement
1point: Tilt (1st order)) 2 points; Sphere (2nd order))
3 points; Coma (3rd order))
Figure3.11: The maximumdetectable wavefrontcomplexitydepends onthe
number of measured points.
of the focus pointplus the spot size has tobe smallerthan the radius ofthe
lens array. This leadsto a maximum angleof:
max
tan
r d=2
f
(3.5)
This gives us a maximum wavefront tilt of about 0:3 Æ
. So the maximum
measurable sphere would be 1.8Dat a6mmpupil.
3.2.3 Resolution
There are two kinds of resolution: there is a minimum for the detectable
wavefront slope and amaximum for the complexity of the wavefront.
Like the dynamic range the minimum wavefront slope depends on the focal
lengthandtheradiusofthe microlenses. Theresolutionofthe ccd-chip mat-
ters at this point too.
For the minimum detectable wavefront slope the accuracy of the focus po-
sition is crucial. If the spot quality is high the position can be determined
by t routines by about a hundredth of the pixel-size of the ccd-chip. This
gives aminimum detectable tiltof
min
= ccd
res
f
0:12m
30000m
410 6
(3.6)
Sotheminimumdetectableangle isabout2:310 ( 4)Æ
. Thiscorresponds toa
changeof the phase of0.002m overamicrolensand aminimum detectable
defocus of 0.002D.
The maximum detectable complexity depends on the number of detected
points over the pupil-radius. As gure 3.11 shows the number of radial de-
tectedpointsequals themaximum ofradialZernike-orders that canbeused.
We get 15Hartmann-Shack pointsover a 6mm pupil, sowe could calculate
ZernikecoeÆcientsup tothe 15th order. In factwelimitour calculationsto
the 6th order, due tocomputation time and necessary resolution.
For a two-dimensional pupil the maximum order of Zernike polynomials is
xed by the degree of freedom of the Hartmann-Shack points. Every point
has two degrees of freedom, every Zernike polynomial one. Fordescribing 6
orders of Zernike polynomials (=28polynomials) we need at least 14 focus
points. That corresponds toa pupilsize of about 2.8mm.
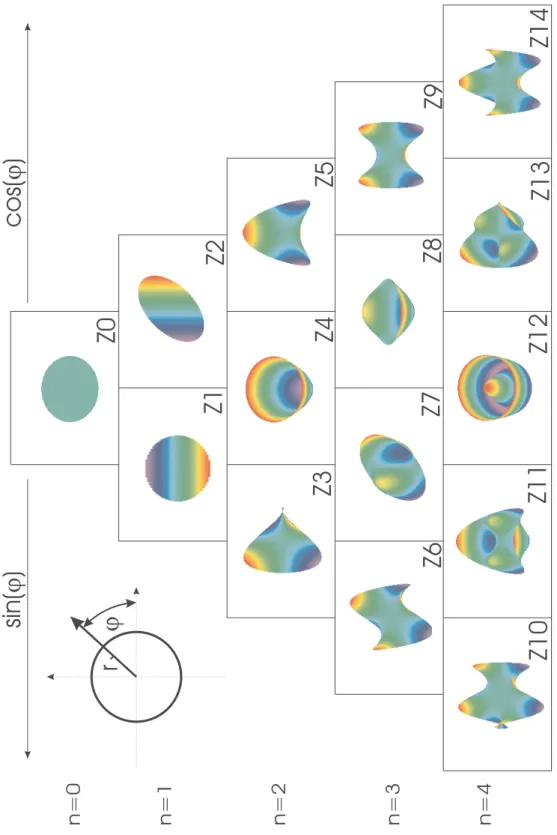
3.3 Zernike Polynomials
Thewavefronterror isdescribed asasurface overtheexitpupil. Todescribe
thesurfaceweuseafunctionW(x;y),whichattributesawavefrontheightfor
every positioninthe pupilP(x;y). This heightis theopticalpath dierence
between the reference sphereand the wavefront.
In ophthalmological optics the use of Zernike polynomials is dominating in
the description of optical aberrations. Zernike polynomials were introduced
in 1934 by F. Zernike as a convenient tool for representing wavefront aber-
rations over a circularpupil. A great advantage of these polynomials is the
fact, that their relations to the classical aberrations are very simple. The
polynomialshave (amongother things) the followingproperties:
They are orthogonal over the circle with unit radius
They are complete
n
jlj 0 1 2 3 4
0 1 2
2
1 6
4
6 2
+1
1 3
3
2
2
2
4 4
3 2
3
3
4
4
Table 3.1: Radial Polynomials R jl j
n
(),for jlj4,n 4
The precision, anaberration can be described with by Zernike polynomials,
dependsontheorderofthepolynomialsbeingused,andhasnominorbound.
The extension to higher order terms does not aect the coeÆcients of the
lower order ones -at least intheory, onthe assumption that the base of the
t is an innite set of points distributed uniformly. In case a wavefront is
represented as a linear combination of Zernike polynomials, the variance of
the whole term is equal tothe sum of the variances of the single terms.
Thepolynomialcan beexpressed asaproductof twofunctions,one depend-
ing onthe radial coordinateonly, the other representing the dependence on
the angular coordinate. The total polynomialcan be described as follows:
Z l
n
=R l
n ()e
il
(3.7)
with n = degree of the polynomial, l = angular dependence parameter,
=normalized radial distance and = angle with the axis x. The num-
bers n(>l)and l are either both even orboth odd.
Tabular3.1 gives the radial polynomials up to 4th order. Tabular3.2shows
the full Zernike polynomials with their classical equivalent in non-complex
presentation. Mostclassicalaberrationscan berepresented byjustone com-
ponent, only nonrotationallysymmetric aberrationslike coma and astigma-
tism are decomposed intotwo components.
n l no. Zernike Monomial aberrationname
Polynomial Representation
0 0 0 1 1 Piston
1 1 1 sin x Tiltaboutyaxis
-1 2 cos y Tiltaboutxaxis
2 2 3
2
sin2 2xy Cylinderwithaxis at 45degree
0 4 2
2
1 1+2y
2
+2x 2
Defocus
-2 5
2
cos2 y
2
x 2
Cylinderwith axisat 0/90 degree
3 3 6
3
sin3 3xy
2
x 3
Triangularastigmatismon xaxis
1 7 (3
3
2)sin) 2x+3xy 2
+3x 3
Thirdorder Coma alongxaxis
-1 8 (3
3
2)cos) 2y+3y 3
+3x 2
y Thirdorder Coma alongyaxis
3 9
3
cos3 y
3
3x 2
y Triangularastigmatismon yaxis
4 4 10
4
sin4 4y
3
x 4x 3
y
2 11 (4
4
3 2
)sin2 6xy+8y 3
x+8x 3
y
0 12 6
4
6 2
+1 1 6y
2
6x 2
+6y 4
+ Third orderspherical aberration
+12x 2
y 2
+6x 4
-2 13 (4
4
3 2
)cos2 3y 2
+3x 2
+4y 4
4x 4
-4 14
4
cos4 y
4
6x 2
y 2
+x 4
5 5 15
5
sin5 5xy
4
10x 3
y 2
+x 5
3 16 (5
5
4 3
)sin3 12xy 2
+4x 3
+15xy 4
+10x 3
y 2
5x 5
1 17 (10 5
12 3
+3)sin 3x 12xy 2
12x 3
+10xy 4
+20x 3
y 2
+10x 5
1 18 (10 5
12 3
+3)cos 3y 12y 3
12x 2
y+10y 5
+20x 2
y 3
+10x 4
y
-3 19 (5
5
4 3
)sin3 4y
3
+12x 2
y+5y 5
10x 2
y 3
+15x 4
y
-5 20
5
cos5 y
5
10x 2
y 3
+5x 4
y
Table 3.2: First5 orders of Zernikepolynomialswith classicaldescription
sin( ) j cos( ) j j r Z1 Z2 Z3
Z0 Z4 Z5 Z6 Z7 Z8 Z9 Z10 Z11 Z12 Z13 Z14
Figure 3.12: Chartof Zernike polynomialsup to4th order
3.4 Fourier Optics
Thischapter givesashort overviewof theuse of Fouriermethodsindescrib-
ingoptics.
The Fourier transformationmakes it possible tochange over fromspace do-
main into frequency domain. Many optical processes - especially imaging
withlimitedpupilsize-canbehandledmucheasieriftheconsiderationsand
thecalculationsaredoneinthefrequency domain. Thiscountsespeciallyfor
diractioneects, which cannotbe described with ray-tracinganymore.
3.4.1 Fourier Transformation
In the space domainan object is described by anintensity function f(x;y).
In the frequency domain the same object can be represented by use of the
2-dimensional Fourier Transformation as F(;) with and representing
the frequencies inx- and y-direction.
Forthe 2-dimensional case the transformation willbe performed by
F(;)= Z
1
1 Z
1
1
f(x;y)e
i2(x+y)
dxdy (3.8)
The way back will be performedby:
f(x;y)= Z
1
1 Z
1
1
F(;)e
i2(x+y)
dd (3.9)
3.4.2 Optical Imaging in Fourier Representation
f(x;y) and g(X;Y) are the complex entrance and exit functions of a linear
system. The opticalimpact can be described by a linearoperatorL:
g(X;Y)=L[f(x;y)] (3.10)
with the use of the principleof superposition we get:
g(X;Y)=L Z
1
1 Z
1
1 f(x
0
;y 0
)Æ(x x 0
)Æ(y y 0
)dx 0
dy 0
(3.11)
= Z
1
1 Z
1
1 f(x
0
;y 0
)L[Æ(x x 0
)Æ(y y 0
)]dx 0
dy 0
(3.12)
object optic image
convolution
multiplication
=
=
Fourier-Transformation
I(x,y) i
IS( , ) i x h PSF(x,y)
IS ( , ) 0 x h OTF( , ) i x h I (x,y) 0
Figure3.13: Fourier Optic inincoherentimaging
The application of the linear operator L on the Æ-function gives us the so
called \impulseanswer\.
The further application of the linear operator depends on the kind of illu-
mination used. If the object is illuminated by coherent light, the optical
system is linear in phase, otherwise it is linear in intensity. In the following
we suppose the light tobe incoherent.
Equation 3.12 shows a convolution in the space domain. A convolution on
one side of afourier-transformation isequalto amultiplication onthe other
side. This givesa multiplication inthe frequency domain.
G(;)=OTF(;)F(;) (3.13)
G(;)and F(;)are the fourier transformed off(x,y) and g(x,y). Optical
imagingcan beseen asa lteringin the frequency domain.
Figure3.13 illustrates this with I = Intensity, OTF
i
= incoherent optical
transfer functionand PSF =pointspreadfunction. Theamplituderatio
is calledmodulation-transferfunction(MTF).
The relation between the pupil function and the optical transfer function is
offurther interest. Theincoherentopticaltransferfunction istheautocorre-
lationof the pupil function:
PSF =jFTfP(x;y)gj 2
(3.14)
This correlationmakesitpossible toobtainthe PSF directly fromthe pupil
function and therewith fromthe Zernike polynomials.
3.5 Propagating Wavefronts
Every wavefront changes its shape while propagating in space. Only an in-
nite widespread at wavefront would keep unchanged. So the shape of a
wavefront willbe dierent in any two places.
A wavefront originatingfromapointsource stays sphericalinshape,but the
curvature varies with the reciprocaldistance from the source. In a suÆcient
distance,however, thewavefrontcanbeseenasat. Thedierences between
a real wavefront surface and a theoretical at surface make the total wave-
front error.
In most cases it is not possible to have the wavefront sensor at exactlythat
place,we wantthe informationabout. Sothe wavefronthas tobeimagedin
adeniteway fromthe plane, wewant tohave values for,toa plane wecan
actually take values in by our sensor. The easiest way to realize this, is by
using conjugateplanes of a lens system.
A Badal system - consisting of two lenses - modies the wavefront in just
that accurately dened way. Defocus and cylinder can beeliminated, sothe
remaininghigher order wavefront error willbe recorded. The eliminationof
the lowerorder aberrationsis asuitablemeansof optimizingthe Hartmann-
Shack sensor in dierent respects, aiming at either a large active range or
a high accuracy. The active range the higher order aberrations need is far
lower. So we optimize the HSS for a high accuracy and correct the sphere
and cylinder aheadof the wavefront measurement.
A wavefront on one side of the optical system is - apart from small errors
introduced by the system itself - similar to the wavefront in the conjugate
plane.
Analterationinthe shape mayresultfromlens-failuresordiraction,the -
nitesize oftheobjectorthe surfacesbeingoffurther inuence. Inparticular
Figure3.14: Wavefront propagatingfrom aplane to itsconjugate plane
a smallaperture in the optical path willcause a attening of the wavefront
as itworks as aFourier lter.
Forthe pre-compensationthere arethree kindsofcorrection inuse: Shifting
the telescope for correcting the sphere, introducing cylinder lenses for cor-
rectingthecylinder andvariationsofthe OPDinaconjugateplaneby using
anactivemirror for correctinghigher order aberrations.
3.5.1 Correcting Aberrations in the Conjugate Plane
Correcting aberrations works by a step-by-step-principle, using a series of
conjugate planes, the rst one being the object plane and the last one the
measurement plane of the sensor. In the conjugate planes in-between the
opticalpathcanbevariedforeverylongitudinalpositioninacontrolledway.
This can be done by an active mirror, a liquid crystal device, or simply by
taking inuence onthe opticalpath-lengthby insertinganon uniform glass.
3.5.2 Using a Telescope for Correcting Sphere
TheSphereCorrectionwillberealizedbyshiftingthedistanceofthelensesin
a Badalsystem. This shifthas noinuence onthe positionof the conjugate
planesin respect tothe lenses asyoucan see ing.3.14. Shifting the length
ofthetelescopehasinuenceonthecurvatureofthewavefrontonly,allother
deviations stayingunchanged. The total sphere is given by D =D
1 +D
2
Figure 3.15: A FourierTransformLens
dD
1 D
2
. With the zero position of d = 1
D
1 +
1
D
2
this leads to a change of
sphere of
D= dD
1 D
2
(3.15)
with D = effective sphere in D, D
1
= sphere of first lens in D, D
2
=
sphereof second lens in D and d=shift between the lenses in m. The
changeofcorrectedsphereisthusproportionaltotheshiftbetweenthelenses
with aparaxial system.
3.5.3 Correcting Cylinder
The cylinder pre-correction is realized by a pair of cylindrical lenses, posi-
tioned in the optical path of the system. The ideal position would be in a
conjugateplane of the pupil.
3.5.4 Spatial Filtering
The wavefront system has to eliminate the reections from surfaces other
thantheretina,especiallythosefromthe cornea. Forthisreasonanaperture
isintroducedintothelasttelescope. Thesizeoftheapertureiscrucial. Ifitis
toolarge,unwanted lightcomesthrough,ifitistoosmall,spatialfrequencies
of the wavefront willbe cut o.
Therst lensof the telescopeworksasafouriertransformer, the aperturein
the Fourier plane asa lter forhigh frequencies.
In aperfect opticthe crossing of the aperturewillbelimited tothat part of
the beam, of which the tiltsatises the followingconditions:
tan r
f
(3.16)
Thespatialinformationforsmallerfrequenciesgetslost. Withf=80mmand
r=0,5mm should be smaller than 0.00625 which corresponds to a sphere
of 2.1D (PTV=18,7m) ata 6mmbeam.
Higher order wavefront distortions have a stronger maximal tilt with the
same amplitude. So they get cut o with an even smaller amplitude. For
thirdorder sphericalaberrationthecut-o amplitudegoesdown -compared
to a ideal sphere - by the factor 1/3, for fourth order terms the factor is
about 1/4. In fact it is the total local tilt in a wavefront that matters, not
the tilt perpolynomial.
3.6 Single Pass Measurement
The Hartmann-Shack methodworks onthe assumptionthat the focus-point
onthe retinaisa point-lightsource. This iscorrect, if the reectionfromthe
retina is diuse and the light loses all itsphase informationof the way into
the eye. Severalretina models(e.g [Ar95],[Di00])attributethe factthatthe
retina is diuse to the roughness of the surface made up by the individual
cones.
Thesingle-passorthedouble-passproperty(correspondingtodiuseorspec-
ular reex) may prevail. This can be tested by a simple setup. A measure-
mentofastronglyaberratedeye-withanon symmetricalkindofaberration
- is performed. If the double-pass property dominates the wavefront should
besymmetric. Incase ofspecularreex andifincomingandoutgoingbeams
havethe samediameter theresult shouldbeanautocorrelationofthe Single
Pass. The described setup was simulated with ZEMAX, an optical design
program. The result was compared to a real measurement on an articial
eye with diuse and specular kind of reection, and to the measurement on
a real eye. For the diuse reector SPECTRALON was used, as specular
reector a mirror. The resultsare shown ingure3.16.
single pass double pass
human eye:
artificial eye:
specular reflector diffuse reflector
ZEMAX: Simulation
Figure 3.16: Simulation (by ZEMAX) and Measurement: Double-Pass vs.
Single-Pass
Theresults ofthesinglepass setupare seenontheleft,those forthedouble-
pass on the right. The ZEMAX-simulation is given at the top. The results
forthe articialeyeareshown below. Thoseforarealeyewithawellknown
coma infrontof the eye are given atthe bottom.
Diaz-Santana points out the independence of phase information and inten-
sity information. Whilethe phase informationof the rst pass gets lost, the
intensity information remains unchanged. This can be seen in the shape of
the microspots, which vary with the size of the incomingbeam.
3.7 Describing Optical Imaging Quality
Forthe descriptionof theperformance ofanopticalsystem thereare several
parameters in use. Some of them are applied to the human eye as well. A
short overview of some scales used in ophthalmology will be given in this
section.
3.7.1 Root Mean Square
The RMS of the wavefront is a very simple criterion. It is nothing but the
integrated rootmeansquareofthe dierences between thewavefront surface
andthemeanvalueofthesurface. Thecomplexphenomenonofaberrationis
packed intoa single number. Thismakesit soconvenient inophthalmology.
The RMS can be calculated directly fromthe Zernike polynomials.
For the calculation of the RMS we refer to Zernike polynomials of second
order minimum. The zero orderis not measured atall. The rst order gives
informationaboutthe tiltonly,whichisconnectedtothepositionoftheeye.
Itdoesnot supplyanyinformationaboutthe characteristicsofthe eyeitself.
The Zernike polynomials are orthogonal and the zero order term is set to
zero. So the mean value of the wavefront surface is zero, too. The RMS is
thus simplythe mean squared value of the wavefront over the pupil.
R MS = v
u
u
t R
r
0 R
2
0
W(;) 2
dd
R
1
0 R
2
0
dd
= s
1
Z
1
0 Z
2
0
W(;) 2
dd (3.17)
IntakingmeanvaluesoftheZernikepolynomialstheintegralcanbereplaced
by a sum of the weighted coeÆcients. For a real pupil size the integration
willbe from0 tor.
R MS = v
u
u
t R
r
0 R
2
0
W(;) 2
dd
R
r
0 R
2
0
dd
(3.18)
= v
u
u
t 1
r 2
Z
r
0 Z
2
0
order
X
i=0 c
i Z
i (;)
!
2
dd (3.19)
= v
u
u
t 1
r 2
order
X
i=0 c
2
i Z
2
0 Z
1
0 Z
2
i
(;)dd (3.20)
= v
u
u
t 1
r 2
order
X
i=0 c
2
i Z
0 2
i
(3.21)
with Z 0
i
= weighting coefficient for each Zernike. It depends from the
radialand angularorder.
Z 0
i
=
1
(2 Æ
l
)(n+1)
with i=
n(n+1)
2 +
n l
2
+1 (3.22)
With3.21 the RMS can be calculated simplyas a root of the sum of coeÆ-
cients. This makes calculationswith the RMSvery easy.
ThePeak ToValley(PTV) iscloselyconnected tothe RMS.Whilethe PTV
depends - heavily - on just two extreme values, the RMS is a kind of mean
value received from the complete set of data points. This makes the RMS
much more stableagainst deviations.
3.7.2 Optical Aberration Index
The OpticalAberrationIndex (OAI) is dened as
OAI =1 e
( RMS)
(3.23)
TheOAI hasvaluesbetween zeroand one. Zero standsforanopticalsystem
that is perfect and 1 for innite aberrations. The OAI is very sensitive in
the typical range for higherorder aberrations. It was introducedas aneven
simplerscale for the optical quality of aneye.
3.7.3 Modulation Transfer Function
A typical target for testing the quality of an optical system consists of a
series of alternating black and white bars of equal width with a contrast of
1. These targetsare connectedto avisionchart with SnellenE`s, asused in
ophthalmology. TheModulationTransferFunction(MTF)givesthecontrast
of the image (as percentage of the contrast of the object) in dependence of
the frequency. The contrast isdened by: Contrast= I
max I
min
Imax+I
min
. The MTF
may be compared tothe AerialImage Modulation(AIM) curve. This curve
shows the smallest amount of modulationa sensor like a ccd-camera orthe
retina is able to detect. The AIM is a function of the frequency used as
well. As the MTF normally goes down with frequency increasing, the AIM
increases with frequency. The pointof intersection givesthe resolution.
Fora diractionlimited optic the MTF can becalculated by
MTF()= M
i
M
o
= 2
( cossin) (3.24)
with
=arccos
2NA
(3.25)
=frequency in cycl es
mm
,NA=numerical aperture and =wavelength
3.7.4 Point Spread Function
The point response of an optic should still be a point. Even if the optic is
perfect the response is a pattern - due to the diraction. In a real system
the aberrations widen the image up toa spot. The spotis represented by a
2-dimensional distribution. This is described by the Point Spread Function
(PSF).
Ifthe aberrations are smallerthan 0.25 (Rayleighcriterion)the diraction
patternprovides agooddescription of the PSF.
Up toabout 2 itis appropriateto consider the mannerin which the aber-
ration aects the diraction pattern. For larger wavefront aberrations illu-
minationdescribed by raytracing is suÆcient fordescription.
The aberrations of eyes are inthis transition zone inmost cases.