submitted to the
Combined Faculties for the Natural Sciences and for Mathematics of the Ruperto-Carola University of Heidelberg, Germany
for the degree of Doctor of Natural Sciences
presented by Diplom-Physiker Martin St¨ubig born in Salzgitter
Oral examination: 04.12.2002
with micrometeoroid detectors by improved impact simulations in the laboratory
Referees Prof. Dr. Eberhard Gr¨un
Prof. Dr. Immo Appenzeller
Neue Erkenntnisse ¨uber Einschlagsionisationsprozesse und ¨uber Flugzeitmassenspektroskopie mit Mikrometeoroid-Detektoren durch verbesserte Einschlagssimulation im Labor.
Die vorliegende Dissertation handelt von den Einschlagsionisationsprozessen die bei H¨ochstgeschwin- digkeitseinschl¨agen von Mikropartikeln auf feste Oberfl¨achen auftreten. Mittels einer neu entwickel- ten Staubteilchen-Quelle f¨ur den Heidelberger Staubbeschleuniger wurden Aluminium-, Kohlenstoff- , Natrium-behandelte Kohlenstoff-, Eisen- und Latex-Projektile auf die Mikrometeoriten-Detektoren CDA und CIDA geschossen. Die Projektilmassen ¨uberdecken einen Bereich von 1018 bis 1012kg, die Projektildichten einen Bereich von 1100 bis 7900 kgm3 und die Einschlagsgeschwindigkeiten einen Bereich von 2 bis 70 km/s. Die resultierenden Daten zeigen verschiedene Einschlagsionisations- prozesse in Abh¨angigkeit von der Impaktgeschwindigkeit: f¨ur niedrige Geschwindigkeiten (v6 km/s) dominiert Oberfl¨achen-Ionisation von Target-Verunreinigungen, f¨ur hohe Geschwindigkeiten (v18 km/s) Volumen-Ionisation des Target- und Projektilmaterials. Aufgrund des Energiever- brauchs durch Schmelz- und Verdampfungsprozesse zeigt die Ladungsausbeute im mittleren Ge- schwindigkeitsbereich einen reduzierten Anstieg. Flugzeitmassenspektroskopie, die mit beiden In- strumenten durchf¨uhrbar ist, erm¨oglicht die Untersuchung der chemischen Bestandteile im Einschlags- plasma in Abh¨angigkeit von Projektiltyp und Einschlagsgeschwindigkeit. Bei niedrigen Geschwindig- keiten dominieren Alkali-Ionen (Na, K) das Massenspektrum. Bei h¨oheren Geschwindigkeiten er- scheinen Targetionen (Rh), Projektilionen und Wasserstoff (H). Die Systematiken charakteristischer atomarer und molekularer Ionenspezies in den Massenspektren hilft bei der Ermittelung der chemis- chen Natur unbekannter Projektile im Weltraum. Ein verbessertes Model f¨ur spezifische Ionenaus- beuten konnte angegeben werden. Weiterhin wurden viele Ergebnisse, die f¨ur die Instrumentkalibra- tion und f¨ur das Verst¨andnis von Flugdaten von Bedeutung sind, wie z.B. Gesamtladungsausbeuten, Anstiegszeiten und Empfindlichkeiten gewonnen. Erste Messungen mit Sch¨ussen auf den inneren Wandbereich des Instruments werden gezeigt.
Abstract
New insights in impact ionization and in time-of-flight mass spectroscopy with micrometeoroid de- tectors by improved impact simulations in the laboratory
The present thesis deals with the impact ionization processes appearing at hypervelocity impacts of microparticles on solid surfaces. With a newly developed dust particle source, applied to the Hei- delberg Dust Accelerator facility, aluminium, carbon, sodium contaminated carbon, iron and latex projectiles were shot on the micrometeorite detectors CDA and CIDA. The projectile masses cover a range of 1018 to 1012 kg, the projectile densities a range of 1100 - 7900 kgm3 and the impact speeds a range of 2 - 70 km/s. The resulting data show different impact ionization processes de- pending on the impact speeds: for low speeds (v6 km/s) dominates surface ionization of target contaminants, for high speeds (v18 km/s) volume ionization of the target and projectile material is dominating. The charge yield in the intermediate impact speed regime shows a reduced increase
plasma depending on the projectile type and on the impact speed. Alkaline ions (Na, K) dominate the mass spectra at low impact speeds. For higher impact speeds appear target ions (Rh), projectile material related ions and hydrogen ions (H). The systematics of characteristic atomic and molecular ion species in the mass spectra helps to get clues on the chemical nature of unknown projectiles in space. An improved model on specific ion yields can be given. Furthermore a lot of results which are important for the instrument calibration and the understanding offlight data, like global charge yields, rise times and sensitivities were obtained. First measurements on the inner instrument wall region are provided.
Contents
1 Introduction 1
2 The Heidelberg Dust Accelerator facility 5
2.1 The Heidelberg Dust Accelerator . . . 5
2.1.1 The new dust particle source . . . 7
2.1.2 Particle selection . . . 7
2.2 Projectile materials . . . 8
2.2.1 Aluminium, Al . . . 8
2.2.2 Carbon, C . . . 9
2.2.3 Sodium contaminated carbon, C-Na . . . 10
2.2.4 Iron, Fe . . . 10
2.2.5 Polyaniline coated polystyrene latex, PANi-PS-latex . . . 11
2.2.6 Polypyrrole coated polystyrene latex, PPY-PS-latex . . . 13
2.2.7 Other materials . . . 13
3 Experimental setups 15 3.1 The micrometeoroid detector CDA . . . 15
3.2 The micrometeoroid detector CIDA . . . 17
3.3 Instrument setup . . . 17
3.3.1 Mounting of CDA . . . 18
3.3.2 Mounting of CIDA . . . 18
4 Experimental results 21 4.1 Measurements with CDA . . . 21
4.2 Charge yields . . . 24
4.2.1 Charge yields at the Chemical Analyzer Target . . . 26
4.2.2 Charge yields at the IID-Target . . . 31
4.3 Time-of-flight mass spectroscopy . . . 33
4.3.1 Time-of-flight mass spectra . . . 33
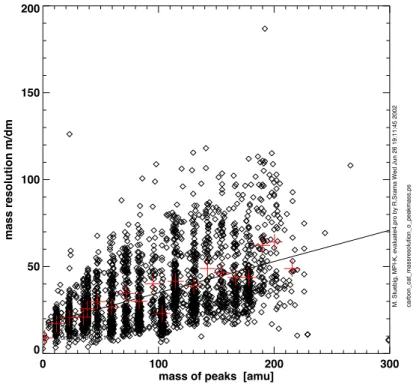
4.3.2 Mass resolution . . . 35
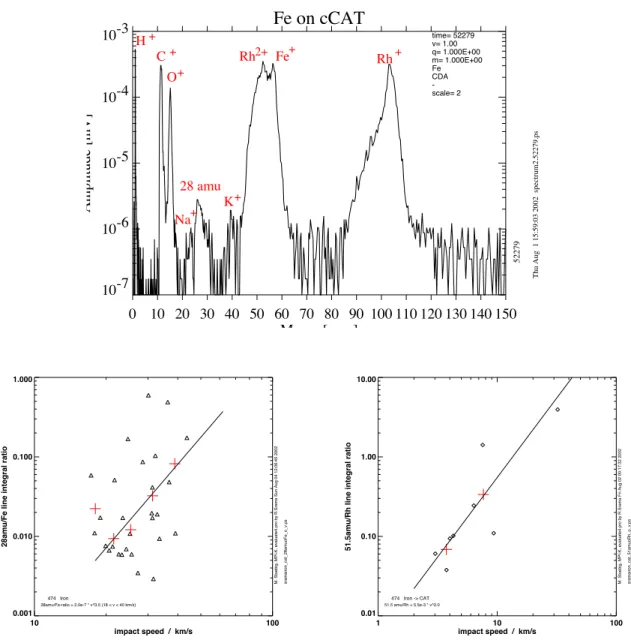
4.3.3 Ion plasma composition . . . 36
4.3.4 Absolute ion yields . . . 41
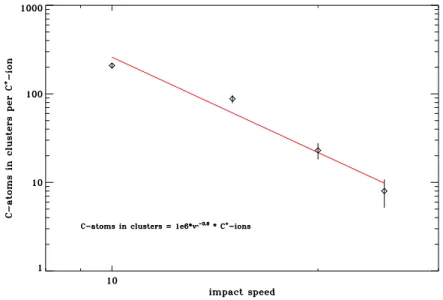
4.3.5 Formation of molecular ions and cluster ions . . . 45
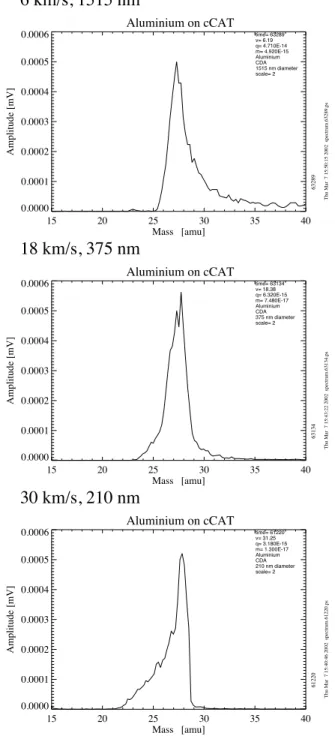
4.3.6 Possibly multiply ionized atoms . . . 54
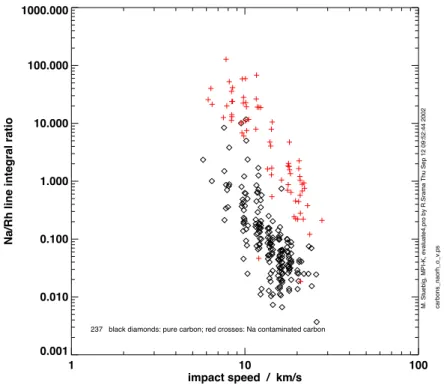
4.3.7 Contaminated projectiles . . . 59
4.3.8 Line shape . . . 60 vii
4.4.2 Negative ions . . . 64
4.4.3 Mass line identification . . . 68
4.4.4 Isotopic effects . . . 70
5 Discussion 73 5.1 Physical implications for the impact ionization process . . . 73
5.1.1 Comparison with the Galileo Dust Detector System DDS . . . 74
5.1.2 Comparison with lightflash observations . . . 75
5.1.3 Characteristics of mass lines . . . 76
5.1.4 A model of the impact ionization process . . . 79
5.1.5 Impact ionization regimes . . . 80
5.2 Determination of the impacting projectile type . . . 81
5.2.1 Projectile and target ion yield ratios . . . 81
5.2.2 A new model for specific ion yields . . . 86
5.2.3 Ionization degree of the projectile . . . 87
5.2.4 Identification of molecular ions and comparison with CIDA data . . . 93
5.2.5 Classification of the impacting projectile . . . 96
5.3 Appearance of higher ionization stages . . . 98
5.4 Comparison with laser-techniques . . . 99
6 Summary and Outlook 103 A Application of the new dust source 105 A.1 Achievable projectile speed and mass ranges . . . 105
A.2 Charging of particles . . . 108
A.3 Performance of the new dust source . . . 109
B Setups and data processing 115 B.1 Setup of CDA . . . 115
B.1.1 Mount for shots on CAT, IID and WALL . . . 115
B.1.2 Mount for shots on the central CAT . . . 116
B.1.3 General settings of the CDA instrument . . . 116
B.1.4 Vacuum pumping . . . 118
B.2 Data acquisition with CDA and CIDA . . . 119
B.2.1 Data acquisition with CDA . . . 119
B.2.2 Data acquisition with CIDA . . . 119
B.3 Evaluation of CDA and CIDA data . . . 121
B.3.1 CDA data . . . 121
B.3.2 CIDA data . . . 121
C Summary of the the CDA measurement parameters 125
D Calibration results for the CDAflight spare 143
D.1 Measurement of projectile charge, speed and incidence angle . . . 143
D.2 Charge yield measurements . . . 146
D.2.1 Charge yields for shots onto the CAT and IID . . . 146
D.2.2 Charge yields from shots onto the inner instrument wall . . . 146
D.2.3 Ion focussing . . . 157
D.3 Instrument sensitivity . . . 159
D.3.1 Absolute instrument sensitivity . . . 162
D.4 Detection of small and fast particles . . . 172
D.4.1 Extrapolation of the charge yields to very high impact speeds . . . 172
D.4.2 Instrument sensitivity for small and fast projectiles . . . 174
D.4.3 Comparison withflight data . . . 177
D.5 Rise times and time differences . . . 179
D.5.1 Signal rise times . . . 179
D.5.2 Time differences between signals . . . 186
D.6 Determination of the impact location . . . 191
D.7 Mass spectra of different projectile materials . . . 193
D.7.1 Verification of mass scale setting . . . 193
D.7.2 Correlation between impact speed and mass scale stretching . . . 196
D.7.3 Example spectra . . . 196
E Physical constants 207
Acknowledgements 209
Bibliography 211
Introduction
Denn, indem die um die Sonne in parallelen Zirkeln bewegte Elemente, in nicht gar zu großem Unterschiede des Abstandes von der Sonne genommen, durch die Gleichheit der parallelen Bewegung, beinahe in respektiver Ruhe gegeneinander sein: so tut die Anziehung der daselbst befindlichen Elemente von ¨ubertreffender spezifischer Attraktion sogleich hier eine betr¨achtliche Wirkung, die Sammlung der n¨achsten Partikeln zur Bildung eines K¨orpers anzufangen, der, nach dem Maße des Anwuchses seines Klumpens, seine Anziehung weiter ausbreitet, und die Elemente aus weitem Umfange zu seiner Zusammensetzung bewegt.
Immanuel Kant, 1755 It was Descartes (1637), whofirst proposed a nebular hypothesis for the formation of a planetary system around a central star. Kant (1755) postulated the importance of cosmic dust for the planet formation process in such a nebula. His student Laplace developed thefirst theoretical models of the nebula (LAPLACE, 1796). Nowadays, dusty discs can be observed around young stars (BECKWITH, S.V.W. et al., 1990). They accompany the star formation process and their role in planet formation is obvious (FAHR, H.J. and WILLERDING, E.A., 1998). Cosmic dust is a general term for the smallest solid bodies in space. They can be defined as grains from 0.02 - 200µm. The steps from condensation of single particles, the agglomeration to fluffy dust particles and the final accretion to planets are still not reliably understood. Comets count as residuals of the formation of our own solar system (WHIPPLE, 1978). Cometary dust should give hints on the formation and development of our solar system.
As well as the dust discs around stars interstellar dust is of interest. It is responsible for the reddening and weakening of star light proportionally to the stars’ distance (extinction). Sources of this interstellar dust might be the cool atmospheres of red giant stars, where sooty material condense (”carbon stars”). These particles might be similar to the presolar material, found in meteoritic material (CHOI, B.-G. et al., 1998). Optical spectra of dust discs around stars show silicate material (J¨AGER, C. et al., 1994). The measurement of isotopic abundances may allow clues to the origin of the dust grains.
The dust in our own 4.65 billion years old solar system is of secondary nature: produced by collisions of larger particles, by meteorite impacts on planetary and lunar surfaces, and by volcanism.
Small particles, calledβ-meteorites, move outwards in the solar system, pushed by the solar radiation pressure that exceeds the gravitational force for certain grain sizes. Only the comets, which sublime when they enter the inner solar system, may deposit original material from the time of the solar system formation (WHIPPLE, 1978). This interplanetary dust can be recognized as the zodiacal light,
the physical and chemical parameters of the interplanetary dust: grain sizes, temperature, chemical constitution (WEINBERG, J.L. and SPARROW, J.G., 1978). A topical summary on the results of dust research is given by Gr¨un (GRUN¨ et al., 2001).
When small particles enter the earth’s atmosphere with speeds of several kilometers per second, they glow up, and we can observe meteors. Very small particles, like cosmic dust, will not brake so violently. They might withstand the entry phase into the upper atmosphere and remain stable.
When one catches these particles with airplanes in the upper atmosphere, they can be analyzed with mineralogical methods (BROWNLEE, 1985). These particles (and also meteorites, that hit the planet’s surface) can be separated in different families (G¨URTLER, J. and DORSCHNER, J., 1993). The largest group are the stony meteorites, made of silicates, in analogy to terrestrial rocks. Furthermore there are carbonaceous chondrites (named by the included glass spheres: chondrules) with contents of organic material. They represent very undifferentiated matter, while iron meteorites, stone meteorites and stony-iron meteorites are differentiated by thermal processes.
Unfortunately the dust particles, which enter the atmosphere, lose their information about their origin and flight direction. They might be also contaminated with terrestrial material. These disad- vantages are avoided by observing cosmic dust in situ with instruments onboard spacecraft.
As mentioned above, detectors in space make it possible to observe cosmic dust particles in situ, as well as getting information about their velocities and trajectories. The effects of solar wind, magnetic fields and electric charging processes on the particles can be studied. Particles, produced by volcanism and meteorite impacts on surfaces of larger bodies in our solar system, can be investigated directly at their sources. Thefirst attempts of in situ measurements of cosmic dust have been performed with simple detectors on the Pioneer 8 - 11 spacecraft (BERGand RICHARDSON, 1968; HUMES, 1980), followed by instruments on the Heos and Helios missions (DIETZEL et al., 1973). With improved dust detectors onboard the Ulysses and Galileo spacecraft impact generated dust clouds around the galilean satellites and dust streams in the Jovian system, produced by volcanism on Jupiter’s moon Io have been discovered (GRUN¨ , E. et al., 1996; GRUN¨ , E. et al., 1997; GRAPSet al., 2000).
The dust detectors PIA onboard the Giotto spacecraft as well as PUMA1 and PUMA2 (Vega1, Vega2), carrying integrated time-of-flight mass spectrometers, encountered comet Halley during its last perihelion 1986, and found silicate and organic material in its coma and tail (KISSEL et al., 1986a; KISSELet al., 1986b; KISSELand KRUGER¨ , 1987). So called CHON-particles consist of light elements (H, C, N, O), or represent the mantle fraction of core-mantle-particles (GREENBERG and HONG, 1974). The element abundances in cometary dust are very similar to the chemical constitution of C1-meteorites, which represent the most undifferentiated matter in our solar system.
At present, the ”Cosmic Dust Analyzer” (CDA) onboard the Cassini spacecraft is on the way to Saturn (SRAMAand GRUN¨ , 1997). CDA combines the advantage of a large detector area, like the dust detectors onboard Galileo and Ulysses, with a simple time-of-flight mass spectrometer. The instru- ment already performed measurements during the interplanetary cruise. The Jupiter-flyby opened the unique opportunity of combined, simultaneous measurements of the Jovian dust with dust detectors on two spacecraft, Galileo and Cassini (KRUGER¨ et al., 2001).
Measurements with the dust detector on the Ulysses spacecraft led to the discovery of an interstel- lar dust stream, that enters our solar system (GRUN¨ , E. et al., 1994). How can this dust be separated from interplanetary dust by its chemical composition and its grain size distribution? New generation dust instruments with the combination of a large target area and an integrated time-of-flight mass spectrometer (e.g. Cosmic DUNE) with high mass resolution shall help to answer these questions.
Until now, the physical process during a hypervelocity impact (several km/s) of a projectile on a target with supersonic speed is still not fully understood. In this velocity region, the impact speed is faster than the wave propagation inside the target and projectile (MATTMULLER¨ , 1994). The impact process is described with a Hugoniot-function (WONDRASCHEK, 1997; REBER, 1997). It is assumed, that a large fraction of the impact energy is used for plastic deformation of the target and projectile.
Directly after the contact between projectile and target, a shock wave propagates through the mate- rials, and starts evaporation and ionization processes (DRAPATZ, S. and MICHEL, K.W., 1974). At highest impact speeds (v15 km/s) volume ionization of the material is the dominating ionization process, while at lower speeds surface ionization dominates. The plasma states are described by non- thermal equilibrium (HORNUNG, K. and KISSEL, J., 1994; HORNUNG, K. et al., 1996; HORNUNG, K. and DRAPATZ, S., 1981).
Dust detectors for in situ detection of micrometeoroids have to be calibrated on ground before they are launched into space. The method of simulating hypervelocity micrometeorite impacts is to accelerate micrometer sized grains to speeds as expected in space and let them impact on the detec- tors’ target areas. Such experiments are performed at the Heidelberg Dust Accelerator facility where electrically charged particles are accelerated by a potential difference of 2 MV up to speeds of 80 km/s.
This thesis deals with the ion formation process during hypervelocity microparticle impacts on solid metal surfaces and with the generation of time-of-fight mass spectra of projectiles that hit a metal target. To obtain data from a large variety of projectile materials a newly developed dust source has been applied to the Heidelberg Dust Accelerator, both described in Chapter 2. Besides iron projectiles aluminium and carbon particles were used. With the electrically conducting latex particles, organic projectiles were successfully accelerated for the first time at the Heidelberg Dust accelerator. In Chapter 3 are explained the two different dust detector instruments, the CDA flight spare unit and the CIDA engineering model, that were used for the measurements. Additionally their setups are described. The presentation of experimental results in Chapter 4 is focussed on the charge yields and the time-of-flight mass spectra. It was found that the charge yields from impact ionization processes are characterized by three impact speed regimes. In the later discussion (Chapter 5) this behavior is successfully compared with related studies of the impact ionization process. It turns out that the global charge yields in different impact speed regimes are consistent with present theories of the impact ionization. The results are summarized in Chapter 6. Additionally, an outlook to possible future aspects of hypervelocity impact experiments is given. The large appendix of this work is dedicated to the successfully application of the new dust source at the Heidelberg Dust Accelerator (Appendix A) and the importance of the results for the calibration of the CDA instrument (Appendix D). Appendix B and C give a detailed overview of the instrument setups, the data processing and the measurements.
The most important physical constants that are used in this work are summarized in Appendix E.
The results in this work are a further chapter to complete the understanding of the physical pro- cesses that appear at hypervelocity impacts. The opportunity of achieving time-of-flight mass spectra from the impact plasma allows the determination of chemical constituents in the plasma depending on the projectile composition and on the impact speed. The observations of alkali elements at low impact speeds and projectile as well as target material related ions at high impact speeds confirm and extend earlier studies and better characterize impact ionization models. New ion yield functions have been developed. The observation of characteristic molecular ion signatures in the time-of-flight mass spec- tra depending on the projectile material give us a rough clue on the chemical nature of any projectile that hit the Cosmic Dust Analyzer with impact speeds between 2 and several 10 km/s.
The Heidelberg Dust Accelerator facility
This chapter gives an overview of the Heidelberg Dust Accelerator facility. The working principle of the electrostatic accelerator and the newly developed dust source are explained in the following section (Section 2.1). The new dust source allows the use of various projectile materials which were used for impact experiments in this thesis. The different materials are described in Section 2.2 in detail, including their physical properties and their possible astrophysical relevance in space. Since this is thefirst work which uses the new dust source, empirical operation parameters (voltage settings, speed and mass ranges of projectiles) and a detailed evaluation of the dust source performance is given in Appendix A.
2.1 The Heidelberg Dust Accelerator
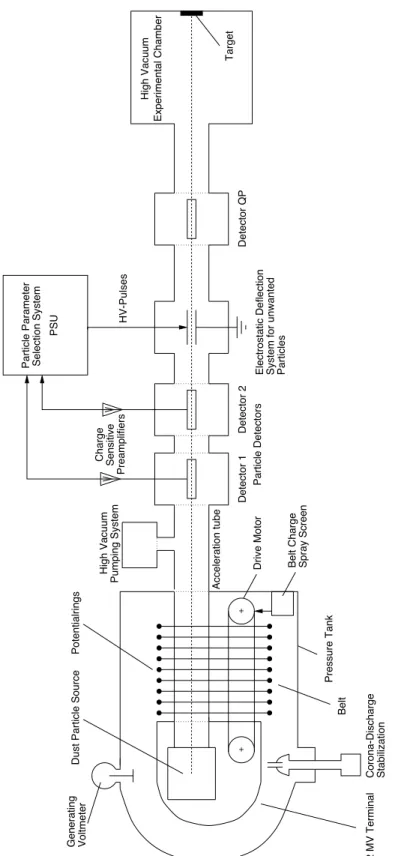
The development of the Heidelberg Dust Accelerator was done by Friichtenicht (1962). A Van-de- Graaf belt generator produces an acceleration voltage of 2 MV. This potential drops to ground (0 V) over a cascade of equipotential rings. This causes an electricfield gradient along the accelerators’
beam line. To avoid sparkling, the voltage generation proceeds in a pressure tank,filled with protection gas (SF6N2, 16 bar). This setup is shown in Figure 2.1. The beam line itself is evacuated to a vacuum of 104105 Pa (106107 mbar) with turbo molecular pumps, cryo-pumps and one ion-getter-pump. This system makes it possible to have a ”clean” vacuum without residuals of oil vapor, like for example from oil diffusion pumps. A clean vacuum is necessary for a reliable mass spectroscopy. Otherwise, these residuals might be seen as organic molecules in the mass spectra.
Mass spectra, obtained from organic projectile materials, like the latex samples in this work, would be disturbed by the oil contamination and are not reliable anymore.
PSU Experimental ChamberHigh Vacuum
Sensitive + Pressure Tank
+ Corona-Discharge Stabilization2 MV Terminal
Belt
Belt Charge
Drive Motor
Acceleration tube
Pumping System Spray Screen
High Vacuum
Generating VoltmeterDust Particle SourcePotentialrings Detector 1Detector 2
Particle Parameter Selection System HV-Pulses Electrostatic Deflection System for unwanted Particles
Detector QPTarget
Charge Preamplifiers Particle Detectors
Figure 2.1: Sketch of the 2 MV dust accelerator with particle selection unit and experiment chamber.
2.1.1 The new dust particle source
The heart of the accelerator is the dust particle source, invented by Shelton (1960). The dust source is directly connected to the beam line tube at the 2 MV terminal of the accelerator. All measurements in this work were performed with a newly developed dust source (except for iron projectiles, where the former dust source was used) (STUBIG¨ et al., 2001). A powder of electrically conducting particles resides in a cylindrical reservoir of 10 mm diameter and 25 mm length in vacuum (cf. Figure 2.2). In the reservoirs’ cylinder axis is located a 1 mm thick tungsten needle, sharpened to a few micrometer at its tip. Both the reservoir and the needle are connected to high voltage potential of 15 - 25 kV (with respect to the 2 MV of the Van-de-Graaf generator voltage). While the potential of the needle remains fix, the potential of the reservoir is frequently reduced with amplitudes of 10 - 15 kV (10 ms rectangular pulses at 25 Hz repetition rate, both values are adjustable). The time varying electric field inside the reservoir induces a charge on the dust particles. Due to Coulomb repulsion force, the particles start to swirl around. If a particle hits the thin tip of the tungsten needle, it will be charged by afield emission current from the tip to the particle. Now the particle has a surface potential between 100 and 1000 V, and a surface field strength of 108109Vm. The dust source has an extraction hole in 3 mm distance from the tip of the needle. Outside the reservoir is located a grounded (ground means the 2 MV of the accelerators’ high voltage terminal) extraction plate. Thefield between this plate and the needle potential extract the particle out of the reservoir. Collimation plates and focussing electrodes lead the particle into the 2 MV acceleration section. More details of operational parameters and speed mass distributions of projectiles, accelerated with the new dust source can be found in Appendix A.
2.1.2 Particle selection
Unique at the Heidelberg Dust Accelerator is the so called Particle Selection Unit (PSU, cf. Figure 2.1). It allows the experimenter to select ranges for the particle speed and the particle charge manually or via personal computer (cf. (RUDOLPH, 1966)). Thefinal speedvof the particle is given by energy conservation:
1
2mv2 qUB
v
2qUB
m (2.1)
whereq is the particles’ charge andmits mass. UB is the acceleration voltage of 2 MV (in the most experiments). In this way, a certain combination of charge and speed ranges allows also a mass selection of the particles.
If a particle left the dust source and passed the acceleration section, its speed and charge are mea- sured with influence tube detectors, connected to charge sensitive amplifiers. Theq- andv- values are passed to the PSU electronics, which compares the measured values with the range settings. If the values match the settings, a 4 kV-voltage on a deflection capacitor, which usually deflects all particles from the straight beam line, is switched to ground potential and the particle can pass the whole beam line to the experiment chamber. The PSU allows to shoot particles in a continuous mode as well as in a single particle mode.
Figure 2.2: Function principle of the dust source. This vertical Section shows how the dust sample (black) resides inside the reservoir (red). A time varying voltage swirls the particles up, a charging needle(green) gives the final charge to the particles. A grounded extraction plate (blue) pulls the charged particles out of the reservoir.
2.2 Projectile materials
The new dust particle source at the Heidelberg Dust Accelerator allows an efficient use of different projectile materials. But the restriction on particles, that are electrically conducting still remains. The final speed after acceleration is proportional to the square root of the charge/mass-ratiomq (cf. Eq.
2.1). The maximum grain size, that can be extracted from the dust source, is empirically measured to 3µm for aluminium projectiles. In the following subsections the projectile materials, that have been used in this work, are listed in alphabetical order. Additionally to the chemical and physical properties of the materials, the mineralogical background, why this specific material has been used, is given.
2.2.1 Aluminium, Al
Aluminium is an easily deformable metal with a low density of 2700 kgm3. Since it can easily be charged, high charge/mass-ratios mq can be achieved, leading to high projectile speeds. Despite the fact that metallic aluminium is not expected in meteoritic material, it belongs to the most abun- dant elements in the solarsystem and was found in many meteorites (BEATTY, J.K. et al., 1999a).
Aluminium is also an important contributor to feldspar minerals that appear in planetary crusts (60
Vol.%) (MATTHES, 1996). The exceptionally low ionization potentials of aluminium (cf. Table 2.1) might allow to obtain multiple ionized ions, and therefore to get a deeper insight into the ionization process from the hypervelocity impact. The aluminium samples used in this work were obtained by Dr. Groebl and Dr. Besold 1976 from Eckart-Werke, F¨urth, Germany. A picture of the sample and it’s grain size distribution is given in Figure 2.3. It appears an obvious large discrepancy between the grain size distribution of the sample and the size distribution of the accelerated particles. For all other samples in this work the output of the dust source reflects very well the grain size distributions that were obtained by electron microscopic analysis. A new grain size analysis of the sample by Thomas Stephan, Universit¨at M¨unster, confirmed the discrepancy. The sample wasfilled into a glass container in 1977 by Pailer together with Argon as protection gas.
Figure 2.3: The left figure shows a SEM-picture of the used aluminium particles (sample Al76.027.006). The right figure reflects the grain size distribution of 320 particles on the picture (black histogram). The red histogram shows the grain size distribution of 20000 aluminium projec- tiles, measured from the PSU at the Heidelberg Dust Accelerator.
2.2.2 Carbon, C
Apart from hydrogen and helium, carbon is one of the most abundant elements in the universe (AN-
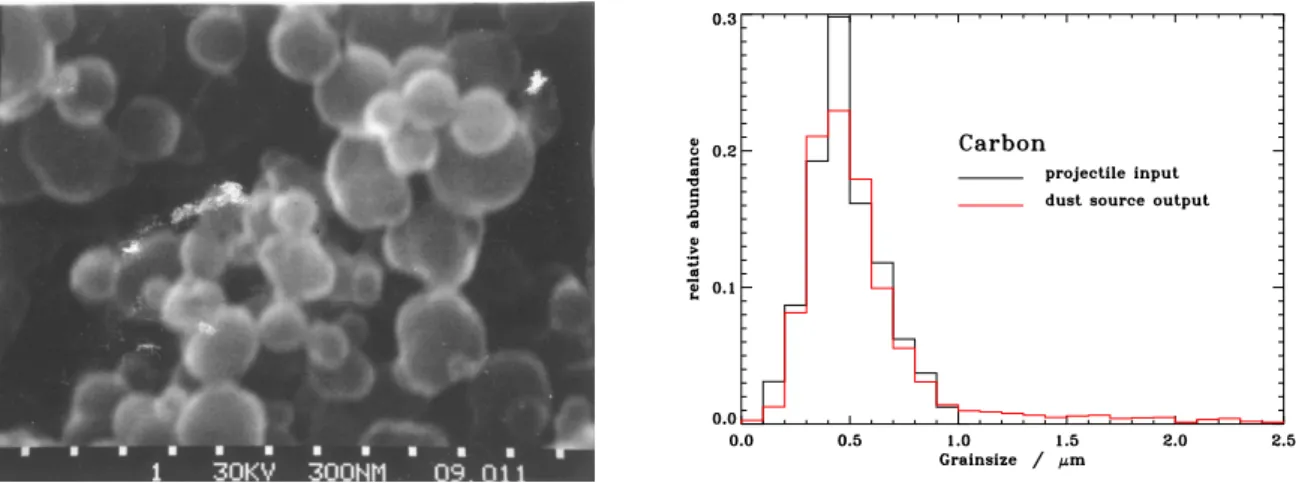
DERS, E. and GREVESSE, N., 1989). It is the main part of organic molecules detected in molecular hydrogen clouds (HII-regions) in the interstellar medium (cf. (UNSOLD¨ , A. and BASCHEK, B., 1991)). Carbonaceous chondrites and comets (their dark surfaces and optical spectra allow clues to their high carbon content) are regarded as residuals of the primordial matter, from which our own solar system formed (BEATTY, J.K. et al., 1999b). Furthermore carbon is produced as soot in the cool atmospheres of giant red stars, so carbon/graphite should be expected in interstellar meteoroids (FRENKLACHet al., 1989). On planetary surfaces, carbonate rocks indicate the (former) occurrence of liquid water (BEATTY, J.K. et al., 1999c; BEATTY, J.K. et al., 1999a). Volcanic activity may enrich planetary atmospheres with carbon oxides, and carbonatite lava may cover large areas on planetary surfaces (HOFFMAN, 1999; NORTONand PINKERTON, 1992; FEGLEYand ZOLOTOV, 2000). Carbon has a density of 2200 kgm3and high ionization potentials, given in Table 2.1. For this work samples of the lot 70.012.002 were taken. They were acquired in 1970 from an unknown producer. Figure 2.4 gives an impression of the mostly sub-micrometer sized particles. The particles were preserved in a
Figure 2.4: The leftfigure shows a SEM-picture of the used carbon particles (sample C70.012.002).
The right figure reflects the grain size distribution of 161 carbon particles on another picture (black histogram). The red histogram shows the grain size distribution of 3960 carbon projectiles, measured from the PSU at the Heidelberg Dust Accelerator.
2.2.3 Sodium contaminated carbon, C-Na
Sodium, as well as potassium, is well known as contaminant on the target surface of impact ionization dust detectors. Due to their chemical nature, alkaline elements (Alk) like sodium and potassium have very low ionization potentials for the Alk-ion (cf. Table 2.1). Thus, alkaline elements usually pro- duce prominent signatures in time-of-flight mass spectra (DALMANNet al., 1977). Io, the innermost of Jupiter’s Galilean satellites, is surrounded by a sodium cloud that might contaminate the dust parti- cles, which are ejected from Io’s volcanic activity (TRAFTONet al., 1974). To see, if the time-of-flight mass spectra from sodium-contaminated projectiles can be distinguished from uncontaminated pro- jectiles, a sample of ”sodium coated” carbon particles was produced. For this, a sample of the above mentioned carbon particles and a cube of pure sodium were put together in a closed glass container and kept two weeks at room temperature (20ÆC). The vapor pressure of sodium at room temper- ature is in the order of 108 Pa (1010 mbar) (GMELIN-INSTITUT FUR ANORGANISCHE¨ CHEMIE, 1965). This should prevent a coating but lead to a contamination of the carbon powder. Unfortunately, an estimation of the amount of adsorbed sodium on the surfaces of the carbon particles is not possible.
The grain size distribution of the accelerated particles is equal to that of Figure 2.4.
2.2.4 Iron, Fe
Iron is the easiest material to shoot with at the dust accelerator. Since it works also well with the former dust source, it has been used as reference material for the calibration of all previous dust detectors. Thus, iron has also been used in this study, and is additionally used as reference material for the wall shots. With 7900 kgm3, iron is the projectile material with the highest density from the given selection. Due to its high conductivity, iron is easy to charge, and despite the high density, good charge/mass-ratios are achievable. The most important ionization potentials of iron are 7.87 eV for
Feand 16.18 eV for Fe2(cf. Table 2.1). The iron sample is a mixture of 67 Vol.% iron particlesFe 70.056.714 produced 1970 by BASF, Ludwigshafen, and of 33 Vol.% iron powder consisting of 20 nm small spheres produced by Goodfellow, Bad Nauheim. Due to the achievable high charge/mass- ratio, the latter particles should provide very fast projectiles with impact speeds of several ten km/s.
The BASF particles were filled in glass containers with Argon atmosphere by Pailer in 1977, the Goodfellow sample still remains in its original tin. The samples were produced as carbonyl-iron (FeCO5) with a purity99 %. Figure 2.5 shows a picture of the BASF iron sample and its grain size distribution. The Goodfellow sample (not shown here) consists of 20 nm monospherical particles that tend to form clusters with sizes up to 100 nm. From the mineralogical point of view, the iron projectiles represent the class of iron-nickel-meteorites. The material of these highly differentiated meteorites must have undergone thermal processes in the interior of large planet-like bodies, before it was released into space by a deep impact event on the parent body. For example, iron-nickel-alloys are expected in the earth’s core. When corroding iron-nickel-meteorites with acid, they show the so called Widmanst¨attenfigures, pattern from a long-term recrystallization process, which manifest their extraterrestrial origin.
Figure 2.5: The left figure shows a SEM-picture of the used BASF iron particles (sample Fe70.056.714). The right figure reflects the grain size distribution of 492 iron particles on the pic- ture (black histogram). The red histogram shows the grain size distribution of 20080 iron projectiles, including the Goodfellow-sample. These latter data was measured from the PSU at the Heidelberg Dust Accelerator.
2.2.5 Polyaniline coated polystyrene latex, PANi-PS-latex
As mentioned in the introduction and in Section 2.2.2, organic matter can be found in cometary and meteoritic material as well as in the interstellar medium. In this work for thefirst time, organic pro- jectiles have been used for the calibration of impact ionization dust detectors. The latex particles are a kind of core-shell-particles, produced by S. Armes and his group at the University of Sussex. Elec- trically non-conductive polystyrene cores have been coated with thin layers of conductive polyaniline by polymerization in an aqueous solution (BARTHET, CHR. et al., 1998a; BARTHET, CHR. et al., 1998b). To obtain a regular layer thickness, a nearly mono-disperse sample of particles (shown in Figure 2.7) have been used for coating. Polystyrene latex is a chain of aromatic molecules, con-
a)
C H
C H
H
b)
N H
N H
N H
Figure 2.6: The left hand figure a) shows the chemical structure of polystyrene, which is the core material in all latex samples. The sketch b) on the right shows a chain of polyaniline molecules, used as coating material.
The sample in this study was kindly provided by M. Burchell, who first reported successful acceleration of latex at Canterbury, UK with a particle accelerator, similar to that at Heidelberg (BURCHELL, M.J. et al., 1999). The particles have 075004µm diameter, including 10 nm polyani- line coating. The mean density of the particles is 1100 kgm3, and therefore the lowest density of all projectile materials in the present study. Thus, latex projectiles represent the density of water ice (1000 kgm3), which is very abundant in space. For ”fluffy” particles, loose conglomerates of small grains, densities even below this value are expected (BROWNLEE, 1985). The core-shell structure (cf.
Figure 2.8 b)) may additionally represent the core-mantle particle type as postulated by Greenberg (1974) for interstellar dust: a mineral core, surrounded by organic molecules and ices.
Figure 2.7: The leftfigure shows a SEM-picture of the used PANi-PS-latex particles. The rightfigure reflects the grain size distribution of 111 particles on the picture (black histogram). The red histogram shows the grain size distribution of 2670 projectiles, measured from the PSU at the Heidelberg Dust Accelerator.
2.2.6 Polypyrrole coated polystyrene latex, PPY-PS-latex
Like the polyaniline coated polystyrene latex, this sample is also produced by S. Armes, and pro- vided by M. Burchell. The material density is again 1100kgm3. The grain size distribution is also monodisperse, but larger in size: 158013µm. The grain size distribution in Figure 2.9 shows a small portion of particles with grain sizes even below 1µm. The particles are coated with a 14 nm layer of polypyrrole (LASCELLES, S.F and ARMES, S.P., 1997; LASCELLES, S.F et al., 1997). The polypyrrole molecule is shown in Figure 2.8 a). Figure 2.8 b) shows the core-shell structure of a coated particle. The structure of the coating is like a golf ball surface as can be seen in Figure 2.9.
a)
N H
N H
N H
N
H b)
stabilyzer PS latex core PANi/PPY coating
Figure 2.8: Figure a) shows the molecular structure of polypyrrole. The general core-shell character of the coated polystyrene latexes is shown in thefigure b) on the right hand.
Figure 2.9: The leftfigure shows a SEM-picture of the used PPY-PS-latex particles. The rightfigure reflects the grain size distribution of 175 particles on another picture (black histogram). The red his- togram shows the grain size distribution of 3310 projectiles, measured from the PSU at the Heidelberg Dust Accelerator.
2.2.7 Other materials
The projectile materials mentioned above cover a wide range of astrophysically relevant minerals.
Nevertheless, a very important group is missing: silicates. In an earlier study by G¨oller and Gr¨un (1989) was reported the acceleration of zinc coated silicon-dioxide particles (SiO2). Unfortunately,
tested at silicon-dioxide spheres (SiO2) and natural silicates, couldn’t handle the problem of particle agglomeration: the micrometer- and submicrometer-sized particles clump together and form agglom- erates of several ten micrometers (STUBIG¨ , 1999). Kuhn (2002b) succeeded to get silicon signatures in the time-of-flight mass spectra from accelerating polypyrrole particles with 80 Vol.% silicon (Si) incorporated into the matrix.
Material Ionization potentials / eV electron configuration
X X2 X3
1 H Hydrogen 13.60 - - 1s1
12 C Carbon 11.26 24.38 47.89 (He)2s22p2
14 N Nitrogen 14.53 29.61 47.45 (He)2s22p3
16 O Oxygen 13.62 35.12 54.93 (He)2s22p4
23 Na Sodium 5.14 47.29 71.64 (Ne)3s1
27 Al Aluminium 5.99 18.83 28.45 (Ne)3s23p1
28 Si Silicon 8.15 16.35 33.49 (Ne)3s23p2
39 K Potassium 4.34 31.63 45.72 (Ar)4s1
56 Fe Iron 7.87 16.18 30.65 (Ar)3d64s2
103 Rh Rhodium 7.46 18.08 31.06 (Kr)4d85s1
CxHy Hydrocarbons 8 - 12
Table 2.1: Overview of the ionization potentials of different projectile-, contamination- and target- materials. Additionally are given the electron shell configurations of all materials. The data were taken from St¨ocker (1994).
Experimental setups
The following Section 3.1 explains the function principle and technical properties of the Cosmic Dust Analyzer instrument (CDA) including a very brief overview of the Cassini-Huygens mission to Saturn. Section 3.2 is dedicated to the time-of-flight mass spectrometer Cometary and Interstellar Dust Analyzer (CIDA). CIDA has a smaller target area than CDA. But since CIDA has a reflector unit for the ions in its drift tube, the obtained time-of-flight mass spectra have afirst order energy correction, and therefore a much higher mass resolution. Section 3.3 of this chapter describes roughly the setups for the experiments that have been performed at the Heidelberg Dust Accelerator facility for this thesis. More details on the general instrument settings, the vacuum pumping process, the impact locations and on data acquisition and evaluation are given in Appendix B.
3.1 The micrometeoroid detector CDA
The Cosmic Dust Analyzer (CDA) was developed for the investigation of dust in the vicinity of Saturn (SRAMAand GRUN¨ , 1997; SRAMAet al., 2002). During the 7 year long cruise to Saturn, CDA is used for the measurement of interplanetary and interstellar dust particles and streams. The dimensions of CDA are 0.7 x 0.45 x 0.8 m3, the total weight is 17.2 kg. CDA can be rotated on a turntable within an angle of 270Æ. The internal operating voltage is 30 V, the maximum power consumption 12 W.
CDA is designed to withstand a radiation energy dose of 1000 Gy (100 krad). A detailed instrument description andfirst instrument calibration is given by Srama (2000).
The function principle of CDA is shown in Figure 3.1. Due to solar wind and solar UV interactions (photo effect), it is expected that dust particles in space carry surface charges (DRAINE, B.T. and SALPETER, E.E., 1979). For the solar system equilibrium potentials of several Volts are assumed, depending on local conditions. This surface charge can be detected with a pair of inclined grids, connected to a charge sensitive amplifier (channel QP). To avoid noise and disturbances, the grids are shielded by grounded grids. Each grid has a transmission of 95 %. To influence a measurable signal on the grids, a minimum charge of 1015C is necessary. The particles’ charges, impact speeds and entrance angles can be acquired from the rise times and amplitudes of the trapezoid-like charge signals. This allows to detect dust streams in the solar system.
After passing the grids, the particle, depending on its trajectory, will hit a central rhodium target of 160 mm diameter (Field of View: 28Æ), a surrounding gold target of 410 mm diameter (Field of View:
45Æ) or the instrument wall. In the central region of the instrument, 230 mm in front of the rhodium target, resides a secondary electron multiplier and three grids (the two outer grids as shielding), which measure the charge signal of the ejected ions from the impact plasma. A bias voltage of -350 V on the
Figure 3.1: Schematic view of CDA. The trajectories of dust particles, that hit the Chemical Analyzer Target (red) and the Impact Ionization Detector (black), are shown. The right handfigure shows the corresponding signals on the sensitive channels of CDA.
grids is focussing the ions towards the multiplier.
The grounded gold target is a simple impact ionization detector (IID). The -350 V of the ion grids separate the impact plasma. The IID measures the remaining electron charge and the rise time of the charge signal (channel QT, QE). Laboratory calibrations of the impact signals allow clues on the impact speed and the mass of the projectile.
The rhodium target functions as target of a simple time-of-flight mass spectrometer (”Chemical Analyzer Target”, CAT). The CAT is biased with +1000 V. 3 mm in front of the CAT is located a grounded grid (68 % transmission). This strong electric field ( 330 kV/m) divides the plasma nearly totally in electrons and positive ions. The ions are accelerated towards the multiplier, while the electron charge signal and it’s rise time are measured at the CAT (channel QC). The -350 V of the ion grids in front of the multiplier focus the ions. The total ion charge, that reaches the multiplier, is measured at the middle grid (channel QI). Ions, that hit thefirst dynode of the multiplier, release electrons from the dynode surface. A cascade of in total 10 dynodes, and a total potential difference of
3 kV between thefirst and the last dynode, lead to secondary electron emission. The output signal of the multiplier (channel QM) depends on the arrival time of the ions, while the signal amplification depends on the dynode voltage. The differences of the ion arrival times at the multiplier are related to their charge and mass. The energy conservation in Eq. 3.1 describes the correlation between the ion massmion, ion chargeqion (usuallyqion161019C), and theflight timet. Note, that this equation is simplified for acceleration directly at the target (which is nearly realized by the grounded grid in 3 mm distance from the CAT).
qionU 1
2mIonv2ion
mion 2qionU
d2 t2 (3.1)
The parametersU andd are the biased target voltage and the distance between the target and the multiplier. This correlation gives the instrument the name time-of-flight mass spectrometer.
The instrument has a dead-time of 1 s. Event rates higher than 1 particle/s can be measured with the High Rate Detector (HRD), that is placed below the entrance grids of CDA. Fast particles penetrate a system of thin foils. The foils form a simple plate capacitor. The damage caused by the penetrating particle leads to a measurable change of the capacity. In this way, event rates up to 104particles/s can be detected.
Further information on the CDA instrument and on recent results can be found in (SRAMAet al., 2002) and on the web athttp://www.mpi-hd.mpg.de/dustgroup/. A detailed description of the Cassini- Huygens mission is given athttp://www.jpl.nasa.gov/cassini/.
3.2 The micrometeoroid detector CIDA
The Cometary and Interstellar Dust Analyzer (CIDA) is a dust particle detector for in situ measure- ments, that makes it possible to achieve high resolution time-of-flight mass spectra from microme- teorite impacts. CIDA has only a silver target of 100 mm diameter, separated in several sections.
In analogy to the Chemical Analyzer Target of CDA (cf. Section 3.1), the target, a bias voltage on the target itself and a grounded grid 3 mm in front of the target, form the acceleration section of a time-of-flight mass spectrometer. In contrast to CDA, the target voltage of CIDA can be switched to negative polarity. This allows the measurement of electrons and negatively charged ions.
CIDAs’ ion drift zone is more complicated than that of CDA. A reflector unit with an electric counter-field brakes the ions, which were accelerated at the target, and reflects them like a mirror.
This configuration is shown in Figure 3.2. Fast ions will penetrate deeper into the counter-field than slow ions. In this way, the energy distribution of the plasma ions is corrected in first order. The reflected ions are registered at a microchannel plate, which is more sensitive than a multiplier as used for CDA.
Since CIDA has no further detector area like CDAs’ IID, the disadvantage of CIDA, compared to CDA, is the small target area of 80 cm2.
CIDA has been developed for the investigation of cometary and interstellar dust (BROWNLEE
et al., 1997; BROWNLEEet al., 2000). The instrument is part of the Stardust spacecraft, on a cometary nucleus flyby at comet Wild 2. Additional information on the Stardust mission, the spacecraft and CIDA itself are available athttp://stardust/jpl.nasa.gov/.
3.3 Instrument setup
For the experiments, the CDAflight spare and the CIDA engineering model were installed in a large vacuum chamber at the end of the dust accelerator’s beam line (1.4 m free diameter due to the cooling and heating systems inside the chamber), approximately 8 m behind the 2 MV terminal (cf. Figure 2.1). A movable table inside the chamber allows the movement of experiments, perpendicular to the
Figure 3.2: Cut through the CIDA instrument. The target area is on the right hand, the reflector unit for energy correction is shown on the left.
beam line in y-direction with a total range of 300 - 400 mm. The table can be moved manually by external steerers. Additional steerers allow movements in other degrees of freedom, e.g. z-direction or rotation. The chamber itself isfitted with electric heating coils and a cooling system (liquid nitrogen).
Thus, the inner temperature of the chamber can be regulated between +80 and -100ÆC.
3.3.1 Mounting of CDA
Figure 3.3 shows the instrument inside the vacuum chamber, mounted on a turntable for shots on the central CAT-target. For shots on the outer CAT region, the IID-target and the instrument wall has been build an extrafixture that allows movement in y-direction. The setup and the various shoot positions are explained in detail in Appendix B.1.
3.3.2 Mounting of CIDA
The large dimensions of CIDA don’t allow large movements with the table inside the chamber. For the measurements in this work, CIDA was installed on a self-madefixture in such a way, that the particle beam hit the central Section of the silver target as shown in Figure 3.4. The inclination angle of the beam was nearly 0Æin y- and z-direction.
For the further measurements with the instruments, the experiment chamber has to be evacuated to high vacuum. The pumping process is explained in Appendix B.1.4.
Figure 3.3: Vacuum chamber with CDA (here shown: engineering model), mounted on a turntable for shots on the central CAT section. Accelerated projectiles enter the vacuum chamber from the right side. At the far right side of thefigure the vacuum tube from the accelerator beam line is visible.
Figure 3.4: The CIDA engineering model, mounted in the vacuum chamber for shots on the central target section. The red spot from a laser indicates the position of the dust particle beam focus.
Experimental results
Most experiments have been performed with the dust detector instrument CDA. A brief overview of the used projectiles, target regions and impact speed ranges is given in the following section. A more detailed listing of the experiments can be found in Appendix C. The most important results of this work are the impact charge yields and time-of-flight mass spectra of different projectile materi- als. Section 4.2 describes the observation of charge yield functions for impacts on the CAT- and the IID-target that show characteristic variations depending on the impact speed. As shown in Section 4.3, time-of-flight mass spectra of all used projectile materials could be obtained. The results show characteristic changes of the impact plasma composition depending on the impact speed. The data sets allowed the determination of absolute charge yields for different ion species. Mass spectra from different projectile materials can be distinguished by specific atomic and molecular ions. For the car- bon and latex samples have been observed molecular clusters and hydrocarbons with atomic weights up to 200 amu. The unique opportunity of measuring with the CIDA engineering model arised. This allowed to obtain time-of-flight mass spectra of the organic PANi-PS-latex sample with a three to four times higher mass resolution (Section 4.4).
4.1 Measurements with CDA
Experiments for CDA were performed with the six different projectile materials that are mentioned in Section 2.2 on page 8 ff. From the full range of projectile speeds small impact speed intervals [v0-0.5 km/s,v0+0.5 km/s] with evenv0values (except for iron and PPY-PS-Latex) were taken in steps of 2 km/s. The setting of narrow speed ranges should prevent a selection effect: a huge majority of the non-monospheric projectiles released from the dust source are ”big” (d 1.0µm) and slow (v8 km/s) particles. The additional setting of mass intervals (via the setting of charge intervals for the projectiles) was not possible, since the charge measurement of the particle selection unit (PSU) often failed. This work is also thefirst work that tries to give an estimation of the distribution of the impact charge and the implications for the actual instrument sensitivity of CDA. Therefore the number of projectiles that definitely reached the CDA instrument (controlled via the last charge detector QD in the beam line directly in front of the vacuum chamber) was compared with the number of projectiles that were actually registered by the instrument, whether the instrument internal classification classifies the event as noise or as a proper impact event.
Table 4.1 gives an overview of the data set with registered events for all projectile materials and target sections. The abbreviations of the target sections are explained in detail in Section 3.3. The 2656 events were taken from 5230 shots in total. Additionally, signals from 1924 events that Srama
of events that were registered are given in Tables C.3 to C.8 respectively in histogram form in Figures C.1- C.5 in Appendix C. Additionally, three examples of raw data from shots with PANi-PS-latex on the CAT, the IID and the inner instrument wall (Figures C.6 - C.8 are given in Appendix C.
MaterialcCAToCATcIIDoIIDcWALLoWALL nv[km/s]nv[km/s]nv[km/s]nv[km/s]nv[km/s]nv[km/s]total Aluminium3322-50332 Carbon1582-182462-25244-16184-16144-18460 Carbon+Na1354-28135 Iron1272-501522-401202-401102-401302-40639 PANi-PS-latex2644-221744-191004-191004-19834-19854-19806 PPY-PS-latex1022-8472-8492-8422-8442-8284 total8896493232872492592656 Table4.1:SummaryofalleventsthatwereregisteredbytheCDAFSbyshootingprojectilesonthedifferenttargetsections(cCAT=centralCAT target,oCAT=outerCATtarget,cIID=centralIIDtarget,oIID=outerIIDtarget,cWALL=centralinstrumentwall,oWALL=outerinstrument wall.TheexactgeometricshootpositionsaredescribedinSectionB.1).
This section deals with the electron and ion charge that is produced by hypervelocity impacts. The first subsection 4.2.1 is dedicated to shots on the Chemical Analyzer Target. The next subsection gives the results from shots on the Impact Ionization Target (IID).
Figure 4.1 shows, how the total ion charge from impacts on the CAT-target scatters around in the instrument. Not all ions that are produced at the impact site QC will reach the multiplier. Due to a limited transmission of the grids (the acceleration grid has only 68 % transmission, the three ion grids in front of the multiplier 90 %, 50 % and 90 %) only 27.5 % of the ions can reach thefirst multiplier dynode. Further losses will appear due to poor focussing of the ions, which have an intrinsic energy and angular distribution from the impact. Figure 4.1 shows, that the ion grid detects only 15 % of the total charge at QC. With rising impact speed a rising portion of the total charge gets out of the instrument through the entrance grids. Additionally a few percent of the ions hit the IID target at very low impact angles (QE/QC-ratio). Although it cannot be measured, it is obvious, that a similar ion portion that hits the IID target or leaves through the entrance grids will also hit the instrument wall. The movement of ions and electrons inside the instrument was also simulated with the ion-optic software tool SIMION (GRUN¨ , E. et al., 2002).
1 10 100 impact speed / km/s
0.01 0.10 1.00
QI/QC charge ratio M. Stuebig, MPI-K, evaluate4.pro by R.Srama Sun Aug 04 18:36:59 2002 alu_ccat_qioqc_o_v.ps
198 Aluminium QI/QC = 0.07 * v^0.24
1 10 100
impact speed / km/s 0.001
0.010 0.100 1.000
QP/QC charge ratio M. Stuebig, MPI-K, evaluate4.pro by R.Srama Sun Aug 04 18:56:04 2002 alu_ccat_qpoqc_o_v.ps
198 Aluminium QP/QC = 1.1e-3 * v^0.9
1 10 100
impact speed / km/s 0.0001
0.0010 0.0100 0.1000 1.0000 10.0000
QE/QC charge ratio M. Stuebig, MPI-K, evaluate4.pro by R. Srama Wed Jun 12 16:23:57 2002 alu_ccat_qeoqc_o_v.ps
335 Aluminium on cCAT
Rising from 1e-3 to 0.02 for v < 10 km/s; rising slowly up to 0.05 for 10 < v < 50 km/s; or QE/QC approx. 1 ...
1 10 100
impact speed / km/s 10-11
10-10 10-9 10-8
QC/QM charge ratio / C/unit M. Stuebig, MPI-K, evaluate4.pro by R.Srama Sun Aug 04 19:48:15 2002 alu_ccat_qcoqm_o_v.ps
198 Aluminium
QC/QM = 9.7e-9 * v^-2.3 (v < 14 km/s) ; QC/QM = 8.2e-13 * v^1.3 (v > 14 km/s)
Figure 4.1: Charge ratios of the channels QI/QC (upper left diagram), QP/QC (upper right diagram) for aluminium projectiles and QE/QC (lower left diagram). The lower right diagram shows the ratio of the total charge of the CAT channel QC against the multiplier integral QM.
The CAT consists of rhodium and is the best suitable target of the CDA instrument to receive reliable information on the total charge from hypervelocity impacts. The +1000 V bias voltage on the target and the grounded grid 3 mm in front of the target provide a strong electricfield of 333 kV/m. Thisfield penetrates the impact plasma and separates it into electrons and negative ions and into positive ions.
The electrons and negative ions remain at the positively charged target area, while the positive ions are accelerated away from the target towards the multiplier. The results of the charge yield measurements depending on the impact speeds are shown in Figures D.4 to D.6 in Appendix D.2. Earlier works ((DIETZEL et al., 1973; G ¨OLLER and GRUN¨ , 1989; RATCLIFF, P.R. et al., 1997)) already tried to describe the charge yield with power laws of the type
qcmαvβ (4.1)
All authors report the mass coefficientαin Eq. 4.1 to be 1.0. Ion formation models from Kissel and Kr¨uger (1987) predict values forαbelow 1.0. The polyaniline-coated polystyrene latex sample in this work has a very narrow grain size distribution. This provides projectiles of a well defined mass.
The left diagram in Figure 4.2 shows the mass distribution of 213 PANi-PS-latex particles that hit the CAT of the CDA instrument and generated a time-of-flight mass spectrum. For impact speeds between 6 and 16 km/s the projectile mass varies only by a factor of 2 from the nominal massm0of 241016 kg. Aluminium and iron projectiles show a mass variation of more than two decades in the same velocity range. Ifqis not proportional tom(α10), the projectile grain size may have influence on the impact plasma and falsify the results for the charge yield. The right diagram in Figure 4.2 shows the absolute charge yield as function of the impact speed for the 213 latex projectiles, which generated mass spectra. For particles with masses between 16321016 kg (m100033m0), a least squarefit of the form
qcvβ (4.2)
gives values of 691016forcand 2.6 forβ.
A least square fit in the form of Eq. 4.1, assumingα to be 1.0 results into values of 1.0 for c and 3.0 forβ(cf. Figure 4.2). Plotting only the mass distribution depending on the impact speed for all particles with m030 % (not shown here) one derivesm∝m0v04 which exactly explains the deviation in the impact speed power. The results allow the assumption that the mass coefficientαis 1.0 for all measurements.
The impact charge distribution of the projectiles in Figure 4.2 shows a scatter of the data within a factor of 3. As shown in Table 4.2, the standard deviation of the produced impact charge is about 30
% of the mean value at constant projectile impact speed (∆vv 007) and mass (∆mm 03).
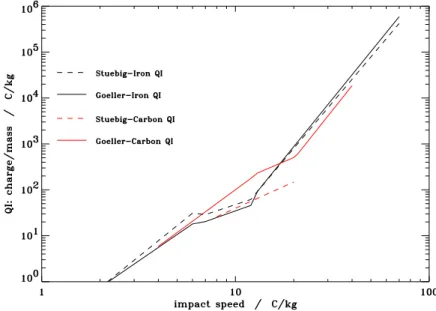
Figure 4.3 shows an example of the charge yield determination for iron projectiles. The power law for the charge production depends on the impact speed regime. For iron projectiles, as shown here, and three regimes with different charge yield functions appear. The same behavior has been observed for carbon projectiles, while aluminium projectiles show only two impact speed regimes, latex only one.
The error of the power coefficient is approximately 10 %. Regarding Table 4.3, it turns out that the power laws change in a characteristic manner: highv-powers at low impact speeds (v102 km/s), lowerv-powers at medium impact speeds (10v20 km/s) and again high powers at high impact speeds (v20 km/s). Events that show no spectra (black diamonds in Figure 4.3) show a larger