J. din. Chem. Clin. Biochem.
Vol. 19, 1981, pp. 947-952
A Comparison of Eleven Commercial Kits for the Determination of Serum Ferritin Levels By W. G. Wood
Klinik fur Innere Medizin (Direktor: Prof. Dr. med. P. C Scriba) Medizinische Hochschule Lübeck (Received February 1 I/May 11, 1981)
Summary: Eleven commercial kits for serum ferritin have been compared. Seven kits used RIA and four IRMA methodology. Seven kits used human liver ferritin, two human spleen ferritin and two undefined human ferritin as standard material. Incubation times varied between 30 minutes and 36 hours. Only four kits gave normal ranges determined with the kit in question. All values were compared with the kit in routine use. Although correlation of results was good in 10 cases, (r = 0.903-0.993) the numerical values varied greatly, (slope of the regression line b = 0.437-1.94). These values were obtained from at least 30 sera for each kit. Seven kits gave significantly different results from the routine kit (p less than 0.05 - Wilcoxon matched pairs test - two tail value). Inter and Intra-assay coefficients of variation were under 12.5% in all cases within the range of interest. Four kits showed a pronounced non-linear correlation with the routine kit, and one of the IRMA kits exhibited a high-dose hook effect within the standard curve. The other three IRMA kits showed no such effect up to 2000 g · liter"
1(under assay conditions).
Vergleich von elf käuflichen Testbestecks zur Bestimmung von Ferritin im Serum
Zusammenfassung: Es wurden elf kommerzielle Testbestecke (sieben RIA- und vier IRMA-Methoden) für Serum- ferritin verglichen. Sieben Kits benutzten als Standardmaterial menschliches Leberferritin, zwei menschliches Milz- ferritin und zwei nicht-definierte menschliche Ferritinpräparate. Die Inkubationszeiten betrugen 30 Minuten bis 36 Stunden. Nur vier Kits erstellten Normal- bzw. Referenzbereiche mit ihren Reagenzien. In 10 Fällen waren die Korrelationen gut (r = 0,903—0,993) obwohl die Konzentrationen variierten (Steigung der Rcgressionslinie,
b = 0,437—1,94). Sieben Kits erbrachten signifikant unterschiedliche Ergebnisse gegenüber dem Routinekit (Wilcoxon matched pairs Test — p kleiner 0,05, two-tailed value). Vier Kits zeigten eine nicht-lineare Regression gegenüber dem Routinekit. Die Inter- und Intra-assay-Variationskoeffizienten betrugen weniger als 12,5% für alle Kits. Ein IRMA- Kit zeigte einen „high-dose hook effect" innerhalb der Standardkurve.
Introduction
The use of serum ferritin levels to reflect body iron stores has increased over the past few years, mainly due to the availability of commercial kits.
Due to the lack of international reference preparations for human ferritins, there is little or no standardisation of the materials used, so that results from different kits, although giving excellent correlations, are different numerically.
This article describes the comparison of eleven commer- cial radioassay kits for serum ferritin. The ferritin kit in routine use in the laboratory has been used as the
"reference kit" against which the others have been com- pared. The routine kit had been used in the author's laboratory over a two-year period in which over 150 assays were carried out and above 2500 sera measured.
Materials and Methods
Table 1 shows the kits tested, together with the producer, as well as the code letter allotted in this study.
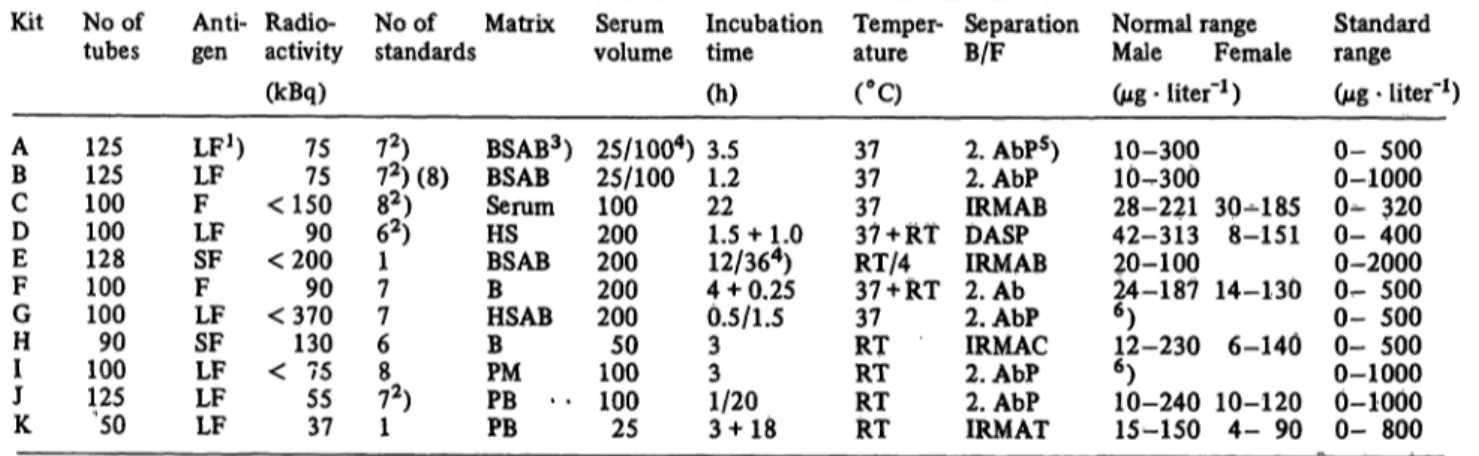
Table 2 shows the main components and assay details of the kits.
All kits were used according to the manufacturer's instructions and were compared in each case with Kit A.
Intra- and inter-assay coefficients of variation (CV) were obtained at two levels for each kit using the same precision control sera.
The patients donating blood were not prc-selcctcd, except for the determination of the reference range for Kit A.
The determination of the reference ranges for scrum fcrritin was carried out on selected healthy volunteers for Kit A. Before fcrritin values were included in the reference range, the following parameters were controlled:
Haemoglobin (Hb) 135-165 g - liter"1
HbK31-34pg
Scrum transfcrrin 2-4 g · liter"1 Serum iron 12-32 · liter"1
Blood smear normal.
0340-076X/81/0019-0947S02.00
©by Walter de Gruyter & Co. · Berlin · New York
Volunteers were screened for oral iron intake in the form of either iron tablets or multi-vitamin preparations containing iron, as well as for oral contraceptives. The above reference ranges were for a population living at an altitude of 500-700 meters above sea-level.
Tab. 1. Ferritin kits tested.
Kits A, B, D, F, G, I and J were radioimmunoassays, Kits C, E, H and K were immunoradiometric assays.
All kits used125! as label.
All kits were tested between February 1980 and Janu- ary 1981.
Code Kit Producer
A GammaDab 125I Ferritin RIA1)
B GammaDab 125I Ferritin RIA1)
C RIA-gnost Ferritin D Ferritin 125I RIA-RIANEN E FER-IRON Serum Ferritin RIA F Ferritin 125I RIA
G Ferritin 125I RIA H Phadebas Ferritin PRIST I 125I Ferritin RIA J Ferritin Kit K SPAC-Ferritin Kit
Clinical Assays- Travenol Laboratories Inc.
Clinical Assays^
Travenol Laboratories Inc.
Behringwerke AG New England Nuclear Ramco
Laboratories Inc.
Amersham Becton Dickinson Pharmacia
Diagnostic Products Corporation Serono-Biodata Daiichi Radioisotope Labs., Ltd. (Byk Mallinckrodt)
Results
The reference ranges for serum ferritin values are shown in table 3. The 131 persons here represented were selected from 339 volunteers (85 male and 254 female).
The assay characteristics for Kit A are shown in table 4.
Table 5 shows the standards from Kit A as measured in each of the kits tested. The kits requiring dilution of sera before measurement (Kits E and H) as well as the kit with only a single standard, (Kit K) were excluded from this study.
Table 6 shows the correlation data between results ob- tained with Kit A and the kit in question. The values from Kit A were entered as each time. Regression data was for the equation y == ä + bx. Included in table 6 are the mean values of all the sera measured together with the coefficient of variation to allow a comparison of the dispersion of values.
Tab. 3. Reference ranges for serum ferritin.
Males Females Number1)
MeanStandard deviation Range
Age range Median age
53117 58.231-285 19-61 42
7890.5 50.028-250 16-57 39
Mg · liter"1
Mg · liter"1
Mg - liter"1
years years
l) Kit A was replaced in October 1980 by Kit B. l) These figures were obtained from 339 healthy volunteers after screening (85 males and 254 females).
Tab. 2. Main components and assay details of the ferritin kits used.
Kit
AB CD EF GH IJ K
No of tubes
125125 100100 128100 10090 100125 '50
Anti- gen
LF1) LFF LFSF FLF SFLF LFLF
Radio- activity (kBq)
7575
<150
<20090
<37090
< 75130 5537
No of Matrix standards
7,2)
72) (8) 82) 62) 17 76 872) 1
BSAB3) BSABSerum HSBSAB BHSAB BPM PB - - PB
Serum Incubation volume time
(h) 25/1004) 3.5 25/100 1.2 100 22 200 1.5 + 1.0 200 12/364) 200 4 + 0.25 200 0.5/1.5 100 350 3 100 1/20
25 3 + 18
Temper-
ature Separation
B/F Normal range
Male Female (°C) (Mg- liter"1) 3737
3737 + RT RT/437 + RT 37 RTRT RTRT
2. AbPs) 2.AbP IRMAB DASPIRMAB 2. Ab 2.AbP IRMAC 2.AbP 2.AbP IRMAT
10-300 10^300 28-221 42-313 20-100 24-187
6) 12-230
6) 10-240 15-150
30-185 8-151 14-130
6-140 10-120 4- 90
Standard range (Mg · liter"1) 0- 500 0-1000 0- 320 0- 400 0-2000 0- 500 0- 500 0- 500 0-1000 0-1000 0- 800
*) LF = Liver Ferritin, SF = Spleen Ferritin, F = undefined Ferritin
2) In these kits, one or two control sera are included
3) BSAB = Bovine serum albumin buffer, HS = Horse serum, B = undefined buffer, HSAB = Human serum albumin buffer, PM = Protein matrix, PB = Phosphate buffer
*) The figures divided by / denote alternative assay conditions, those with + two incubation steps
) 2 AbP = Second antibody + polyethylene glycol, DASP = Double antibody solid phase, 2. Ab = second antibody,
IRMAB = Immunoradiometric assay with beads, IRMAC = as IRMAB but with paper discs, IRMAT = as IRMAB but with coated tubes as the solid phase. ^
6) No normal range given, but examples from other groups using different methods.
J. Clin. Chem. Clin. Biochem. / Vol. 19,1981 / No. 9
Tab. 4. Assay characteristics for Kit A.
a. Inter-assay coefficient of variation
S.D.Mean CVn
Scrum 1 8.841.58 4017.9
Serum 2 1047.11
406.82
/ig · liter"1
Mg - liter"1
%Assays b. Intra-assay coefficient of variation
MeanS.D.
nCV
Serum 3 14.51.52 2010.4
Serum 4 88.24.90 205.44
Serum 5 36026.1
207.25
Mg - liter"1
Mg · liter"1
%Samples c. Sensitivity (lowest detectable amount of antigen) — defined by the point on the standard curve 3 S. D. from the zero point.
MeanCV n
64.72.15 40
Mg · liter"1
%Assays d. 50% intercept ((B-UB)/B0-UB) = 0.5) Mean 72.3 Mg · liter"1 CV 12.3 % n 40 Assays d. Stability of the standard curve Standard Mean CV
binding1) (Mg-liter"1) (%) (%)
52 5020 200500
94.897.4 59.281.7 25.312.6
1.702.26 5.072.52 13.524.8
4040 4040 4040
*) Zero standard = 100% for each assay.
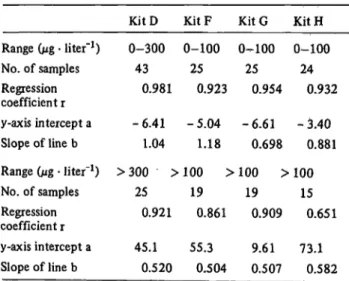
Table 7 shows correlation data at different points on the standard curve in cases where a pronounced non-linear regression was seen. The values were divided into two ranges, namely below 100 ì§ · liter"
1and above for kits F, G and H, and below and above 300 ì§ · liter"
1for KitD.
Table 8 shows inter and intra-assay CVs at two points on the standard curve. The same serum was used in all cases.
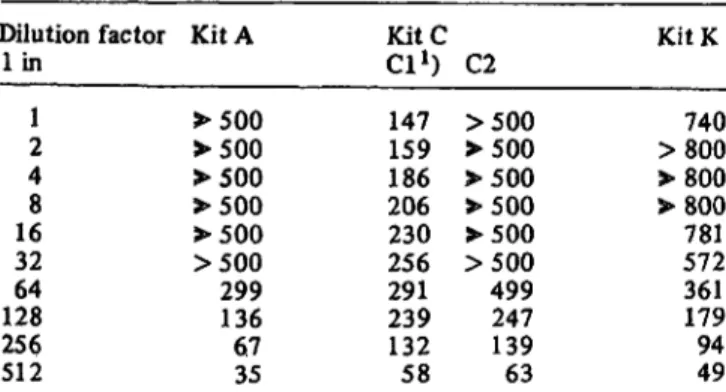
Table 9 shows the effect of diluting a patient serum with an estimated ferritin level of ca. 16000 jug - liter"
1in the four IRMA kits. The values in brackets are for a newer version of Kit C, and demonstrate that the original weak point of this kit, namely that a high-dose hook effect was apparent even within the "normal range" given, had been eliminated. Values are also shown for Kit A.
Discussion
The discovery of ferritin in the serum of patients with acute hepatocellular disease was made some 25 years ago (1), but it was not until 16 years later that Addison and co-workers were able to detect ferritin in the serum of normal and iron-deficient volunteers using an immuno- radiometric assay (IRMA) (2). Although ferritin is present in different organs and tissues, (3) its structure and physicochemical properties vary according to the tissue of origin. Ferritin in serum seems to resemble apoferritin rather than the iron-rich molecule (3), al- though its electrophoretic behaviour does not resemble any of the tissue ferritins (3,4).
Changes in serum ferritin levels have been described for many clinical situations and disorders including iron- deficient anaemia (2), iron-overload (2), leukaemia (5), Hodgkin's Disease (5), renal failure (6), under haemo- dialysis, (6), megaloblastic anaemia, (7), breast cancer, (8), 0-thalassaemia, (9), dysbaric osteonecrosis, (10) as well as regular blood donation (11). The claims often made that the serum ferritin levels always reflect the total iron stores in the body are much overstated, and one must review each situation most carefully as to whether the serum ferritin level can be evaluated per se.
It is to be recommended that the parameters listed in screening the reference groups above be determined as well.
Recent reviews (12-14) have summarised the diagnostic value of the serum ferritin level, and come to the con- clusion that only a low serum ferritin value is indicative that the body iron stores are near to depletion. Normal or high ferritin values may mask an iron-deficient state
Tab. 5. Standard from Kit A as measured in each of the kits tested.
Nominal value Kit B (Mg - litejf1)
25 2050 200500
26 4719 216487
KitC:
Cl1) 02) 318 270100 2323)
C2 00 3187
>500307
KitD 02 3816 371174
Kit E Kit F 25
4816 171329
104 6924 258485
*) Kit Cl was the original kit tested, Kit C2, the modified kit in which the high dose
2) Values of 0 represent levels below the assay detection limit (sensitivity as defined
3) Sample not diluted, high dose hook effect already present.
KitG 02 137 5135 hook effect in Table 4).
Kit H 46 1634
>500183 had been cured.
Kit I 58 4726 516210
KitJ 00 326 409138
J.CUn.Chem.Ciin.Biochem./Vol. 19,1981 /No. 9
Tab. 6. Correlation data between results obtained with Kit A and the kit in question.
No. of samples Correlation coefficient y-axis intercept Slope b Mean-Kit A Mean-Kit Test2) CV, Kit A CV, Kit Test P3)
Kit B 40
0.992 -5.36
0.941 164 149 124 129
<0.01 ClKitC1)
32 0.780 67.2
0.437 75.0 100 141 59 ns
C2 32
0.962 -2.78
1.94 156 294 86 90
<0.01 Kit D
70 0.959 10.2
0.724 269 205 105 104
<0.01 Kit E
40 0.970 11.1
0.711 99.0 81.5 111
98.6
<0.01 KitF
50 0.910 25.6
0.590 160 120 139 120
<0.02 KitG
55 0.903 5.96 0.493 174
92.0 137 142
<0.01 Kit H
65 0.943 -3.46
0.916 179 160 142 154
>0.02 Kit I 100
0.993 2.92 0.994 211 212 111 110
= 0.05 ' KitJ 100
0.969 -2.02
OJ25 195 139 98.0 103
<0.01 Kit K
52 0.926 34.5
0.822 142 152 118 99.2 ns
*) Kit Cl was the original kit, Kit C2 the replacement for Cl without the high dose hook effect.
2) This is the mean value of all sera measured in the kit under test.
3) Probability was obtained using the W coxon matched pair test with values for a two-tail test as the direction of difference was not stated prior to the test. Non-parametric statistics were used as the distribution of values was not normal in certain cases. Values greater than 0.05 were taken as not significant, (ns).
Mean values are in Mg · liter~* and CV in %.
Tab. 7. Correlation data at different points on the standard curve in cases of non-linear regression.
Range (ì§ · liter"1) No. of samples Regression coefficient r y-axis intercept a Slope of line b Range (ì% · liter"1) No. of samples Regression coefficient r y-axis intercept a Slope of line b
Kit D 0-300
43 0.981 -6.41
1.04
>300 >
25 0.921 45.1
0.520 KitF 0-100
25 0.923 -5.04
1.18 100 >
19 0.861 55.3
0.504 KitG 0^100
25 0.954 -6.61
0.698 100 >
19 0.909 9.61 0.507
Kit H 0-100
24 0.932 -3.40
0.881 100
15 0.651 73.1
0.582
due to an additional complication such as an infectious process involving liver or spleen, which gives rise to elevated serum ferritin levels.
From the results here presented, the main point to be seen was the excellent correlation between many of the kits, associated with widely differing numerical values.
Excluding Kit B, which was the successor to Kit A, only one other Kit gave identical values over the' entire range of the standard curve, (Kit I).
The suggested "normal range" given by several kits was taken from the literature, and were established using methods often very different from those used in the kit.
'From the differing slopes of the regression lines seen in this study, the reference range must be set up using the kit in question. This was the state of affairs existing for Kit C (defined by normal intestinal absorption of 59Fe),
for Kit D (defined by haemoglobin, haematocrit, red blood cell count and mean cell volume), for Kit F (measured on 211 healthy volunteers with "known body iron status", for Kit H (made on 268 volunteers, healthy adults free from infection, inflammation or known malignant tumours) and for Kit J (which included a warning that absolute values depended upon the kit or method used).
Kit C recommended that all sera expected to be above 200 jug - liter"1 be diluted 1:100 before assay, an im- practicable suggestion, as it is very often not known if serum values are likely to be above this value. In effect it means that each serum must be set up neat and diluted, a most expensive exercise! Kit C in its original form was the only one of the IRMA kits exhibiting a
"high-dose hook effect" (15) within the standard curve.
The modified version of Kit C, although giving identical results with its predecessor (taking into account the necessary dilution precautions), also produced a standard curve which, along with the other IRMA methods gave no such effect under 2000 ìg · liter^1.
Most kits gave results on the same day, only three offer- ing an overnight incubation step (C, E and K). Five Kits (A, B, C, D and J) included one or two control sera in the kit. Three other firms offered sets of control sera at additional prices (Kits, E, F and I). The lack of inter- national reference preparations is reflected in table 5, and although the presence of such "standard prepara- tions" with defined characteristics do not automatic- ally ensure that all results are the same, this, coupled with a standardisation of methodology (standard in human ferri t in-deficient serum, second antibody separa- tion, where applicable etc.) would bring,the results to- gether, thus allowing a better comparison. This has been
J. Clin. Chem, Ciin. Biochem. / Vol. 19,1981 / No. 9
Tab. 8. Precision data.
Intra-assay variation Pooll
Pool 2
Inter-assay variation Pooll
Pool 2
Kit B KitC Kit D Kit E KitF Kit G Kit H Kit! KitJ Kit K
Mean Oug · Ã1) CV(%) No, of samples
1910 20
.0.0 34.0 2013.5
13.024.8 20
17.05.20 20
29.25.42 20
17.96.43 20
16.85.68 20
18.49.41 20
35.16.51 20
10.88.82 20
Mean Oug - Ã1) CV(%) No. of samples
2136.61 20
19710.0 20
2137.42 20
1813.99 20
2893.84 20
41.24.49 20
2068.29 20
2227.52 20
1426.00 20
2176.62 20
Mean fog - Ã1) CV(%) No. of assays
18.210.2 10
30.115.2 5
18.625.2 10
15.97.11 6
28.46.65 6
27.15.52 5
15.07.52 8
17.910.3 15
27.08.39 6
10.010.2 5
Mean 0*g - Ã1) CV (%) No. of assays
2139.
1061 189 12.35
20210.1 10
1836.90 6
2775.52 6
43.16.89 5
1985.52 8
2178.89 15
1476.74 6
2048.40 5
Tab. 9. Effect of diluting Ferritin values in Mg · liter"1 as read from the Kit standard curve.
Dilution factor lin
21 48 3216 12864 256512
Kit A
>500
>SOO
>500
>500
>500
>500 299136 6735
KitCCl1) 147159 206186 230256 291239 13258
C2
>500
>500
>500
>500
>500
>500 499247 13963
Kit K
>800740
>800
>800 781572 361179 9449 In all cases, the dilution was carried out using the zero standard supplied in the Kit.
*) Kit Cl was the original kit and Kit C2 the replacement kit
seen in the case of certain proteohormones (16) and haptens (17).
The inter and intra-assay CVs were acceptable for all kits in the range of interest. Several kits did not give a linear correlation as is seen in table 7, a point which must be borne in mind when comparing two kits.
The definition "normal r nge" must be replaced by the term "reference range" for serum ferritin assays, in.view of the often lower values found in women of child-bearing
age, many of which have at least one haematological parameter lying outside reference range for men, and women no longer subject to blood loss via the monthly period. As an example, it is questionable as to whether a
"normal, healthy" 25 year old woman with a haemo- globin of 120 g · liter"
1can be classed as normal, inspite
of the fact that many such women are to be found in the
"normal" population of "healthy" individuals. In view of such facts, the criteria used to determine the "refer- ence range" for Kit A were the same for males and fe- males. This probably explains that the sex-dependant differences usually found were not apparent, a point however which is reflected that in all age groups out- side the child-bearing years, there is no difference in serum ferritin levels between men and women who are free from disease.
This study has once again demonstrated that a labora- tory internal reference range be set up as values from studies using different methods, or from different populations cannot be compared or transferred to each laboratory. A recent publication comparing fewer kits has also come to similar conclusions (18).
Acknowledgements
The author would like to thank Fr ulein Christine W chter for technical assistance and Professor P. C Scriba for critical appraisal of the text.
J. Clin. Chem. Clin. Biochem. / Vol. 19,1981 / No. 9
References
1. Reissmann, K. R. & Dietrich, M. R. (1956) J. Clin. Invest. 35, 588-595.
2. Addison, G. M., Beamish, M. R., Hales, C. M., Hodgkins, M., Jacobs, A. & Llewellyn, P. (1972) J. Clin. Pathol. 25, 307- 3. Worwood, M., Aherne, W., Dawkins, S. & Jacobs, A. (1973)316.
Clin. Sei. Mol. Med. 48, 441-451.
4. Puro, D. G. & Richter, G. W. (1971) Proc. Soc. Exp. Biol.
Med. 138, 399-403.
5. Jones, P. A. E., Miller, F. M., Worwood, M. & Jacobs, A.
(1973) Brit. J. Cancer 27, 212-217.
6. Hussein, S., Prieto, J., O'Shea, M., Hoffbrand, A. V., Baillod, R. A. & Moorhead, J. F. (1975) Brit. Med. J. l, 546-548.
7. Hussein, S., Laulicht, M. & Hoffbrand, A. V. (1978) Scand. J.
Haematol. 20, 241-245.
8. Jacobs, A., Jones, B., Ricketts, C., Bulbrook, R. D. & Wang, D. Y. (1976) Brit. J. Cancer 34, 286-290.
9. Letsky, E. A., Miller, F., Worwood, M. & Flynn, D. M. (1974) J. Clin. Pathol. 27, 652-655.
10. Gregg, P. J., Eastham, E. J., Bell, J. I. & Walder, D. N. (1977) Undersea Biomed. Res. 4, 75-79.
11. Finch, C. A., Copk, J. D., Labbe, R. F. & Culola, M. (1977) Blood 50, 441-447.
12. Heinrich, H. C. (1980) Med. Welt 30, 89-97.
13. Kaltwasser, J. P. & Werner, E. (1978) Therapiewoche 28, 7301-7314.
14. Kaltwasser, J. P. (1980) Dtsch. Med. Wochenschr. 105, 319-321.
15. Sokolowski, G. & Wood, W. G. (1981) Radioimmunoassay in Theorie und Praxis - Ein Laborbuch für Anfänger und Fort- geschrittene, Publishers Schnetztor Verlag Konstanz, p. 49- 16. Marschner, L, Erhardt, F. W. & Scriba, P. C. (1976) J. Clin.50.
Chem. Clin. Biochem. 14, 345-351.
17. Wood, W. G., Bauer, M., Hörn, K., Märschner, L, van Thiel, Dagmar, Wächter, Christine & Scriba, P. C. (1980) J. Clin.
Chem. Clin. Biochem. 18, 511-519.
18. Moreth, M. (1980) Ärztl. Lab. 26,12-17.
Dr. W. G. Wood
Klinik für Innere Medizin Med. Hochschule Lübeck Ratzeburger Allee 160 D-2400 Lübeck l
J. Clin. Chem. Clin. Biochem. / Vol. 19,1981 / No. 9