This article has been accepted for publication and undergone full peer review but has not been through the copyediting, typesetting, pagination and proofreading process which may lead to differences between this version and the Version of Record. Please cite this article as doi: 10.1002/2017GL074835
Expanding Greenland Ice Sheet Enhances Sensitivity of Plio-Pleistocene Climate to Obliquity Forcing in the Kiel Climate Model
Zhaoyang Song1, Mojib Latif1,2, Wonsun Park1
1 GEOMAR Helmholtz Centre for Ocean Research Kiel, Kiel, Germany
2 Excellence Cluster “The Future Ocean” at Kiel University, Kiel, Germany
Corresponding author: Zhaoyang Song (zsong@geomar.de) Key Points:
Orographic effects of an expanding Greenland ice sheet (GrIS) enhance the climate response to obliquity forcing during the Plio-Pleistocene transition.
Expanded GrIS weakens the Atlantic Meridional Overturning Circulation
(AMOC) by reducing oceanic heat loss of the Greenland-Iceland-Norwegian Sea.
Expansion of GrIS enhances the obliquity-related variability of the freshwater export from the tropical Atlantic and of the AMOC.
Abstract
Proxy data suggest the onset of Northern Hemisphere glaciation during the Plio-Pleistocene transition from 3.2 to 2.5 Ma resulted in enhanced climate variability at the obliquity (41 kyr) frequency. Here, we investigate the influence of the expanding Greenland ice sheet (GrIS) on the mean climate and obliquity-related variability in a series of climate model simulations.
These suggest that an expanding GrIS weakens the Atlantic Meridional Overturning Circulation (AMOC) by ~1 Sv, mainly due to reduced heat loss in the Greenland-Iceland-Norwegian Sea. Moreover, the growing GrIS amplifies the Hadley circulation response to obliquity forcing driving variations in freshwater export from the tropical Atlantic and in turn variations of the AMOC. The stronger AMOC response to obliquity forcing, by about a factor of two, results in a stronger global-mean near-surface temperature response. We conclude that the AMOC response to obliquity forcing is important to understand the enhanced climate variability at the obliquity frequency during the Plio-Pleistocene transition.
1. Introduction
The transition from the Pliocene to Pleistocene around 3.2 to 2.5 Million years before present (Ma BP) was characterized by the onset of Northern Hemisphere glaciation (NHG) and an increase of climate variability at the obliquity frequency (41 kyrs) [e.g., Lisiecki and Raymo, 2005; Lisiecki and Raymo, 2007; Rohling et al., 2014; Martinez-Boti et al., 2015]. Marine sedimentary records of ice rafted debris [e.g., Bailey et al., 2013] and temperature proxies records from around the globe indicate a global cooling trend [e.g., Herbert et al., 2010;
Lawrence et al., 2009; Lawrence et al., 2010; Naafs et al., 2010] which was particularly pronounced between 3.0 and 2.5 Ma BP [Mudelsee and Raymo, 2005; Fig. S1a,c]. The cooling trend was accompanied by increased variability in North Atlantic sea surface temperature (SST) and global mean benthic foraminiferal 𝛿18O; a proxy for ice volume and deep-sea temperature [Lisiecki and Raymo, 2005, the LR04 stack], in the 41 kyr band (Fig.
S1b,d analyzed with ARAND [Howell, 2001]). Lawrence et al. [2009] found that North Atlantic SST began to lead 𝛿18O significantly, coincident with the strong cooling trend at Ocean Drilling Program (ODP) site 982. The progressively stronger level of variability in the
obliquity band in a number of proxies suggests a link between the growth and persistence of the Greenland ice sheet (GrIS) and the strengthening climate response to obliquity forcing.
The Atlantic Meridional Overturning Circulation (AMOC) transports large amounts of salt and heat poleward and also exerts a strong control on the stratification and distribution of water masses in the deep ocean [Kuhlbrodt et al., 2007]. Thus, the AMOC has a profound influence on the Earth’s climate and its variability. The tilt of Earth’s rotational axis, known as obliquity, controls the distribution of top-of-atmosphere (TOA) incoming solar radiation with respect to its seasonal and meridional contrast, but not global-mean insolation. Low obliquity weakens the seasonal insolation contrast between the summer and winter hemispheres and strengthens the meridional insolation gradient within the summer hemisphere [Fig. S2 a, b calculated after Bretagnon and Francou, 1988; Mantsis et al., 2014].
Hence, inter-hemispheric insolation at low obliquity is associated with weak cross-equatorial Hadley circulation and reduced heat transport from the summer hemisphere to the winter hemisphere, and vice versa [Mantsis et al., 2014]. Obliquity can affect the AMOC by freshwater forcing and early studies suggested that changes in the AMOC were likely driven by changes in ice volume. For instance, Imbrie et al. [1992] found that North Atlantic benthic 𝛿13C records, reflecting deep water mass changes, slightly lagged ice volume at the obliquity frequency. Comparison with SST proxy records from the North and tropical Atlantic revealed the link between the benthic 𝛿13C and northward heat transport and hence, overturning rate [Lisiecki et al., 2008].
The GrIS is the largest body of ice and freshwater reservoir in the Northern Hemisphere is equivalent to 7 m global sea level rise [Gregory et al., 2004]. Its average elevation is 1829 m above sea level with a maximum height of 3278 m (calculated with the dataset of [Bamber et al., 2001]). Freshwater input from GrIS melting can substantially weaken the AMOC in anthropogenic climate change simulations (e.g. Mikolajewicz et al. [2007]). The topographic relief, of the GrIS and high surface albedo generates a cold high pressure center influencing the downstream Northern Hemisphere mid-latitude westerly flow and northeasterly trade winds, thus affecting the North Atlantic Oscillation (NAO), storm activity in the North Atlantic, and Intertropical Convergence Zone (ITCZ) [Dethloff et al., 2004; Chiang and Bitz,
2005; Davini et al., 2015].
Here, we investigate the climatic impact of the expanding GrIS during the Plio-Pleistocene transition. This includes, among others, the mean response of the AMOC and its sensitivity to obliquity forcing. We show how the expanding GrIS may affect the global climate variability through the AMOC and associated atmospheric circulation changes.
The paper is organized as follows: section 2 describes the climate model, the experimental setup and methods for heat and moisture transport calculation. The influence of the buildup of the GrIS on the AMOC and its obliquity-forced variability are addressed in section 3. A summary and discussion of the main results are given in section 4.
2. Model and Experimental Design
The Kiel Climate Model (KCM; Park et al. [2009]), a fully coupled atmosphere-ocean-sea ice general circulation model (AOGCM), is used to perform long-term (at least 1,900 model years) climate simulations. The atmosphere model is ECHAM5 [Roeckner et al., 2003] which is integrated with T31 (3.75ºx 3.75º) horizontal resolution and 19 vertical levels up to 10 hPa.
The ocean-sea ice component is NEMO [Madec, 2008] on a 2º Mercator mesh, with 31 vertical levels. The meridional resolution increases towards lower latitudes, with 0.5º in the equatorial region. The two components are coupled with the OASIS3 coupler [Valcke, 2006].
No form of flux correction or anomaly coupling is employed.
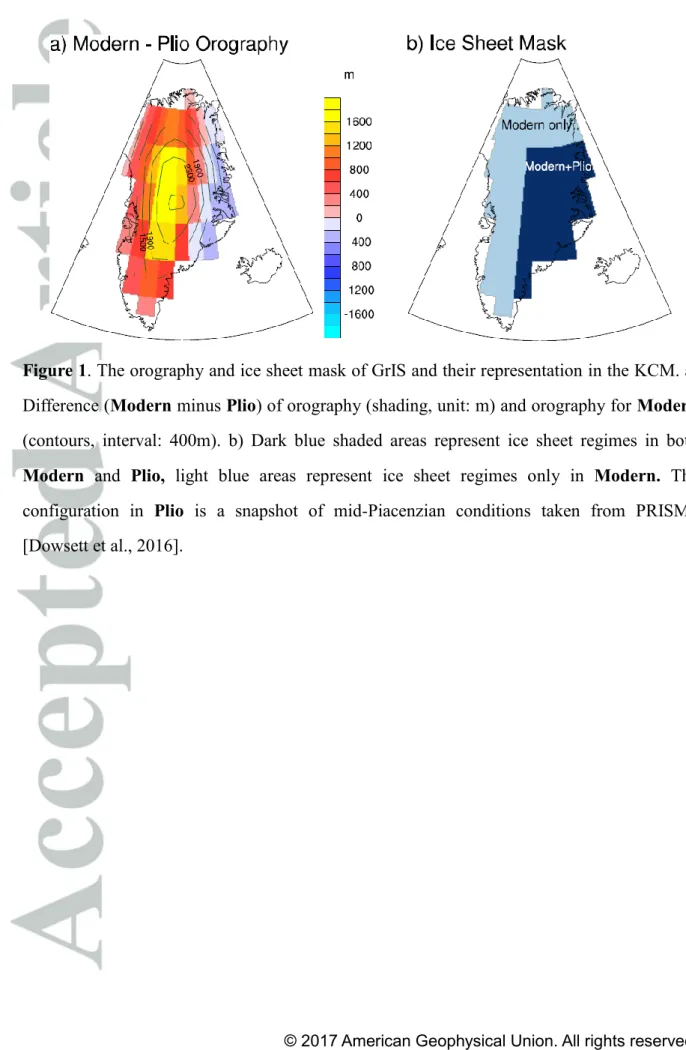
We perform a series of simulations (Table 1). A control integration of the KCM, hereafter named Modern, is 2,700 years long and initialized with the Levitus climatology of temperature and salinity. The control integration employs the modern GrIS. In the mid-Piacenzian (3,264 to 3,025 Ma BP) run, hereafter named Plio, only the configuration of GrIS is implemented. A snapshot of the mean topography and ice sheet mask of the GrIS is taken from the latest Pliocene Research, Interpretation and Synoptic Mapping (PRISM4) reconstruction dataset [Dowsett et al., 2016, and references therein]. The mean GrIS elevation in Plio is 850 m, which is 781 m lower than that in Modern (1,631 m, Fig. 1a). The area of the GrIS in Plio shrinks to 50 % of that in Modern (Fig. 1b). Soils, lakes, vegetation and topography outside of Greenland ice sheet regimes in Plio are all set to modern. Different from the Ei400 simulation in PlioMIP Phase 2 [Haywood et al., 2016], which investigates both
the impact of Greenland and Antarctic ice sheets, Plio is to assess the orographic impact of GrIS on the mean state.
Four sensitivity experiments with differing obliquity are carried out to investigate the impact of the GrIS on climate variability. The first two experiments adopt the modern GrIS boundary conditions with idealized low (22.34º, ModernLow) and high (24.05º, ModernHigh) obliquity extremes as present during the Pliocene-Pleistocene transition based on calculations by Laskar et al. [2004] (Fig. S3). The other two experiments are identical but employ the Plio GrIS boundary conditions and idealized low (22.34º, PlioLow) and high obliquity (24.05º, PlioHigh). The modern value for longitude of perihelion (282.7º) and eccentricity (0.0167) is computed after Berger and Loutre [1991]. The CO2 concentration in Plio simulations is fixed at 405 ppm following the Pliocene Model Intercomparison Project (PlioMIP) protocol [Haywood et al., 2011]. Apart from Modern, all runs are integrated for 1,900 years, with the monthly-mean output of the last 600 years taken for analysis. Initialization is as follows;
ModernHigh, ModernLow and Plio start from conditions at year 1,000 of Modern. PlioHigh
and PlioLow start from year 500 of Plio.
3. Results 3.1 Mean state
We first investigate the impact of GrIS expansion on the mean state by discussing long-term annual-mean and winter-mean (DJF) changes of selected variables. By and large the response is in agreement with previous model results [Davini et al., 2015]. The elevated Modern GrIS cools (Modern vs. Plio) the annual-mean T2m (2m-air-temperature) by almost 6 K averaged over Greenland (Fig. 2a contours). DJF and JJA average temperature over Greenland decreases by 6.3 K and 4.9 K, respectively (not shown). With the KCM assuming a lapse rate of 6.5 K/1,000 m due to elevated topography for a standard atmosphere, the elevation-induced near-surface cooling is 5 K, while the imposed change in albedo would only account for 0.9 K as a residual. The interhemispheric temperature gradient, defined as the difference of averaged T2m between the Northern (0º - 90ºN) and Southern Hemisphere (0º - 90ºS), declines from 1.05 K in Plio to 0.77 K in Modern. This value is smaller than that calculated from observations and the CMIP3 multi-model mean of 1.24 K and 1.13 K,
respectively [Kang et al. 2015]. On the other hand, the intrahemispheric temperature gradient in the KCM, defined as the difference of averaged T2m between the tropics (5ºS - 5ºN) and northern high latitudes (60ºN - 90ºN), increases from 7.9 K in Plio to 8.2 K in Modern. The change in interhemispheric and intrahemispheric temperature gradient does not only arise from cooling over Greenland but also from a weak cooling over the North Atlantic (Fig. 2a).
The expansion of the GrIS leads to surface cooling of the North Atlantic which amounts to 0.15 K averaged over 40ºN - 60ºN (Fig. 2a shading). The western part of the GIN (Greenland-Iceland-Norwegian) Sea cools, but the eastern part and the Barents Sea warms.
The simulated Barents Sea inflow, defined as the gradient of the barotropic streamfunction between Svalbard and the northern tip of Norway, increases by 2.2 Sv (1 Sv = 106 m3/s) from Plio to Modern (Fig. S4). This presumably is related to weakened easterly winds (Fig. 2d) and the subsequent retreat of sea ice (Fig. S5), especially in DJF. Surface warming is largest in the Barents Sea through the positive ocean-sea ice-atmosphere feedback in this region [Semenov et al., 2009]. Surface temperature responses in the tropics and subtropics are small but statistically significant at the 99 % confidence level according to a Student’s t-test (Fig.
2a hatching), indicating Atlantic-wide influences.
The expansion of the GrIS reduces the annual-mean precipitation over Greenland (Fig.
2b), mainly by reduced specific humidity caused by the higher elevation and weaker atmospheric upward motion (not shown). The expanding GrIS induces a seasonal southward shift of the Intertropical Convergence Zone (ITCZ, Fig. S6 calculated after Hu et al., 2007) over the tropical Atlantic (Fig. 2b), due to the asymmetric SST response with cold SST anomalies north and warm SST anomalies south of the mean position of the ITCZ (Fig. 2a).
The positive wind-evaporation-SST feedback has been suggested to enhance the ITCZ response [Chiang and Bitz, 2005], but in the KCM there is no significant change in the tropical Atlantic surface heat flux (Fig. 2d).
In the KCM, the AMOC strength is mainly determined by deep convection at two sites:
one is south of Greenland (48ºN - 60ºN, 24ºW - 45ºW; the lower green box in Fig. 2e) and the other in the GIN Sea (66ºN - 78ºN, 6ºW - 12ºE; the upper green box in Fig. 2e). The DJF-mean near-surface winds transport cold air from North America and the Arctic to the
Irminger Sea and the GIN Sea where the ocean loses heat to the atmosphere in boreal winter (DJF, Fig. 2c shows the fields for Modern). The elevated GrIS in Modern drives a cold and high pressure center over Greenland, which weakens the near-surface winds over the two deep convection sites. The oceanic heat loss to the atmosphere is reduced by 11.4 W/m2 (7 %) and 35.5 W/m2 (21.4 %) over the convection sites south of Greenland and in the GIN Sea, respectively (Fig. 2d). The DJF-mean mixed layer depth displays a dipolar response pattern shoaling on average by 86 m south of Greenland but by only 6 m in the GIN Sea (Fig. 2e, more details can be seen in Fig. S7e). Consistently, the AMOC weakens in the annual mean (Fig. 2f). The AMOC index, defined as the maximum overturning stream function at 30ºN, reduces from a multi-century mean of 14.1 Sv in Plio to 13.2 Sv in Modern (the standard deviation of interannual variability remains unchanged at 0.7 Sv; Fig. S8). Sea ice expanded in Modern due to the slightly weaker AMOC, which suggests expansion of sea ice coincident with the NHG [Knies et al., 2014].
3.2 Response to obliquity forcing
The beginning of the “41-ka world”, revealed by reconstructed SST and 𝛿18O (Fig. S1), occurred around 2.7 Ma BP along with the onset of NHG including the expansion of the GrIS (Fig. S1b,d; also see Fig.1 in Ravelo et al., 2004). Obliquity variability does not impact the annual-mean global insolation but affects the seasonal and meridional distribution of shortwave radiation at the top of the atmosphere (TOA). When the obliquity changes from high to low, insolation increases throughout the year at lower latitudes and generally increases (decreases) in winter (summer) at high latitudes [Mantsis et al., 2011]. However, the increased insolation in winter does not compensate for the reduced insolation in summer. The annual-mean insolation increase near the equator is about 2 W/m2 and the annual-mean insolation decrease near the poles is about 12 W/m2 (Fig. S9). Obliquity-forced insolation changes directly influence surface temperature and its meridional gradient, and subsequently the zonally averaged atmospheric circulation. Here, we define the response of a selected variable to obliquity forcing as the difference between the annual-mean of that variable at low and high obliquity conditions. The zonal-mean surface temperature response is in good agreement with that in Mantsis et al. [2011] (Fig. S10a,b). The expanded GrIS in Modern
slightly enhances the T2m response by about 0.03 K in the Northern Hemisphere mid-latitudes (not shown). However, due to the cold high pressure center in the North Atlantic sector, the background intrahemispheric meridional temperature gradient intensifies by 0.3 K while the interhemispheric temperature gradient weakens by 0.28 K. The impact of the expanded GrIS on the thermal gradient is comparable to that of lower obliquity, which intensifies the near-surface zonal wind and zonal-mean atmospheric circulation response. Consistent with Mantsis et al. [2014], the simulated atmospheric response to decreased obliquity is an increase in the Northern Hemisphere mid-latitude westerlies and tropical easterlies, which is linked to enhanced meridional insolation and pressure gradients (not shown).
The atmospheric meridional overturning streamfunction response to obliquity forcing (low minus high) depicts both an enhanced Hadley Cell and Ferrel Cell (Fig. S10c,d). The ascending and descending branches of the Hadley circulation are associated with the ITCZ and subtropical dry regions, respectively (Fig. S10c,d contours). The expansion of the GrIS in Modern amplifies the Hadley circulation response in both its ascending and descending branches south of the equator (Fig. S10c,d shading). The intensified response of the descending branch is statistically significant at 99% level (Fig. S10c,d hatching). As shown in Fig. 3a,b, the response of the freshwater balance, defined as precipitation minus evaporation plus river runoff (P-E+R), is much stronger south of the equator in Modern relative to Plio, which is consistent with the Hadley circulation response (Fig. S10c,d). The net freshwater flux response integrated from 20ºS to 20ºN over the Atlantic amounts to -2.1 Sv and -1.4 Sv in Modern and Plio, respectively. We note that P-E+R is dependent on the selection of the domain. We tested different domains, as a result of the expanded GrIS, and the response is always stronger in Modern, ranging from 0.1 Sv to 0.7 Sv.
Several model studies addressed the impact of freshwater export anomalies in the tropical Atlantic on the AMOC [e.g. Latif et al., 2000; Vellinga and Wu, 2004]. All these studies suggest that the corresponding salinity anomalies propagate northward into the deep convection sites where they can influence the formation of North Atlantic deep water (NADW) and thus the AMOC. Some studies [e.g. Peterson et al., 2000; Latif, 2001;
Schmittner et al., 2000] highlight the potential importance of atmospheric water vapor
transport over the American continent for AMOC stability and climate variability. We calculate the Atlantic moisture export from our simulations by vertically integrating (from the surface to 200 hPa) the product of the zonal wind and specific humidity (Q = ∫ 𝑢̅𝑞̅𝑑𝑝
𝑔 𝑆𝑢𝑟𝑓
200 ℎ𝑃𝑎 , after Lohmann [2003] and Lélé [2015]). Its response to obliquity forcing integrated from 20º S to 20ºN (Fig. 3c,d) amounts to 0.1 and 0.07 Sv for Modern and Plio, respectively. The increased freshwater export due to the expanded GrIS in Modern eventually enhances the obliquity-forced response of AMOC by about a factor of two (1.1 Sv for Modern as opposed to 0.6 Sv for Plio, Fig. 3e,f). We do not expect a perfect response-magnitude match of the tropical Atlantic freshwater export and AMOC strength due to the differences in contributions from sea ice and surface heat flux as well as the selection of the integration domain.
Heat transport changes associated with the AMOC modulate the Northern Hemisphere T2m response to obliquity forcing. For example, 7 out of 12 models participating in the Coupled Model Intercomparison Project phase 5 (CMIP5; Taylor et al. [2012]) produce a significant positive linear regression between AMOC strength and T2m (Fig. S11), and only two models exhibit a significant negative regression. The enhanced AMOC response intensifies the North Atlantic (0º-60ºN, 80º-20ºW) T2m response (defined as the difference between the multi-centennial (600 years) annual-mean of T2m at low and high obliquity conditions) from 0.24 K in Plio to 0.36 K in Modern, the Northern Hemisphere T2m response from 0.31 K in Plio to 0.40 K in Modern, and the global-mean T2m response from 0.16 K in Plio to 0.28 K in Modern.
4. Summary and Discussion
We have investigated by means of a set of experiments with the KCM the impact of GrIS expansion on the mean surface climate and AMOC. Specifically, the influence of the GrIS on the climate response to obliquity forcing (41 kyr) has been investigated to understand the strengthening obliquity signal during the Plio-Pleistocene transition. We find that the expanded GrIS weakens near-surface westerly winds south of Greenland and near-surface easterly winds over the GIN Sea, which damps deep oceanic convection in these regions by reducing heat loss to the atmosphere. Accordingly, AMOC strength weakens by about 1 Sv and induces cooling of 0.15 K in the North Atlantic averaged over the region 40ºN-60ºN.
Sea-ice fraction increases following the cooling, which further reduces the air-sea heat exchange. Therefore, the expanding GrIS affects the AMOC through a positive ocean-atmosphere-sea ice feedback. Our result is consistent with the results from PlioMIP [Zhang et al., 2013], which show small changes in the AMOC between mid-Piacenzian and modern times. The orographic impact of the GrIS on the AMOC is within the range of the internal variability (2σ) but is statistically significant. The SST cooling following the buildup of the GrIS is rather weak compared to the SST change estimated from North Atlantic sites ODP 982 (Fig. S1a) and DSDP 607 of about 3 K [Lawrence et al., 2010]. This suggests the importance of additional drivers during the Plio-Pleistocene transition such as the closure and opening of Bering and Canadian Archipelago Straits, and the emergence of the modern West and East Antarctic Ice sheet [Brierley and Fedorov, 2016; Otto-Bliesner et al., 2017; Hill et al., 2017]. The opening of both Bering and the Canadian Archipelago Strais is linked to a 1.3 K SST cooling in the North Atlantic [Otto-Bliesner et al., 2017], while the glaciation over West and East Antarctic supports a deep ocean cooling of 2.0 K reconstructed at site DSDP 607 [Hill et al., 2017]. The model-data discrepancy in this study would likely be smaller if these changes in land surface and land sea distribution were included in the simulations.
We also investigated the role that the expanded GrIS could have played in enhancing the climate response to obliquity forcing (41 kyr). In general, when the obliquity moves from high to low, the Northern Hemisphere intrahemispheric meridional insolation gradient strengthens while the interhemispheric meridional insolation gradient weakens [Mantsis et al., 2014]. An expanding GrIS leads to similar influences in the KCM because of the influence of elevation and albedo: the intrahemispheric temperature gradient strengthens by 0.3 K and the interhemispheric temperature gradient weakens by 0.28 K. The response of the zonal-mean atmospheric circulation to obliquity forcing intensifies with the expanded GrIS. In turn, the obliquity-forced variation of the AMOC strengthens by about a factor of two, due to enhanced net freshwater export from the tropical Atlantic, especially south of the equator, subsequently leading to enhanced surface air temperature variability.
The key mechanism driving the enhanced climate variability in our simulations can be summarized as Northern Hemisphere extratropical cooling initiated by the expanding GrIS,
which drives stronger responses of freshwater flux to obliquity forcing in the Atlantic ITCZ region [Chiang and Bitz, 2005; Broccoli et al., 2006]. The involvement of the ITCZ and tropical freshwater flux can be a crucial element, as previously found in the KCM in response to idealized solar forcing [Park and Latif, 2012]. Our results support the connection between NHG and enhanced climate variability at the obliquity frequency, providing support to the notion that the sensitivity of Earth’s climate to change in radiative forcing depends on the background climate [Caballero and Huber, 2013]. However, the simulated response of surface temperature to obliquity forcing is much weaker compared to that inferred from proxy data. We note that the climate sensitivity depends on both slow “Earth system” feedbacks, which are related to the boundary conditions, and fast feedbacks, which are related to internal processes linked to, e.g., water vapor content or sea ice. Our simulations only consider the orographic impact of the GrIS, one of the slow climate feedbacks. However, the simulations lack a carbon cycle feedback that likely leads to the underestimation of the climate response, as suggested by Martinez-Boti et al. [2015]. Further, the climate sensitivity is also strongly influenced by the positive ice-albedo feedback. As the ice sheet mask is fixed in the KCM, the ice-albedo feedback is not included either. The uncertainty of the GrIS configuration during the mid-Piacenzian [Dolan et al., 2015] also constrains our results. The influence of the ice sheets over North America and Europe [Bintanja and van de Wal, 2008] are not accounted for in our experiments with the KCM. Additionally, the opening of Arctic oceanic gateways and ice sheets over West and East Antarctic are not considered and may further weaken the interhemispheric temperature gradient [Brierley and Fedorov, 2016; Otto-Bliesner et al., 2017;
Hill et al., 2017]. Knies et al. [2014] suggested the gradual emergence of modern Arctic sea ice, which may also provide a freshwater forcing on the AMOC. We do not claim that our findings fully explain the increased climate variability at the obliquity frequency during the Plio-Pleistocene transition, but suggest that the topographic changes of the Greenland ice sheet were a contributor Our results suggest that slow feedbacks related to changing boundary conditions may also be important in amplifying obliquity frequency climate variability.
Acknowledgements
The suggestions of the two anonymous referees greatly improved an earlier version of the
manuscript. This study was supported by the Integrated School of Ocean Sciences (ISOS) at the Excellence Cluster “The Future Ocean” at Kiel University sponsored by the German Science Foundation (DFG) and the PalMod project (01LP1503D) sponsored by the German Ministry of Education and Research (BMBF). We thank Edmund Hathorne for his helpful comments, Gerrit Lohmann and Xu Zhang for their assistance with the subgrid-scale orography parameterization for Greenland in the PRISM4 dataset. The simulations with the Kiel Climate Model (KCM) were conducted at the Computing Center of Kiel University. The KCM results presented in this study are available at Pangaea (https://doi.pangaea.de/10.1594/PANGAEA.877918). Requests for other data should be directed to wpark@geomar.de. Zhaoyang Song is a Ph.D. student, sponsored by the Chinese Scholarship Council (CSC).
References
Bailey, I., G. M. Hole, G. L. Foster, P. A. Wilson, C. D. Storey, C. N. Trueman and M. E.
Raymo (2013), An alternative suggestion for the Pliocene onset of major northern hemisphere glaciation based on the geochemical provenance of North Atlantic Ocean ice-rafted debris, Quat. Sci. Rev., 75, 181-194, doi:
http://dx.doi.org/10.1016/j.quascirev.2013.06.004.
Bamber, J. L., R. L. Layberry and S. P. Gogineni (2001), A new ice thickness and bed data set for the Greenland ice sheet: 1. Measurement, data reduction, and errors,J. Geophys. Res.
Atmos., 106(D24), 33773-33780, doi: 10.1029/2001JD900054.
Berger, A., and M. F. Loutre (1991), Insolation values for the climate of the last 10 million years, Quat. Sci. Rev., 10(4), 297-317, doi: 10.1016/0277-3791(91)90033-Q.
Bintanja, R., and R. S. W. Van de Wal (2008), North American ice-sheet dynamics and the onset of 100,000-year glacial cycles, Nature, 454(7206), 869-872, doi:10.1038/nature07158.
Bretagnon, P., and G. Francou (1988). Planetary theories in rectangular and spherical variables-VSOP 87 solutions. Astronomy and Astrophysics, 202, 309-315.
Brierley, C. M. and A. V. Fedorov (2016), Comparing the impacts of Miocene-Pliocene changes in inter-ocean gateways on climate: Central American Seaway, Bering Strait,
and Indonesia, Earth Planet. Sci. Lett., 444, 116-130, doi:
https://doi.org/10.1016/j.epsl.2016.03.010.
Broccoli, A. J., K. A. Dahl and R. J. Stouffer (2006), Response of the ITCZ to Northern Hemisphere cooling. Geophys. Res. Lett., 33(1), doi: 10.1029/2005GL024546.
Caballero, R., and M. Huber (2013), State-dependent climate sensitivity in past warm climates and its implication for future climate projections, Proc. Natl. Acad. Sci., 110, 14162–14167, doi: 10.1073/pnas.1303365110.
Chiang, J.C.H., and C.M. Bitz (2005), Influence of high latitude ice cover on the marine Intertropical Convergence Zone, Clim. Dyn., 25, 477-496, doi:10.1007/s00382-005-0040-5.
Cullather, R. I., D. H. Bromwich and M. C. Serreze (2000), The Atmospheric Hydrologic Cycle over the Arctic Basin from Reanalyses. Part I: Comparison with Observations and Previous Studies, J. Clim., 13(5), 923-937..
Davini, P., J. vonHardenberg, L. Filippi and A. Provenzale (2015), Impact of Greenland orography on the Atlantic Meridional Overturning Circulation, Geophys. Res. Lett., 42, 871–879, doi: 10.1002/2014GL062668.
Dethloff, K., W. Dorn, A. Rinke, K. Fraedrich, M. Junge, E. Roeckner, V. Gayler, U. Cubasch, and J. H. Christensen (2004), The impact of Greenland's deglaciation on the Arctic circulation, Geophys. Res. Lett., 31, L19201, doi: 10.1029/2004GL020714.
Dolan, A. M., S. J. Hunter, D. J. Hill, A. M. Haywood, S. J. Koenig, B. L. Otto-Bliesner, ...
and C. Contoux (2015), Using results from the PlioMIP ensemble to investigate the Greenland Ice Sheet during the mid-Pliocene Warm Period, Clim. Past, 11(3), 403-424, doi: 10.5194/cp-11-403-2015.
Dowsett, H., A. Dolan, D. Rowley, R. Moucha, A. M. Forte, J. X. Mitrovica, M. Pound, U.
Salzmann, M. Robinson, M. Chandler, K. Foley and A. Haywood (2016), The PRISM4 (mid-Piacenzian) paleoenvironmental reconstruction, Clim. Past, 12, 1519-1538, doi:
10.5194/cp-12-1519-2016.
Erb, M. P., A. J. Broccoli and A. C. Clement (2013), The contribution of radiative feedbacks to orbitally driven climate change, J. Clim., 26(16), 5897-5914, doi:
http://dx.doi.org/10.1175/JCLI-D-12-00419.1.
Gregory, J. M., P. Huybrechts and S. C. Raper (2004), Climatology: Threatened loss of the Greenland ice-sheet, Nature, 428(6983), 616-616, doi: 10.1038/428616a.
Haywood, A. M., H. J. Dowsett, M. M. Robinson, D. K. Stoll, A. M. Dolan, D. J. Lunt, B.
Otto-Bliesner and M. A. Chandler: Pliocene Model Intercomparison Project (PlioMIP):
experimental design and boundary conditions (Experiment 2), Geosci. Model Dev., 4, 571-577, doi:10.5194/gmd-4-571-2011, 2011.
Haywood, A. M., H. J. Dowsett, A. M. Dolan … and U. Salzmann (2016), The Pliocene Model Intercomparison Project (PlioMIP) Phase 2: scientific objectives and experimental design. Clim. Past, 12(3), 663, doi: 10.5194/cp-12-663-2016.
Herbert T. D., L. C. Peterson, K. T. Lawrence, and Z. Liu (2010), Tropical ocean temperatures over the past 3.5 million years, Science, 328(5985), 1530–1534, doi:
10.1126/science.1185435.
Hill, D. J., K. P. Bolton and A. M. Haywood (2017), Modelled ocean changes at the Plio-Pleistocene transition driven by Antarctic ice advance, Nat. Commun., 8, 14376, doi:10.1038/ncomms14376.
Howell, P. (2001), ARAND time series and spectral analysis package for the Macintosh, Brown University. IGBP PAGES/World Data Center for Paleoclimatology Data Contribution Series #2001-044. NOAA/NGDC Paleoclimatology Program, Boulder,
Colorado, USA. [Available online at
http://www.cricyt.edu.ar/paleo/softlib/arand/download.html]
Hu, Y., D. Li and J. Liu (2007), Abrupt seasonal variation of the ITCZ and the Hadley circulation. Geophys. Res. Lett., 34(18), doi: 10.1029/2007GL030950.
Imbrie, J., E. A. Boyle, S. C. Clemens, A. Duffy, W. R. Howard, G. Kukla ... and B. Molfino (1992), On the structure and origin of major glaciation cycles 1. Linear responses to Milankovitch forcing, Paleoceanography, 7(6), 701-738, doi: 10.1029/92PA02253.
Kang, S. M., R. Seager, D. M. W. Frierson, and X. Liu, (2014), Croll Revisited: Why is the Northern Hemisphere Warmer than the Southern Hemisphere, Clim. Dyn., 44(5), 1457-1472, doi:10.1007/s00382-014-2147-z.
Knies, J., P. Cabedo-Sanz, S. T. Belt, S. Baranwal, S. Fietz and A. Rosell-Melé (2014), The emergence of modern sea ice cover in the Arctic Ocean, Nat. Commun., 5(5608), doi:
10.1038/ncomms6608.
Kuhlbrodt, T., A. Griesel, M. Montoya, A. Levermann, M. Hofmann, and S. Rahmstorf (2007), On the driving processes of the Atlantic meridional overturning circulation, Rev.
Geophys., 45, RG2001, doi:10.1029/2004RG000166.
Laskar, J., P. Robutel, F. Joutel, M. Gastineau, A. Correia, and B. Levrard (2004), A long-term numerical solution for the insolation quantities of the Earth, Astronomy &
Astrophysics, 428(1), 261-285, doi: http://dx.doi.org/10.1051/0004-6361:20041335.
Latif, M., E. Roeckner, U. Mikolajewicz and R. Voss (2000), Tropical stabilization of the thermohaline circulation in a greenhouse warming simulation, J. Clim., 13(11), 1809-1813.
Latif, M. (2001), Tropical Pacific/Atlantic Ocean interactions at multi-decadal time scales.
Geophys. Res. Lett., 28 , 539-542, doi: 10.1029/2000GL011837.
Lawrence, K. T., T. D. Herbert, C. M. Brown, M. E. Raymo, and A. M.
Haywood (2009), High-amplitude variations in North Atlantic sea surface temperature during the early Pliocene warm period, Paleoceanography, 24, PA2218, doi:10.1029/2008PA001669.
Lawrence, K., S. Sosdian, H. White and Y. Rosenthal (2010), North Atlantic climate evolution through the Plio-Pleistocene climate transitions, Earth Planet. Sci.
Lett., 300, 329–342, doi: http://dx.doi.org/10.1016/j.epsl.2010.10.013.
Lélé, M. I., L. M. Leslie and P. J. Lamb (2015), Analysis of low-level atmospheric moisture transport associated with the West African Monsoon. J. Clim., 28(11), 4414-4430, doi:
https://doi.org/10.1175/JCLI-D-14-00746.1.
Lisiecki L. E., and M. E. Raymo (2005), A Pliocene‐Pleistocene stack of 57 globally distributed benthic d18O records, Paleoceanography, 20, PA1003, doi:
10.1029/2004PA001071.
Lisiecki, L. E., and M. E. Raymo (2007), Plio–Pleistocene climate evolution: trends and transitions in glacial cycle dynamics, Quat. Sci. Rev., 26(1), 56-69, doi:
http://dx.doi.org/10.1016/j.quascirev.2006.09.005.
Lisiecki, L. E., M. E. Raymo, and W. B. Curry (2008), Atlantic overturning responses to Late Pleistocene climate forcings, Nature, 456, 85-88, doi: 10.1038/nature07425.
Lohmann, G. (2003), Atmospheric and oceanic freshwater transport during weak Atlantic
overturning circulation, Tellus A, 55(5), 438-449,
doi: 10.1034/j.1600-0870.2003.00028.x.
Madec, G., (2008), NEMO ocean engine. Note du Pole de modélisation 27, Institut Pierre-Simon Laplace, 193 pp. [Available online at http://www.nemo-ocean.eu/content/download/5302/31828/file/NEMO_book.pdf]
Mantsis, D. F., A. C. Clement, A. J. Broccoli and M. P. Erb (2011), Climate feedbacks in response to changes in obliquity, J. Clim., 24(11), 2830-2845, doi:
http://dx.doi.org/10.1175/2010JCLI3986.1.
Mantsis, D. F., B. R. Lintner, A. J. Broccoli, M. P. Erb, A. C. Clement and H. S. Park (2014), The response of large-scale circulation to obliquity-induced changes in meridional
heating gradients, J. Clim., 27(14), 5504-5516, doi:
http://dx.doi.org/10.1175/JCLI-D-13-00526.1.
Martínez-Botí, M. A., G. L. Foster, T. B. Chalk, E. J. Rohling, P. F. Sexton, D. J. Lunt ... and D. N. Schmidt (2015), Plio-Pleistocene climate sensitivity evaluated using high-resolution CO2 records, Nature, 518(7537), 49-54, doi: 10.1038/nature14145.
Mikolajewicz, U., M. Vizcaíno, J. Jungclaus, and G. Schurgers (2007), Effect of ice sheet interactions in anthropogenic climate change simulations, Geophys. Res. Lett., 34, L18706, doi: 10.1029/2007GL031173.
Mudelsee, M., and M. E. Raymo (2005), Slow dynamics of the Northern Hemisphere glaciation, Paleoceanography, 20(4), doi: 10.1029/2005PA001153.
Naafs, B. D. A., R. Stein, J. Hefter, N. Khélifi, S. De Schepper and G. H. Haug (2010), Late Pliocene changes in the North Atlantic current, Earth Planet. Sci. Lett., 298(3), 434-442, doi: http://dx.doi.org/10.1016/j.epsl.2010.08.023.
Otto‐Bliesner, B. L., A. Jahn, R. Feng, E. C. Brady, A., Hu and M. Löfverström, (2017), Amplified North Atlantic warming in the late Pliocene by changes in Arctic
gateways, Geophys. Res. Lett., 44(2), 957-964, doi: 10.1002/2016GL071805.
Park, W. and M. Latif (2012), Atlantic meridional overturning circulation response to idealized external forcing, Clim. Dyn., 39(7-8), 1709-1726, doi:
doi:10.1007/s00382-011-1212-0.
Park, W., N. Keenlyside, M. Latif, A. Ströh, R. Redler, E. Roeckner and G. Madec (2009), Tropical Pacific Climate and Its Response to Global Warming in the Kiel Climate Model, J. Climate, 22(1), 71-92, doi: 10.1175/2008jcli2261.1.
Petersen, G. N., J. E. Kristjansson and H. Ólafsson (2004), Numerical simulations of Greenland's impact on the Northern Hemisphere winter circulation, Tellus A, 56, 102–
111, doi:10.1111/j.1600-0870.2004.00047.x.
Peterson, L. C., G. H. Haug, K. A. Hughen, and U. Röhl (2000), Rapid changes in the hydrologic cycle of the tropical Atlantic during the last glacial, Science, 290(5498), 1947-1951, doi: 10.1126/science.290.5498.1947.
Rahmstorf, S. (1995), Bifurcations of the Atlantic thermohaline circulation in response to changes in the hydrological cycle, Nature, 378, 145, doi: 10.1038/378145a0.
Ravelo, A. C., D. H. Andreasen, M. Lyle, A. O. Lyle and M. W. Wara (2004), Regional climate shifts caused by gradual global cooling in the Pliocene epoch, Nature, 429(6989), 263-267, doi: 10.1038/nature02567.
Roeckner, E., G. Bäuml, L. Bonaventura, R. Brokopf, M. Esch, M. Giorgetta . . . and E.
Manzini (2003), The atmospheric general circulation model ECHAM 5. PART I: Model
description. [Available online at
http://pubman.mpdl.mpg.de/pubman/item/escidoc:995269/component/escidoc:995268/R eport-349.pdf]
Rohling, E. J., G. L. Foster, K. M. Grant, G. Marino, A. P. Roberts, M. E. Tamisiea, and F.
Williams (2014), Sea-level and deep-sea-temperature variability over the past 5.3 million years, Nature, 508(7497), 477-482, doi: doi:10.1038/nature13230.
Schiller, A., U. Mikolajewicz, and R. Voss (1997), The stability of the North Atlantic thermohaline circulation in a coupled ocean-atmosphere general circulation model, Clim.
Dyn., 13(5), 325-347, doi: 10.1007/s003820050169.
Schmittner, A., C. Appenzeller, and T. F. Stocker (2000), Enhanced Atlantic freshwater export during El Niño, Geophys. Res. Lett., 27(8), 1163-1166, doi: 10.1029/1999GL011048.
Semenov, V. A., W. Park and M. Latif (2009), Barents Sea inflow shutdown: A new mechanism for rapid climate changes. Geophys. Res. Lett., 36(14), doi:10.1029/2009GL038911.
Taylor, K. E., Stouffer, R. J., & Meehl, G. A. (2012). An overview of CMIP5 and the experiment design. Bulletin of the American Meteorological Society, 93(4), 485-498, doi: http://dx.doi.org/10.1175/BAMS-D-11-00094.1 .
Valcke, S., Ed., (2006), OASIS3 User Guide (prism_2-5). CERFACS Technical
Report TR/CMGC/06/73, PRISM Report No 3, Toulouse, France. 60 pp [Available online at http://www.prism.enes.org/Publications/Reports/oasis3_UserGuide_T3.pdf]
Vellinga, M., and P. Wu (2004), Low-latitude freshwater influence on centennial variability of the Atlantic thermohaline circulation, J. Clim., 17(23), 4498-4511, doi:
http://dx.doi.org/10.1175/3219.1.
Zhang, Z. S., K. H. Nisancioglu, M. A. Chandler, A. M. Haywood, B. L. Otto-Bliesner, G.
Ramstein, ... and C. Contoux (2013), Mid-pliocene Atlantic meridional overturning circulation not unlike modern?, Clim. Past, 9, 1495-1504, doi:
10.5194/cp-9-1495-2013 .
Figures
Figure 1. The orography and ice sheet mask of GrIS and their representation in the KCM. a) Difference (Modern minus Plio) of orography (shading, unit: m) and orography for Modern (contours, interval: 400m). b) Dark blue shaded areas represent ice sheet regimes in both Modern and Plio, light blue areas represent ice sheet regimes only in Modern. The configuration in Plio is a snapshot of mid-Piacenzian conditions taken from PRISM4 [Dowsett et al., 2016].
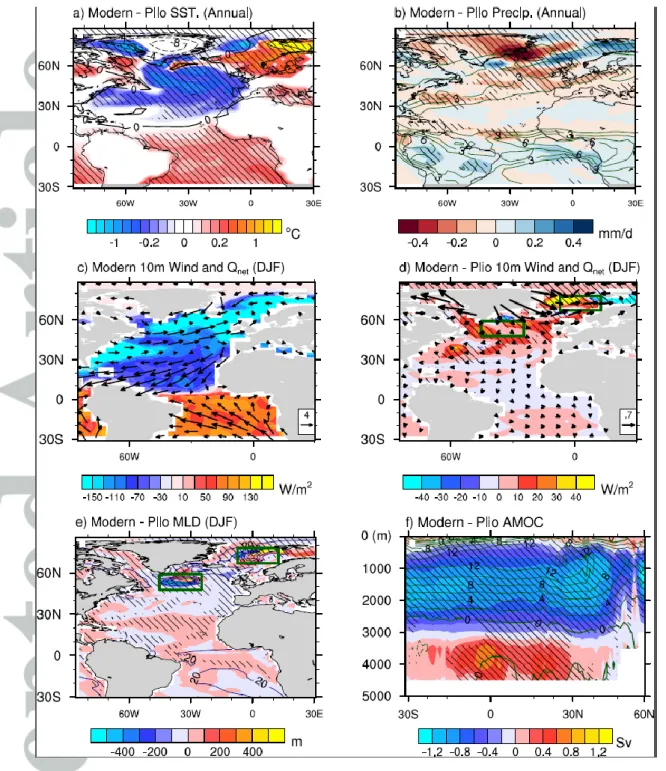
Figure 2. (a) Differences (Modern minus Plio) of annual mean sea surface temperature (shading, unit: K) and T2m (contours, interval: 2 K), (b) annual mean precipitation (contours, interval: 1.5 mm/day) and the difference (Modern minus Plio, shading, unit: mm/day), (c) climatological DJF mean 10-m wind vector (arrows, unit vector is 4 m/s) and net surface heat flux (shading, unit: W/m2) for Modern, (d) differences (Modern minus Plio) of DJF mean 10-m wind (arrows, unit vector is 0.7 m/s) and net surface heat flux (shading, unit: W/m2), (e) climatological DJF mean mixed layer depth (contours, interval: 400 m) and the difference
(Modern minus Plio, shading, unit: m), (f) climatological mean Atlantic meridional overturning circulation (contours, interval: 2 Sv) and the difference (Modern minus Plio, shading, unit: Sv). Positive difference for the surface heat flux in (d) stands for reduced oceanic heat loss to the atmosphere and vice versa. The green boxes in (d) and (e) indicate the Irminger Sea and GIN (Greenland-Iceland-Norwegian) Sea, which are the two main convection regions in the KCM. Hatching indicates the differences are significant at the 99%
confidence level using Student’s t-test.
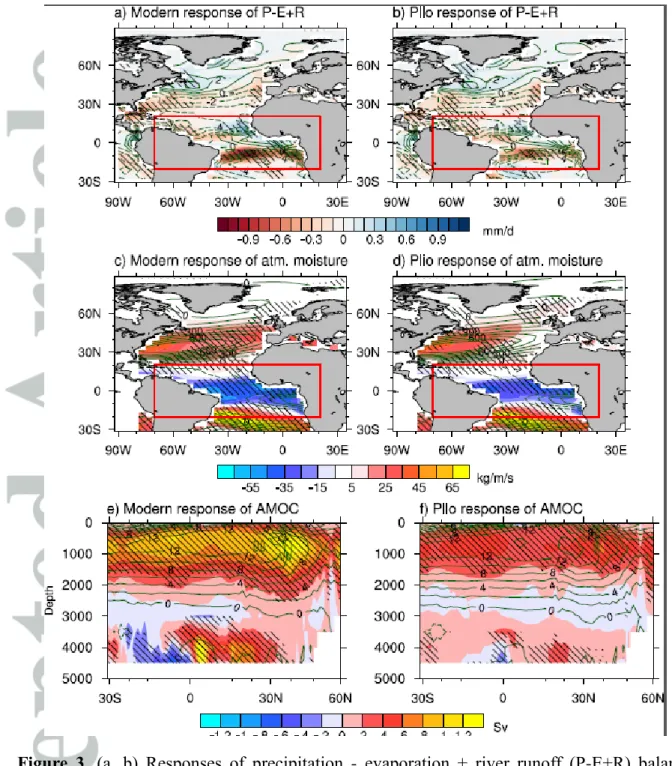
Figure 3. (a, b) Responses of precipitation - evaporation + river runoff (P-E+R) balance (shade; mm/day) to obliquity variation (Low minus High) for Modern (a) and Plio (b). Green contours show climatological mean P-E+R balance (contour interval: 1 mm/day) for Modern (a) and Plio (b). Negative (dashed contour) P-E+R balance indicates the ocean exports fresh water and vice versa. (c, d) Responses of vertically integrated (from the surface to 200 hPa) water vapor transport (shade; kg ∙ m−1∙ s−1) for Modern (c) and Plio (d). Green contours show climatological mean atmospheric moisture transport (contour interval: 100 kg ∙ m−1∙ s−1) for Modern (c) and Plio (d). Negative (dashed contour) atmospheric moisture transport
indicates the water vapor is transported from the Atlantic to the Pacific. (e, f) Responses of AMOC (shade; Sv) for Modern (e) and Plio (f). Green contours show climatological mean AMOC (contour interval: 2 Sv) for Modern (e) and Plio (f). Hatching indicates the response is significant at the 99% confidence level using Student’s t-test.
Table 1. Overview of the model simulations analyzed in this paper. Modern and Plio of the experiments are based on Modern and mid-Piacenzian (PRISM4) Greenland Ice sheet condition [Dowsett et al., 2016], respectively. Subscripts Low and High represent low (22.34º) and high (24.05º) obliquity, respectively.
Experiment name
Greenland Ice Sheet
Obliquity (º)
Integration time (model years)
Modern Modern 23.441 2700
Plio Mid-Piacenzian 23.441 1900
ModernLow Modern Low 1900
ModernHigh Modern High 1900
PlioLow Mid-Piacenzian Low 1900
PlioHigh Mid-Piacenzian High 1900
![Table 1. Overview of the model simulations analyzed in this paper. Modern and Plio of the experiments are based on Modern and mid-Piacenzian (PRISM4) Greenland Ice sheet condition [Dowsett et al., 2016], respectively](https://thumb-eu.123doks.com/thumbv2/1library_info/5341147.1681768/24.892.93.743.245.1139/overview-simulations-analyzed-experiments-piacenzian-greenland-condition-respectively.webp)
