Doctoral Thesis
Real-Time Feedback and Cavity-Mediated Spin Interactions in a Quantum Gas
Author(s):
Kröger, Katrin Publication Date:
2020
Permanent Link:
https://doi.org/10.3929/ethz-b-000446457
Rights / License:
In Copyright - Non-Commercial Use Permitted
This page was generated automatically upon download from the ETH Zurich Research Collection. For more information please consult the Terms of use.
ETH Library
Real-Time Feedback and
Cavity-Mediated Spin Interactions in a Quantum Gas
A thesis submitted to attain the degree of
DOCTOR OF SCIENCES of ETH ZURICH
(Dr. sc. ETH Zurich)
presented by
Katrin Kr¨ oger
MSc. ETH in Physics, ETH Zurich
born on 26.02.1994 citizen of Germany
accepted on the recommendation of Prof. Dr. Tilman Esslinger, examiner Prof. Dr. Manfred Sigrist, co-examiner Dr. Ramasubramanian Chitra, co-examiner
2020
Quantum simulation aims to enhance the understanding of natural phenomena by implementing a model Hamiltonian on a quantum many- body system. Quantum gases have proven one of the most successful platforms to realize these experiments. In particular, a quantum gas coupled to an optical cavity provides a framework for the study of long-range interactions in many-body systems. In addition, the finite photon leakage through the cavity mirrors enables real-time monitor- ing of the dynamics.
This thesis introduces a new tool to this framework: the cavity leakage is employed to feedback on the dynamics of the coupled atom- cavity system in real-time. The developed feedback scheme is a crucial step towards engineering of new phases and phase transitions through tailored feedback signals.
In addition, this thesis presents a series of experiments and a theo- retical investigation focusing on cavity-mediated spin interactions. At the core of the experimental setup supporting these results are a quan- tum degenerate Bose gas of 87Rb inside a high-finesse optical cavity and a transverse pump laser field which drives self-organization of the atoms. By tuning this transverse pump’s polarization and controlling the spin state of the atoms, the influence of the scalar and vectorial atomic polarizability on the self-organization phase transition is sys- tematically studied. For a balanced spin mixture, density and spin modulated organization patterns compete and the formation of a spin texture is observed. The influence of cavity dissipation on this compe- tition is investigated. The theoretical work reported herein addresses the situation in which a second transverse pump of slightly different frequency is added to the setup. Improvements of the experimental setup required to realize these proposals have been implemented in the course of the PhD and are also reported. This work lays the foun- dations for the realization of dynamical artificial gauge fields.
Quantensimulation zielt darauf ab, das Verst¨andnis nat¨urlicher Ph¨ano- mene durch die Implementierung eines Modell-Hamiltonians in einem Quantenvielteilchensystem zu verbessern. Quantengase haben sich als eine der erfolgreichsten Plattformen f¨ur die Realisierung solcher Ex- perimente herausgestellt. Insbesondere bietet ein Quantengas, welches an eine Mode eines optischen Resonators gekoppelt ist, einen Rah- men f¨ur die Untersuchung von langreichweitigen Wechselwirkungen in Vielteilchensystemen. Zus¨atzlich erm¨oglicht der endliche Photonenver- lust durch die Spiegel des Resonators das Beobachten der Dynamik in Echtzeit.
Diese Doktorarbeit erweitert dieses Gef¨uge um ein neues Werkzeug:
der Photonenverlust wird genutzt, um auf die Dynamik des gekoppel- ten Atom-Resonator Systems in Echtzeit r¨uckzukoppeln. Das entwi- ckelte R¨uckkopplungsschema ist ein wesentlicher Schritt f¨ur die Kon- struktion neuer Phasen und Phasen¨ubergange durch massgeschneider- te R¨uckkopplungssignale.
Weiterhin pr¨asentiert diese Doktorarbeit eine Reihe von Experimen- ten und eine theoretische Untersuchung, welche sich auf durch den Re- sonator vermittelte Spin-Wechselwirkungen konzentriert. Im Kern des experimentellen Aufbaus, der die Ergebnisse erm¨oglicht, befinden sich ein entartetes bosonisches Gas von 87Rb in einem Hoch-Finesse op- tischen Resonator und ein transversales Laser-Pumpfeld, welches die Selbstorganisation der Atome treibt. Durch das Einstellen der Polari- sation dieser transversalen Pumpe und die Kontrolle des Spinzustan- des der Atome wird der Einfluss der skalaren und vektoriellen atoma- ren Polarisierbarkeit auf den Selbstorganisation-Phasen¨ubergang sys- tematisch untersucht. F¨ur eine ausgewogene Spinmischung konkurrie- ren Dichte- und Spin-modulierte Organisationsmuster und die Bildung einer Spin-Textur wird beobachtet. Der Einfluss der Dissipation des Resonators auf diese Konkurrenz wird untersucht. Die hier berichtete theoretische Untersuchung behandelt die Situation, in der eine zweite transversale Pumpe mit leicht unterschiedlicher Frequenz dem Auf- bau hinzugef¨ugt wird. Verbesserungen des experimentellen Aufbaus, die f¨ur die Umsetzung dieser Vorhaben ben¨otigt werden und w¨ahrend des Doktorats implementiert wurden, werden ebenfalls vorgestellt. Die- se Arbeit legt den Grundstein f¨ur die Realisierung von dynamischen k¨unstlichen Eichfeldern.
Introduction 7
1 Experimental apparatus 13
1.1 Setup of the experiment . . . 13
1.2 Experimental sequence . . . 14
1.3 Optical cavity . . . 18
1.4 Polarization control . . . 19
1.5 Detection methods . . . 22
2 Self-organization and the Dicke phase transition 27 2.1 The self-organization phase transition . . . 27
2.2 From atom-light interaction to the Dicke Hamiltonian . 32 2.3 Properties of the Dicke phase transition . . . 37
3 Real-time feedback on a quantum gas coupled to an optical cavity 45 3.1 Feedback in quantum gases . . . 46
3.2 The goal of stabilizing mean intra-cavity photon numbers 47 3.3 Feedback architecture . . . 48
3.4 Measurements of self-organization with and without feed- back . . . 50
3.5 Conclusions . . . 54
3.6 Outlook . . . 55
4 Formation of a spin texture 57 4.1 Introduction . . . 58
4.2 Scalar and vectorial atom-light interaction . . . 59
4.3 Experimental methods . . . 60
4.4 Single-component cloud . . . 61
4.5 Two-component cloud . . . 68
4.6 Conclusion . . . 74
4.7 Outlook . . . 74
5 Dissipation-induced structural instability and chiral dynamics 77 5.1 Introduction . . . 78
5.2 Concept of our experiment . . . 79
5.3 Theoretical description . . . 80
5.4 Detection of the dissipation-induced instability . . . 85
5.5 Boundary of the dissipation-induced instability . . . 89
5.6 Phase diagram close to the critical polarization angle . . 92
5.7 Observation of limit cycles . . . 93
5.8 Limitations to our description and role of collisional in- teractions . . . 94
5.9 Conclusion . . . 96
5.10 Outlook . . . 97
6 Spin-changing self-organization with a U(1) symmetry 99 6.1 Setting the scene . . . 99
6.2 Derivation of the Hamiltonian . . . 100
6.3 Exploring the Hamiltonian . . . 105
6.4 Phase transition and excitation spectrum . . . 107
6.5 Conclusion . . . 116
6.6 Outlook . . . 117
Outlook 119
Bibliography 123
A Many-body Hamiltonian for spin-changing self-orga-
nization 143
B Hamiltonian for spin-changing self-organization ex-
pressed in Gell-Mann matrices 147
C Excitation spectrum in the superradiant phase in spin-
changing self-organization 149
List of Publications 155
Curriculum Vitae 157
In 1982, Richard Feynman introduced the concept of quantum sim-
ulation1: A model Hamiltonian is implemented in a synthetic and 1Feynman 1982
highly controllable quantum many-body system. The evolution of the system provides insights into the dynamics described by the Hamil- tonian. Quantum simulation supports the understanding of many- body systems, potentially even of those whose Hamiltonian cannot be solved analytically nor simulated numerically. Such systems range from condensed matter and high-energy physics to quantum chemistry and quantum biology.
A number of physical systems have been used to perform quantum
simulation experiments: trapped ions2, Rydberg atoms3, supercon- 2Cirac and Zoller 1995, Blatt and Roos 2012, Bruzewicz et al. 2019
3Browaeys and Lahaye 2020
ducting circuits4, photonic systems5 and ultracold atomic gases6, to
4Houck et al. 2012, Wendin 2017
5Aspuru-Guzik and Walther 2012
6Bloch et al. 2012, Gross and Bloch 2017
name a few. The latter stand out as a versatile platform for the study of quantum many-body systems offering unprecedented control and flex- ibility, with experimental capabilities including the clean preparation of states, the precise tunability of the potential landscape, and the con- trol over thermodynamic properties and dimensionality of the system.
Available detection methods7 range from various imaging methods of
7Bloch et al. 2008
the atomic cloud, be it in-situ or destructive probing of an ensemble or single atoms, to real-time detection of the scattered light fields.
Since the first observation of a Bose-Einstein condensate in 19958 8Anderson et al. 1995, Davis et al.
and of Fermi degeneracy in 1999 and 20019, various quantum many- 1995
9DeMarco and Jin 1999, Schreck et al.
2001, Truscott et al. 2001
body Hamiltonians including numerous phases and phase transitions have been experimentally implemented with ultracold atoms. Im- portant examples are the superfluid to Mott insulator phase transi-
tion in the Bose-Hubbard model10, the crossover from a Bose-Einstein 10Greiner et al. 2002
condensate of molecules to a Bardeen-Cooper-Schrieffer superfluid of
loosely bound pairs in a quantum degenerate Fermi gas11 and the 11Bourdel et al. 2004, Bartenstein et al. 2004, Greiner et al. 2005
Berezinskii-Kosterlitz-Thouless crossover in a two-dimensional bosonic
condensate12. Many-body quantum systems with imprinted disorder 12Hadzibabic et al. 2006, Hadzibabic and Dalibard 2011
exhibit crossovers linked to Anderson and many-body localization13.
13Billy et al. 2008, Roati et al. 2008, Rispoli et al. 2019
The aforementioned phase transitions were mostly driven by short- range interactions stemming from interatomic collisions14. The imple-
14Bloch et al. 2008
mentation of long-range interactions has for long remained a challenge.
Initial results have been obtained with ultracold gases of particles ex-
hibiting a large electric or magnetic dipole moment15, and with atoms 15Stuhler et al. 2005, Ni et al. 2008
excited to Rydberg states16. 16
Heidemann et al. 2008
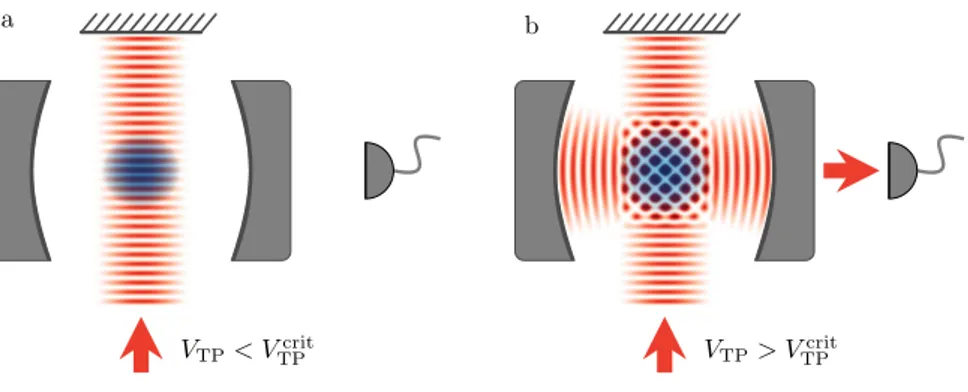
An alternative approach combines quantum gas experiments with cavity quantum electrodynamics. A quantum gas is placed inside a cavity and pumped with a transverse laser field. The pump laser in- duces dipoles in the atoms which radiate photons into the modes sup- ported by the cavity. Since these photons are delocalized inside the whole cavity, this process mediates effectively a long-range interaction between the atoms17.
17Ritsch et al. 2013
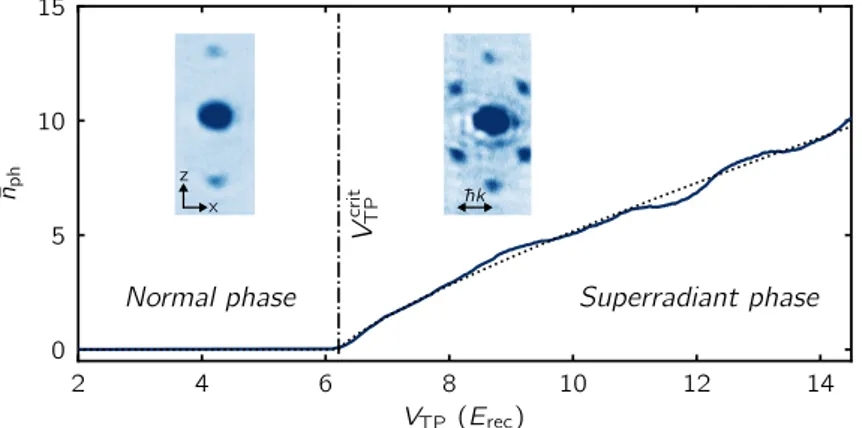
This setting has been used to experimentally realize and detect the Dicke model phase transition18. In this landmark experiment, a Bose-
18Baumann et al. 2010
Einstein condensate of 87Rb is placed inside a high finesse optical cavity. For a critical pumping strength of the transverse laser field, the combined atom-cavity system undergoes a phase transition to a self-organized phase, breaking a discrete Z2 symmetry. This phase transition can be mapped onto the Dicke model phase transition19.
19Dicke 1954, Hepp and Lieb 1973, Wang and Hioe 1973, Dimer et al.
2007, Nagy et al. 2010 In the self-organized phase, the atomic cloud exhibits a periodic den- sity modulation which scatters photons from the transverse pump into the cavity and vice versa. The phase transition is therefore signaled by the buildup of a coherent intra-cavity light field, which can be detected in real-time and non-destructively by analyzing the cavity output field.
This thesis will cover two main topics. The first is a new use of the aforementioned cavity output field. The output field is not only recorded to passively monitor the dynamics, but further processed to actively feedback onto the system20. The second, detailed further be-
20Kroeger et al. 2020
low, introduces spin to the self-organization framework.
Feedback plays an important role in the control of system param- eters found in natural, technological and artificial environments. The underlying principle consists in measuring the system’s current state, using a predefined measure to determine how much it deviates from the desired state, and apply an appropriate manipulation to bring it closer to the latter. In cold atom experiments, feedback has so far been used to stabilize experimental conditions. Recent theoretical propos- als show how to employ feedback to control phase transitions and cre- ate new non-equilibrium phases21. Specifically, applying time-delayed
21Mazzucchi et al. 2016, Ivanov et al.
2020 feedback to the driven and dissipative Dicke model may profoundly influence the dynamics and allow to engineer non-equilibrium phases with fixed points and limit cycles22. Our combined atom-cavity sys-
22Grimsmo et al. 2014, Kopylov et al.
2015 tem provides two key ingredients for realizing those proposals: it un- dergoes the Dicke phase transition and offers the possibility to monitor the dynamics in real-time via the light field leaking through the cav- ity mirrors. This thesis presents the first demonstration of continuous real-time feedback applied to a quantum gas. We demonstrate that we can stabilize the system both close to the self-organization phase transition and deep in the self-organized phase. Stabilizing a system close to the phase transition makes it possible to harness the increased sensitivity to external perturbations for sensing applications23. It also
23Wang et al. 2014, Zanardi et al.
2008, Pezz`e et al. 2019 enables the study of fluctuations over long time scales in close proxim- ity to the phase transition24.
24Landig et al. 2015
In the self-organized phase, the atomic density distribution arranges according to the phase of the intra-cavity light field, which in turn depends on the atomic density. This interrelation constitutes the self- consistent and dynamic character of the light potential experienced by the atoms. The nature of this interaction has been extensively investigated, for example, it gives rise to a roton-type mode soften-
ing25. Combining ultracold atoms in an optical cavity with optical 25Mottl et al. 2012
lattices enabled the investigation of Bose-Hubbard physics with addi-
tional long-range interactions26 and facilitated the study of metasta- 26Landig et al. 2016
bility and hysteresis between two insulating phases27. Three projects 27
Hruby et al. 2018
realized in the course of this PhD have expanded the cavity-mediated interactions to the spin degree of freedom. These results constitute, together with the dynamic character of the intra-cavity light field and the associated atomic density distribution, an important step towards the realization of cavity-assisted spin-orbit coupling and artificial dy-
namical gauge potentials28. 28Goldman et al. 2014, Padhi and
Ghosh 2014, Deng et al. 2014, Mive- hvar and Feder 2015, Kollath et al.
2016, Ballantine et al. 2017
The first of those projects investigated the spin- and polarization- dependence of the atom-cavity coupling within the framework of self-
organization29. By preparing different spin states of the F=1 total 29Landini et al. 2018
angular momentum ground state manifold of87Rb and tuning the ori- entation of the linear polarization of the transverse pump, the roles of the scalar and vectorial component in the dynamical polarizabil- ity have been elucidated both for single- and two-component atomic clouds. Good quantitative agreement has been found for the predic- tion of the critical lattice depth of the transverse pump required for self-organization and for the prediction of the phase of the scattered light field in the self-organized phase. For an atomic cloud contain- ing a balanced spin mixture, the scalar and the vectorial couplings are brought into competition. This results in a competition between density- and spin-modulated phases and leads to the formation of a spin texture beyond a critical vectorial coupling strength. At the crit- ical point where the scalar and vectorial coupling strengths become equal, the symmetry is enriched from a Z2to aZ4 symmetry.
The second project studied the influence of dissipation on the spin-
mixture30. Dissipation is known to lead to minor shifts of the transi- 30Dogra et al. 2019
tion point and small changes in the critical behavior close to a phase
transition31. However, dissipation can also radically change a system’s 31Syassen et al. 2008, Barontini et al.
2013, Brennecke et al. 2013, Labouvie et al. 2016, Tomita et al. 2017
behavior. Relevant examples are dissipative phase transitions32, the
32Syassen et al. 2008, Barontini et al.
2013, Brennecke et al. 2013, Labouvie et al. 2016, Tomita et al. 2017, Caru- sotto and Ciuti 2013, Fink et al. 2018, Young et al. 2020
emergence of new universality classes33, dissipation-induced topolog-
33Diehl et al. 2010, Nagy et al. 2011
ical effects34, complex dynamics35, or the splitting of multi-critical
34Diehl et al. 2011
35Buˇca et al. 2019
points36.
36Soriente et al. 2018
In our system the presence of dissipation fundamentally changes the system’s dynamics in another intriguing way. In the vicinity of the critical point where scalar and vectorial coupling strengths are equal, the cavity losses lead to the emergence of a dissipation-induced instability and chiral dynamics. The phenomenon of the instability is
analogous to a classical non-conservative positional force as found for a rotating shaft in a viscous fluid. By independently controlling the strength of the unitary and dissipative coupling, we have mapped out the boundary of this instability and have observed the character of stationary and non-stationary states. We have detected the formation of limit cycles in our system37. While we are usually interested in
37Piazza and Ritsch 2015, Chiacchio
and Nunnenkamp 2019 finding the ground state of a closed system or the steady state of an open system, limit cycles are a different class of solutions exhibiting non-stationarity. Limit cycles can occur on the path towards chaos as observed in optomechanical systems38or driven two-component Bose-
38Carmon et al. 2005, 2007, Metzger
et al. 2008 Einstein condensates39.
39Tomkoviˇc et al. 2017 Due to the presence of dissipation the Hamiltonian describing the system is non-hermitian. This is reminiscent of non-hermitian photonic systems which exhibit phase transitions breaking parity time symme- try40and contain exceptional points41.
40El-Ganainy et al. 2018
41Heiss 2012, Miri and Al`u 2019
The third project extended the study of cavity-mediated spin-de- pendent interactions to the coupling of different spin states via the cavity field. This setting gives rise to many different scenarios de- pending on the choice of the relative amplitude, frequency and phase between the two transverse pump fields. For example, it allows the realization of the interpolating Dicke-Tavis Cummings model42and of
42Baksic and Ciuti 2014, Zhiqiang
et al. 2017, Soriente et al. 2018 spin-changing self-organization breaking a continuous symmetry. It is also a promising route to realize dynamical spin-orbit coupling and artificial gauge fields43.
43Goldman et al. 2014, Padhi and Ghosh 2014, Deng et al. 2014, Mive- hvar and Feder 2015, Kollath et al.
2016, Ballantine et al. 2017
The emergence and observation of continuous symmetries is an ac- tive field of research in ultracold atoms. For example, coupling a Bose- Einstein condensate symmetrically to two crossed cavity modes has lead to the formation of a supersolid, breaking a U(1) symmetry, and enabled the detection of the Goldstone and Higgs mode44. The cou-
44L´eonard et al. 2017b,a
pling of a Bose-Einstein condensate to three crossed cavity modes has been shown to realizeZ2, U(1) or even SO(3) symmetries45. As part of
45Chiacchio and Nunnenkamp 2018
the third project presented herein, we have explored the Hamiltonian describing spin-changing self-organization in-depth from a theoretical perspective. This Hamiltonian describes a SU(3) algebra and features a continuous U(1) symmetry. The energy landscape, order parameters and excitation spectra have been calculated. The system can undergo a Dicke-like phase transition to a self-organized state. The excitation spectrum in the superradiant phase features a Goldstone mode asso- ciated to the U(1) symmetry46.
46Goldstone 1961
In order to enable the investigation of our theoretical findings, the capabilities of the experimental setup have been expanded in the course of the PhD through the installation of a new polarization resolving het- erodyne detection system with a bandwidth of 125 MHz, which is large enough to detect light emitted during spin-changing self-organization.
Additionally, a new optical breadboard above the vacuum chamber has been installed. The new breadboard offers more space for manipulat- ing the transverse pump light fields and provides increased stability.
Overall, this project has enhanced the Cavity lab’s theoretical and
experimental capabilities for calculating and realizing various Hamil- tonians with two transverse pump laser fields.
To sum up, the work presented in this thesis advances the field of ul- tracold quantum gases coupled to an optical cavity in two ways. On the one hand, a new experimental technique making use of the cavity leak- age field to feedback on the system is introduced. A first application of this technique for stabilizing the number of atoms both close to the self-organization phase transition and deep in the self-organized phase is demonstrated. On the other hand, the self-organization framework is extended to include long-range spin interactions. The work presented in this thesis ranges from demonstration and understanding of the ba- sic emerging physics and of the effect of dissipation, to a theoretical study of the Hamiltonian describing spin-changing self-organization.
These two overarching topics are treated separately in this thesis, but the feedback technique may be leveraged to advance the study of long- range spin interactions in future works. In a long term view, our work contributes to theCavity lab’s capabilities of implementing dynamical spin-orbit coupling and to the prospect of realizing dynamical artificial gauge fields in ultracold atomic gases.
The work presented in this thesis has been performed together with Lorenz Hruby, Manuele Landini, Nishant Dogra, Francesco Ferri, Rodrigo-Rosa Medina, Fabian Finger, Rui Lin, Ramasubramanian Chitra, Tobias Donner and Tilman Esslinger.
Outline of the thesis:
Chapter 1 introduces the setup used for all experiments described in this thesis. New components installed during the course of the PhD are presented in detail, including a new optical breadboard above the vacuum chamber and a new polarization resolving het- erodyne detection system with a bandwidth of 125 MHz. The new lab monitoring and alert system is described, as well as the insights gained on the preparation of a clean polarization of the transverse pump laser beam.
Chapter 2 introduces the concept of self-organization and a mathe- matical description of our system. The mapping to the Dicke model and features of the Dicke phase transition are presented.
Chapter 3 introduces the feedback scheme for stabilizing the intra- cavity photon number in the self-organized phase. Measurements showing the stabilization of both low photon numbers close to the phase transition and high photon numbers deep in the self-organized phase are presented.
Chapter 4 covers the study of polarization- and spin-dependent atom-light interaction and its influence on the self-organization phase transition for single- and two-component clouds. For a balanced
spin mixture, density and spin organization patterns compete. When the vectorial coupling dominates over the scalar coupling, a spin texture is formed, as inferred from the cavity light field.
Chapter 5 investigates the influence of cavity dissipation on the balanced spin mixture close to the critical point of equal scalar and vectorial coupling strengths. The presence of dissipation results in a dissipation-induced instability and chiral dynamics.
Chapter 6 presents the in-depth theoretical study of the Hamil- tonian describing spin-changing self-organization breaking a U(1) symmetry. The experimental implementation is described as well.
Note: Throughout this thesis, the sources of analogous quotes (para- phrases) are referred to via a superscripted number.
Experimental apparatus
The experiments presented in this thesis have been performed on the Cavity apparatus. This apparatus was set up in the years 2002 to 2005. It has since been constantly adapted to fulfill the changing ex- perimental requirements. The primary motivation of the experiment is to investigate phenomena at the interface between ultracold quantum gases and cavity quantum electrodynamics.
The setup has been described in numerous PhD theses. This chapter provides a concise overview of the essential elements of the setup and experimental procedures. We refer the reader to previous PhD theses throughout this chapter for more information on certain topics. We present in detail new topics which have not been covered in previous PhD theses: we describe a new upper breadboard in section 1.2.1, a new lab monitoring system in section 1.2.2, and a new heterodyne detection setup in section 1.5.1. Insights gained in the course of the PhD on the preparation of a clean polarization are presented in section 1.4.
The initial construction of the setup, with a detailed description of the vacuum chamber layout and the optical cavity, is described in ¨Ottl
et al.1 and in the PhD theses of ¨Ottl2, Ritter3 and Donner4. The 1Ottl et al. 2006¨
2Ottl 2006¨
3Ritter 2007
4Donner 2008
transverse pump setup is described in the PhD thesis of Baumann5.
5Baumann 2011
The current production cycle and layout of the beam paths is presented in detail in the PhD thesis of Hruby6. The PhD thesis of Dogra7
6Hruby 2018
7Dogra 2019
describes the current alignment procedure and methods to calibrate various experimental properties.
1.1 Setup of the experiment
The setup is located in a ≈ 50 m2 large room. Most of the devices are positioned around two optical tables from the company Newport.
On the first optical table, laser light with the desired frequency and linewidth to cool, trap, probe and image the atoms and to stabilize and probe the cavity is prepared. The second one hosts the vacuum chamber and further optical elements used for intensity stabilization, beam shaping and polarization control. The laser light is sent through optical fibers from the first to the second table.
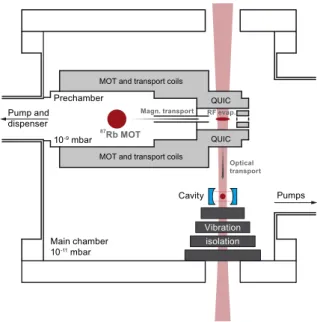
The vacuum system consists of a prechamber and a main cham- ber connected by a differential pumping tube. Figure 1.1 shows a
schematic sketch of the cross section of the vacuum chamber. The prechamber contains high vacuum with a pressure on the order of 1×10⁻⁹mbar and is connected to an ion pump which pumps 75 L s−1. The main chamber contains ultra high vacuum with a pressure on the order of 1×10⁻¹¹mbar and is connected to an ion pump which pumps 150 L s−1. The central part of the vacuum chamber is enclosed with µ-metal to shield the inside from magnetic field noise.
Figure 1.1: Schematic sketch of the cross section of the vacuum chamber.
Figure taken from the PhD thesis of Hruby (Hruby 2018).
87Rb MOT Pump and
dispenser
Vibration Cavity
RF evap.
10-9 mbar
Main chamber 10-11 mbar
Pumps QUIC
isolation Magn. transport
Optical transport QUIC MOT and transport coils
MOT and transport coils Prechamber
Numerous coils are positioned inside and outside of the vacuum chamber to allow for a precise control of the magnetic fields. An overview of the coils is presented in the PhD thesis of Dogra8.
8Dogra 2019
The execution of the experimental sequence requires synchroniza- tion and control of various elements of the experimental setup, includ- ing the frequency and intensity of lasers and radio waves, magnetic coil currents and beam shutters. The corresponding devices receive digital or analog signals sent from a central computer and generated by a software developed by the former PhD student Thilo St¨oferle9.
9St¨oferle 2005
1.2 Experimental sequence
We describe the experimental sequence used to produce, manipulate and destructively probe the ultracold atomic cloud. One cycle takes about 20 s.
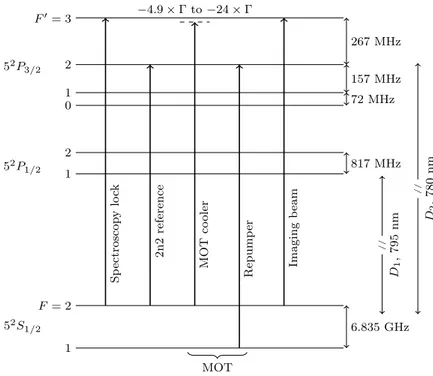
We work with 87Rb atoms. The level scheme and the laser tran- sitions are shown in figure 1.2. We load the magneto-optical trap10
10Raab et al. 1987
(MOT) from the background vapor of87Rb, which is released from a dispenser source11. The atoms are velocity selected and laser cooled
11Fortagh et al. 1998
from room temperature T ≈ 300 K to hundreds ofµK. The cooling laser operates at the D2 line of 87Rb |F = 2i → |F0= 3i. Since the
|F0 = 2ilevel is populated due to off resonant excitation, a repumper is applied on the transition|F = 1i → |F0= 2i. The atoms are subse- quently sub-Doppler cooled in an optical molasses12to a fewµK. Next,
12Lett et al. 1988
the atoms are optically pumped into the state|F = 1, mF =−1i. This
low-field seeking state can be magnetically trapped. The atoms are then magnetically transported through the differential pumping tube
into the magnetic quadrupole-Ioffe-configuration (QUIC) trap13. The 13Esslinger et al. 1998
atoms are evaporatively cooled close to degeneracy in the QUIC trap, but the condensation point is not yet reached. The effective trapping potential in the QUIC trap is decreased by inducing transitions from the magnetically trapped to the magnetically untrapped Zeeman states with radio frequency.
The atomic cloud is optically transported into the cavity via two counterpropagating laser beams close but different in frequency. This implements a moving optical lattice, mimicking a conveyor belt. The two counterpropagating beams are referred to as upper (propagating from above) and lower (propagating from below) transport beam and are of wavelength λ= 852 nm.
After reaching the cavity, the atoms are loaded into a crossed far-
off resonant dipole trap (FORT)14. The FORT consists of the lower 14Grimm et al. 2000
transport beam and the horizontal dipole trap beam. The dipole trap beam is also of wavelength λ= 852 nm and propagates perpendicular to the optical axis of the cavity in the horizontal plane. The atoms are evaporatively cooled to quantum degeneracy by lowering the depth of the optical potential. We can produce almost pure Bose-Einstein condensates with an atom number ranging between N = 1×10⁴ and 1×10⁵.
F0= 3
267 MHz 2
157 MHz
1 72 MHz
0
2 817 MHz
1
F = 2
6.835 GHz 1
// D2,780nm
// D1,795nm
52S1/2 52P1/2 52P3/2
Spectroscopylock 2n2reference MOTcooler
−4.9×Γ to−24×Γ
Repumper Imagingbeam
MOT
Figure 1.2: Level scheme and laser transitions for 87Rb. The numerical values are from Steck (Steck 2019).
The splittings are not drawn to scale.
Figure taken from the PhD thesis of Hruby (Hruby 2018) where it has been adapted from the PhD theses of J¨ordens (J¨ordens 2010) and Mottl (Mottl 2014).
The atomic cloud is subsequently manipulated by applying different optical and magnetic fields. During the manipulation period, any ex- isting intra-cavity light field will continuously leak through the cavity mirrors. This light field can be detected.
After the manipulation, the atomic cloud is destructively probed in
resonant absorption imaging. The atoms are first transferred from the
|F= 1i manifold to the |F0= 2i state via the repumping laser and then decay into the|F = 2i state. They are then imaged using light resonant on the|F = 2i → |F0 = 3itransition.
1.2.1 New upper breadboard
In the course of the PhD, the breadboard above the vacuum chamber, referred to asupper breadboard, has been exchanged with a new one.
This exchange was motivated by two major considerations:
First, there was no free space left on the old upper breadboard. This limited the experimental capabilities. For example, the experimental realization of different scenarios within the framework of spin-changing self-organization requires a flexible positioning of the retroreflecting mirror, as presented in chapter 6. To increase the efficiency in data acquisition, the waveplates should be mounted in motorized (instead of manual) rotation mounts, which requires more space, see the discussion in section 1.4. More space is also necessary to implement another transverse pump which enters the vacuum chamber from above. The old upper breadboard had the outer dimensions 550 mm x 450 mm x 12.7 mm.
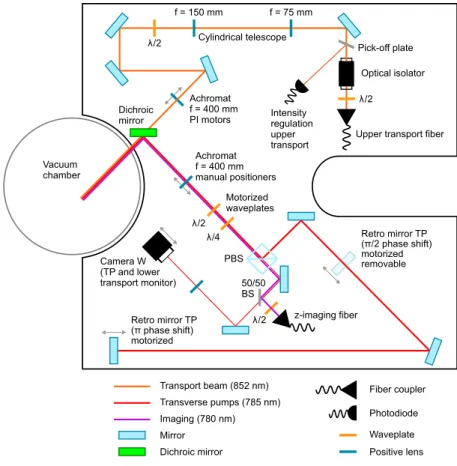
Figure 1.3: Sketch of the beam paths on the new upper breadboard. BS:
beam splitter, PBS: polarizing beam splitter, TP: transverse pump.
Vacuum chamber
Upper transport fiber Optical isolator Pick-off plate Cylindrical telescope
f = 150 mm f = 75 mm
Intensity regulation upper transport Dichroic
mirror
z-imaging fiber Camera W
(TP and lower transport monitor)
PBS
Retro mirror TP (π/2 phase shift) motorized removable λ/2
Retro mirror TP (π phase shift) motorized
λ/2
Achromat f = 400 mm manual positioners
λ/2 λ/4
Motorized waveplates
50/50 BS Achromat f = 400 mm PI motors
λ/2
Dichroic mirror Transport beam (852 nm) Transverse pumps (785 nm) Imaging (780 nm)
Mirror Waveplate
Positive lens Fiber coupler Photodiode
Second, the old upper breadboard was a main source of instabil- ity. The old upper breadboard was a standard 12.7 mm thick alu- minium optical breadboard. It was firmly supported in the center by a brass construction and slightly supported on the edges by thin op-
tical postholders. Over the years, it has been densely packed with optics, such that it could not offer the desired stability anymore.
The new upper breadboard is designed to offer more space and in- creased stability. It is custom made with cutouts to fulfill the existing space constraints given by the vacuum chamber. Its shape is illus- trated in figure 1.3. The outer dimensions are 800 mm x 800 mm x 61 mm. It is a virtually nonmagnetic all 316 stainless steel metal con- struction, consisting of a top facesheet, a honeycomb structure inside and a bottom facesheet. The edges are covered with a self-damping bond. It weight amounts to ≈ 62 kg. It is firmly held by the brass construction in the center and by three additional brass posts on the outer edges with a diameter of 60 mm.
The current layout of the beam paths is shown in figure 1.3. The breadboard hosts the path for the upper transport beam, the retrore- flection of the transverse pump, and one imaging beam.
20 40 60 80
Zeeman splitting [MHz]
0 2 4 6 8
Distance[m]
π/4 π/2 3·π/4 π
Figure 1.4: Distance between the atomic cloud and the retroreflecting mirror required to realize different spatial phases between two transverse pump lattices as a function of the Zee- man splitting.
Some special elements on the new upper breadboard are:
Motorized translation stages. The achromatic lens in the path of the upper transport beam is mounted on three translation stages such that the lens can be translated along all three directions. The stage which moves the lens parallel to the beam is a manual stage.
The two stages which move the lens orthogonal to the beam di- rection are motorized translation stages. The model is ”Q-motion precision linear stage Q-545.140” from the company PI with a travel range of 13 mm, a resolution of 1 nm and a bidirectional repeatabil- ity of 200 nm. The precision is higher than needed for our purpose, but the market offered either these precision stages or stages with
a precision too low for our specifications15. 15We required a minimum travel range of 50µm and a repeatability and resolution of 1µm.
Dichroic mirror. The dichroic mirror is custom made by the com- pany Lens Optics. It has a 2 inch diameter. It is highly reflecting for the wavelengths 780–791 nm and highly transmitting at 852 nm.
It is optimized to induce a minimum phase shift between s- and p-polarization for light incident under 45°.
Motorized waveplates. The waveplates in the path of the trans- verse pump have a diameter of 1 inch and are mounted in motor- ized rotation cages. We have chosen zero order waveplates from the company Altechna. The waveplates have a very low wedge, which is beneficial for avoiding misalignment of the beam when the wave- plates are rotated.
Retroreflecting mirror. The upper breadboard has enough space to position the retroreflecting mirror at different distances from the atomic cloud, such that different spatial phases in the framework of spin-changing self-organization with two transverse pump lattices, presented in chapter 6, can be realized. Figure 1.4 shows the re- quired distance between the atomic cloud and the retroreflecting mirror to realize a certain phase shift for a given Zeeman splitting.
Figure 1.3 indicates two positions of the retroreflecting mirror to
realize either a difference of π/2orπin the spatial phase of the two transverse pump lattices. The retroreflecting mirror is attached to a motorized mirror mount for fine alignment.
1.2.2 Lab monitoring
During the course of the PhD, an online monitoring and alarm system of crucial environmental and system parameters of the laboratory has been implemented.
The environmental parameters are acquired through theEnvicosys- tem developed in-house by the electrical engineer Alexander Frank.
The recorded environmental parameters include temperature, humid- ity, key performance indicators of the air conditioning system and the power grid frequency.
The system parameters are acquired with the Keysight 34972A LXI Data Logger. This device is a crucial component of the interlock sys- tem which is described in the PhD thesis of Hruby16. It is connected
16Hruby 2018
to the internal lab network through an ethernet cable. The recorded system parameters include coil temperatures, ion pump voltages and the status of water flow and water leakage sensors. A permanently runningpythonscript communicates with the device using the library pythonvisa and writes the data to aninfluxDB17 database. The data
17InfluxData Inc. 2020
acquired with theEnvicosystem is written to the same database.
The entries of the database are visualized with the open-source tool Grafana18. Grafana allows to visualize and monitor data from differ-
18Grafana Labs 2020
ent sources in one interface. It also features an alert function. Noti- fications are sent out via e-mail and mobile text messages if essential parameters are out of the desired range.
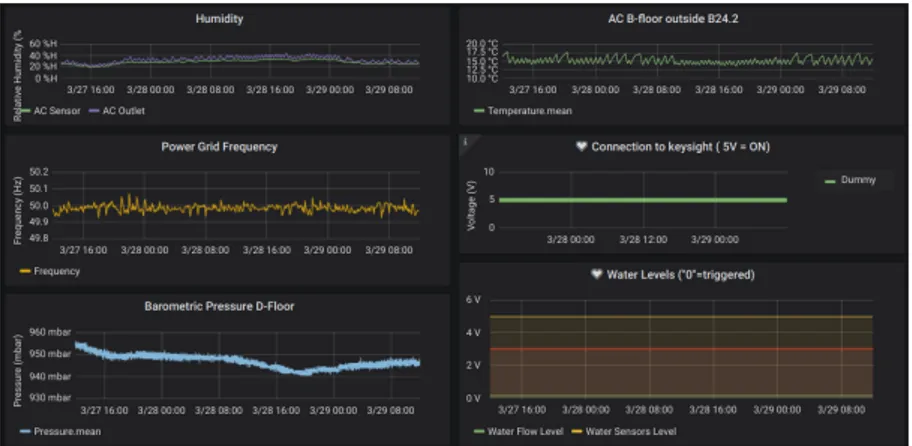
Figure 1.5 shows a screenshot of a part of the interactive online dashboard.
Figure 1.5: Screenshot of a part of the interactive online dashboard in Grafana. Various environmental and system parameters are visualized.
1.3 Optical cavity
The study of the interaction between light and atoms benefits from using a cavity. First, the cavity modifies the electromagnetic density of states such that the emission probability into the cavity mode is
strongly enhanced, compared to scattering of an atom in free space.
This is known as the ”Purcell effect”19. Second, the properties of our 19Purcell 1946
cavity allow us to reach the single-atom strong coupling regime. A single photon in the cavity is reflected many times between the two mirrors, resulting in a stronger electromagnetic field felt by the atoms, as compared to a single round trip. Third, the finite leakage through the cavity mirrors enables real-time readout of the state of the system.
In our experimental setup, the main chamber hosts the high-finesse optical cavity. We give the main specifications of the cavity in this
section. More information can be found in ¨Ottl et al.20 and in the 20Ottl et al. 2006¨
PhD theses of ¨Ottl21and Ritter22. 21Ottl 2006¨
22Ritter 2007
The cavity consists of two dielectric Bragg mirrors with very high reflectivity and very low losses. The mirrors have a curvature radius of R = 77.5 mm. They are in the near planar configuration and are a distance of lres = 178µm apart. The Gaussian mode waist isw0 = 25.5µm. The cavity is positioned on a vibration isolation system.
The maximum atom-cavity coupling constant amounts tog = 2π·
10.6 MHz, see the PhD thesis of Brennecke23. The free spectral range 23Brennecke 2009
is given by ∆νFSR = 2π·0.84 THz and the full width half maximum cavity linewidth is given by ∆ν= 2κ= 2π·2.5 MHz. This results in a finesse of
F = ∆νFSR
∆ν = 2π
2T+ 2L ≈3.4×10⁵, (1.1) with transmission and loss coefficients T = 2.3 ppm andL= 6.9 ppm for 780 nm.
We perform our experiments with the lowest order transverse elec- tromagnetic mode, abbreviated as TEM00 mode. This mode is split into two linearly polarized TEM00 eigenmodes. Since the cavity is birefringent, the two modes are split in frequency by 2π·2.2 MHz.
The frequencies of the cavity resonance, the transverse pump and the laser probing the cavity transmission are all locked with respect to each other via a transfer cavity. Details on this locking scheme can be
found in the PhD theses of Landig24, Hruby25 and Dogra26. 24Landig 2016
25Hruby 2018
26Dogra 2019
1.4 Polarization control
The works presented in chapters 4 and 5 require a very high control of the polarization of the transverse pump. The polarization has to be as linear as possible. In this section we present our insights on polarization control.
1.4.1 Alignment of waveplates
The laser beams are guided through optical fibers from the first to the second optical table. In order to be able to deterministically prepare light of a certain polarization, the laser beam, after exciting from the
fiber, passes through aλ/2-waveplate and a polarizing beam splitter.27 27The light exciting the optical fiber is linearly polarized. Theλ/2-waveplate aligns the polarization axis of the light with the orientation of the polarizing beam splitter such that a maximum amount of light is transmitted.
This process is referred to as ”polarization cleaning”. The polariza- tion after the polarizing beam splitter is always the same. The inten-
sity however might vary, this is compensated through intensity lock schemes.
To prepare an arbitrary polarization state of the laser beam, we employλ/2- andλ/4-waveplates. It is very important to carefully align the position and orientation of the waveplates in the beam path, so that the polarization state changes in the intended way. We discuss this for the case of aλ/2-waveplate in the following.
We consider the following setup: Laser light exits a fiber and passes through a firstλ/2-waveplate and a polarizing beam splitter. Theλ/2- waveplate is set such that the transmission through the polarizing beam splitter is maximum. The light transmitted through the polariz- ing beam splitter passes through a secondλ/2-waveplate and enters a polarization analyzer28. We aligned the path such that the light enters
28We use the model SK010PA-NIR from Sch¨after-Kirchhoff as the polar-
ization analyzer. the polarization analyzer orthogonally to its detection surface (this is ensured by visually inspecting the backreflection) and centered in the pinhole in front of the detector. The polarization analyzer measures the polarization state of the light in terms of the angular coordinates 2θand 2ηof the Poincar´e sphere. The angleθ∈[−90°,90°] defines the orientation of the electric field vector in the horizontal-vertical plane.
The angle θ = 0°(±90°) corresponds to vertical (horizontal) polar- ization. The angleη ∈ [−90°,90°] defines the ellipticity. The values η= 0°=±90°describe light with no elliptical component. The values η=±45°correspond to purely left- or right circular polarization.
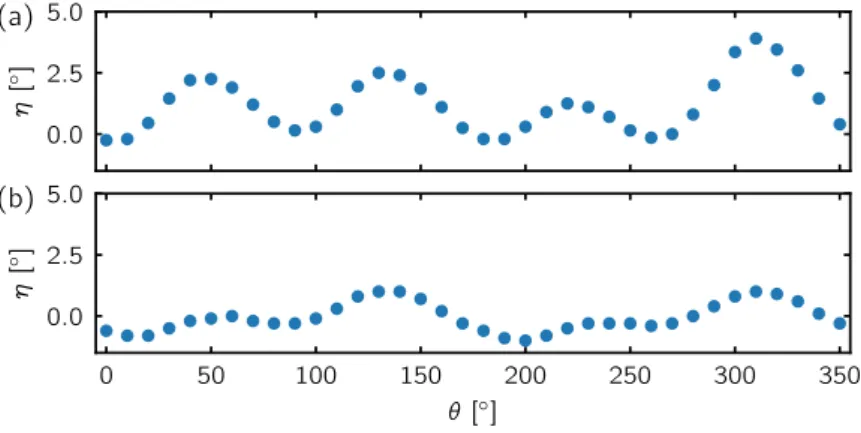
Figure 1.6: Ellipticity η of the elec- tric field vector as a function of its lin- ear orientation, expressed throughθ, shown for (a) no consideration of the
alignment and (b) a careful alignment. 0.0 2.5 5.0
η[◦]
(a)
0 50 100 150 200 250 300 350
θ [◦] 0.0
2.5 5.0
η[◦]
(b)
Let us first consider the case where the λ/2-waveplate is mounted in the optical path without taking special care of the alignment. The ellipticityηas a function of the linear angleθis shown in figure 1.6(a).
The ellipticityη shows clear variations of up to almost 5°. In theory, a λ/2-waveplate should not introduce any ellipticity. The finite ellip- ticity arises from imperfections of the material. Their effect can be minimized with the appropriate alignment.
Figure 1.6(b) shows the same measurement after the λ/2-waveplate was aligned carefully. The ellipticityηis significantly less pronounced.
We paid attention to the following points during alignment: first, the beam should hit the waveplate orthogonally to its surface. We checked this through the backreflection. Since the waveplate has an
anti-reflection coating, the power of the incident beam needs to be suf- ficiently high to be able to see the backreflection. Second, we aimed to hit the waveplate in the center on its rotation axis, such that the ef- fect of surface inhomogeneities is minimized. An iris placed behind the
λ/2-waveplate helped to find the center. We checked that we hit the ro- tation axis by minimizing the circular movement of the backreflection when the waveplate is turned. We could not fully erase this move- ment because the normal vector of the surface of theλ/2-waveplate is not parallel to its rotation axis. We mounted the rotation mount on a tiltable stage to achieve the control necessary to perform this fine alignment.
1.4.2 Polarization of the transverse pump
The control of the polarization of the transverse pump is more involved due to the presence of birefringent optics in its beam path. Shortly before the transverse pump beam enters the vacuum chamber, it is combined with the lower transport beam on a dichroic mirror. The
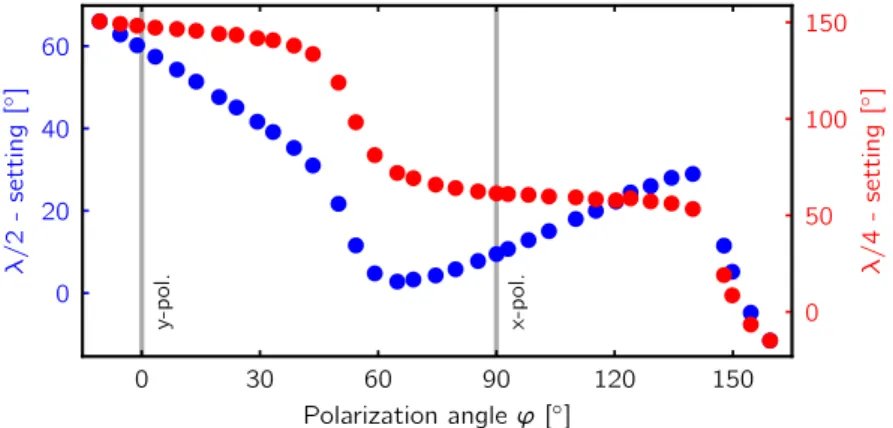
λ/2- and λ/4-waveplate are positioned before this dichroic mirror due to space constraints. The dichroic mirror is strongly birefringent and introduces significant ellipticity to the polarization of the transmitted transverse pump beam. The amount of ellipticity introduced depends in a non-linear fashion on the polarization state of the incident light field. We therefore created a map of the settings of the λ/2- andλ/4- waveplates required to create a linear polarization after the transverse pump has passed the dichroic optics. The closest location to the atoms where we could position the polarization analyzer was behind the upper viewport of the vacuum chamber. We do not expect the viewports to introduce a relevant amount of ellipticity. The resulting map is shown in figure 1.7. It emphasizes the importance of checking carefully how the intended polarization can be created. The measurements were taken at a wavelength of the transverse pump of 784.7 nm.
0 30 60 90 120 150
Polarization angleϕ[◦] 0
20 40 60
λ/2-setting[◦] y-pol. x-pol. 0
50 100 150
λ/4-setting[◦]
Figure 1.7: Polarization map for the transverse pump at a wavelength of 784.7 nm. The settings of the λ/2- (blue) and λ/4-waveplate (red) re- quired for a certain linear polarization angle ϕ of the transverse pump are shown. The x(y)-direction is parallel (orthogonal) to the optical axis of the cavity. The transverse pump propa- gates along the z-direction. The fig- ure is modified from the PhD thesis of Dogra (Dogra 2019).
The transverse pump is retroreflected on a mirror on the upper breadboard to create the transverse pump lattice. After the transverse pump and lower transport beam have exited from the viewport, they are guided onto the upper breadboard and separated on a dichroic
mirror. The transverse pump subsequently passes through aλ/2- and aλ/4-waveplate, followed by a polarizing beam splitter. The settings of theλ/2- andλ/4-waveplate are chosen such that all the light is reflected at the polarizing beam splitter. This light is then reflected at the retroreflecting mirror. The retroreflected beam passes through the same path as the incident beam. This procedure ensures that the reflected beam has the same polarization as the incident beam.
The incident transverse pump passes through waveplates mounted in computer-controlled motorized rotation cages before it enters the vacuum chamber. Due to space constraints, the waveplates on the up- per breadboard could not be mounted in a motorized rotation cage, but had to be adjusted manually. They were exchanged with computer- controlled motorized mounts on the new spacious upper breadboard described in section 1.2.1.
1.5 Detection methods
We infer information about the system from measurements of the atoms and of the intra-cavity light field leaking through the cavity mirrors.
We detect the state of the atoms at the end of the manipulation period via high-intensity resonant absorption imaging. Details of the measurement procedure and data analysis can be found in the PhD theses of Landig29, Hruby30 and Dogra31.
29Landig 2016
30Hruby 2018
31Dogra 2019
We detect the intra-cavity light field after it has leaked through the cavity mirrors with either a single photon counting module or a heterodyne detection system.
The single photon counting module records the arrival times of the detected photons. It therefore only allows to detect the intensity of the light field. The single photon counting module is described in the PhD theses of Ritter32and Baumann33.
32Ritter 2007
33Baumann 2011 A heterodyne detection system allows for the frequency-resolved re- construction of the amplitude and phase of the electromagnetic field.
The PhD thesis of Baumann34contains a comprehensive introduction
34Baumann 2011
to the principle and advantages of heterodyne detection. Over the course of the PhD, a new heterodyne detection system was imple- mented. We present the new system in more detail in the following section. A detailed description of the old heterodyne detection sys- tem, including the optical and electronic setup and the phase locks, can be found in the PhD theses of Baumann35 and Landig36. The
35Baumann 2011
36Landig 2016 data presented in the chapters 3, 4 and 5 has been recorded with the old heterodyne detector.
1.5.1 New heterodyne detection system
The new heterodyne detection system was developed with the master student Joshua Maas. More details on the new system can be found in his master thesis37.
37Maas 2018
Principle of heterodyne detection
In a heterodyne detection system, the signal of interest is interfered with a reference signal called local oscillator.
Let Es(t) =|Es|ei(ωst+φ(t)) andElo(t) =|Elo|eiωlot be the complex electric fields of the signal and the local oscillator, with the respective amplitudes|Es|,|Elo|, the frequenciesωs,ωlo, and the time-dependent phase of the signal relative to the local oscillatorφ(t). The two electric fields are interfered at an optical beamsplitter. The two output fields are each detected with a photodetector. The corresponding intensity in each output mode reads
I±=Is+Ilo±2p
IsIlocos (ωt+φ(t)), (1.2) with the intensities Is and Ilo and the difference frequency ω =ωs− ωlo. The interference term differs in the sign since the two output modes are phase-shifted relative to each other at the beam splitter.
The intensities are converted to a photocurrent at the detectors. In a balanced heterodyne detection, which we use, the two detector signals are subtracted, so that only the interference term signalSis processed further.
We can see from equation (1.2) that the interference term contains the product of the intensities of the signal and local oscillator. Choos- ing a high intensity of the local oscillator is therefore practical to am- plify the signal. This is one advantage of heterodyne detection. An- other advantage is that the signal of interest, which has a frequency on the order of 100 THz, is shifted to the frequencyω=ωs−ωlo. The frequency of the interference signal can be thus tuned to lie in the radio-frequency domain. This allows to use commonly available detec- tors and electronics for signal detection and further signal processing.
Motivation for the new heterodyne detection system
In the old heterodyne setup, the interference term signal S is first electronically processed. Specifically, for a signal at the frequency
of the transverse pump38, the difference frequency is set to be ω = 38In conventional self-organization, the light scattered into the cavity mode is at the same frequency as the transverse pump, as explained in chapter 2.
59.55 MHz. The signal is split, partly phase-shifted and downmixed with 59.503 MHz in an analog circuit. The two quadratures of interest are therefore oscillating at 47 kHz. These two signals are then further digitally processed. The main postprocessing operations are the recon- struction of the magnitude and phase of the incident electromagnetic field at a certain frequency and the construction of a spectrogram. De- tailed descriptions of different signal processing methods can be found
in the master thesis of Maas39. The PhD thesis of Dogra40 describes 39Maas 2018
40Dogra 2019
the signal processing methods used for the data presented in the chap- ters 3, 4 and 5.
The new heterodyne detection system features an all digital signal processing platform. This is motivated by experiments we can per- form within the framework of spin-changing self-organization, which is introduced in chapter 6. We can realize experimental settings where we expect components of the intra-cavity light field to oscillate at a frequency shifted by values on the order of the Zeeman frequency from
the transverse pump. We can realize Zeeman shifts on the order of 30–70 MHz in our setup. Detecting these light fields would require a change in the design of the analog circuitry for the old heterodyne setup. Since the bandwidth of the old heterodyne detection is limited to 250 kHz, this would make the search for new frequency components in the light field rather cumbersome41. The new heterodyne detection
41The bandwidth of the acquisition card of the old heterodyne detection system is limited to 1 MHz. The in- stalled electronic components limit the bandwidth to 250 kHz.
system features a bandwidth of 125 MHz.
Another motivation for the new heterodyne detection system is that experiments relying on the vectorial polarizability, introduced in chap- ter 2, can lead to the population of both polarization modes of the cavity. The old setup can detect light of only one polarization state and hence only one of the two modes in the cavity. The new hetero- dyne detection system features two phase-locked balanced heterodyne detectors and polarization optics so that the full frequency-resolved polarization state of the light field can be detected within the band- width of the detector.
Design of the new heterodyne detection system
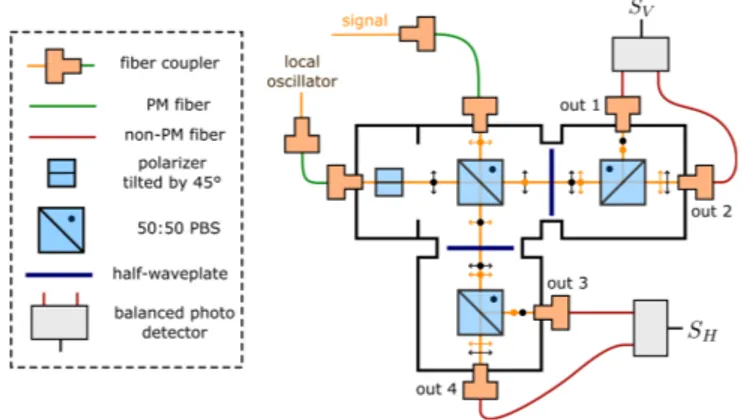
The new heterodyne detector features a hybrid design combining op- tical fibers and free space optics. This offers an increased stability of the setup, while allowing the use of high quality free-space polarization optics. Figure 1.8 shows a scheme of the setup.
Figure 1.8: Scheme of the optical design of the new heterodyne detec- tor. A rigid multicube interferometer is combined with fiber-coupled input and output ports. The setup detects, besides the magnitude and phase, also the polarization state of the signal light field. Figure taken from the mas- ter thesis of Maas (Maas 2018).
The signal beam and the local oscillator beam are coupled into fibers and then enter a compact ”Multicube” system custom-made by the company Sch¨after Kirchhoff. The multicube interferometer has fiber- coupled input and output ports. The light is propagating through free space inside the system. This has the advantage that free-space po- larization optics can be used, which have a higher optical quality than fiber-based polarization optics. Another disadvantage of fiber-based polarization optics is that the currently available components do not offer continuous tuning of the polarization, but only offer fixed discrete transformations. The multicube interferometer is sealed against direct air flow, enhancing the stability of the interference signal. Since the multicube interferometer is very rigid and stable, it can function for a long time without the need for realignment.
An advantage of the fiber-coupled input and output ports are that any misalignment results only in a change in intensity, not in the mode
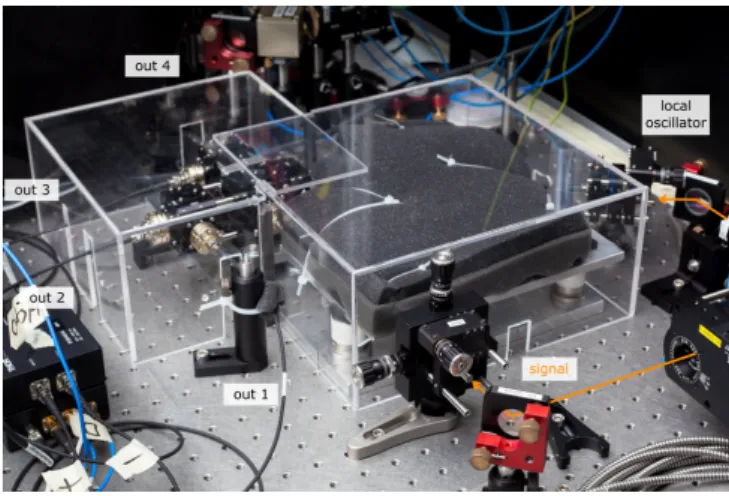
overlap. This greatly simplifies the alignment procedure. Another advantage of the fibers is that the optical path length is independent of air flow and changes in humidity. Any difference in the optical path length should be avoided, since this results in a miscalculation of the relative phase of the signal light field. The optical path length in the fibers however depends on temperature changes of the fibers, mechanical stress and vibrations. Specifically, in order to meaningfully compare the calculated electric field between different experimental cycles, the absolute temperature of the fiber guiding the signal must not change. Moreover, the optical path length between the signal and the local oscillator beam must stay constant. It differs when the mean temperature of the two fibers is different. Therefore, the fibers are attached to a massive, vibration-damped aluminium plate, acting as a heat sink. The fibers are arranged in direct contact with each other and are covered by foam to isolate them from temperature changes in the environment and vibrations. Lastly, the whole setup is covered with a Plexiglas enclosure to limit air flow. Figure 1.8 shows a photograph of the setup.
Figure 1.9: Photograph of the new heterodyne detector. The signal and local oscillator beam are coupled into fibers. These fibers are attached to an aluminium plate and covered with foam to isolate them from mechani- cal vibrations and temperature drifts.
The multicube interferometer is shown on the left, with four fiber output ports. Photograph taken from the master thesis of Maas (Maas 2018).
Signal processing
The new heterodyne detection system features a flexible all-digital signal processing architecture written in python. It allows adapting the signal processing routine to the current experimental requirements without any changes in the hardware. The exact signal processing methods can be chosen through a graphical user interface. New signal processing methods can be added easily, without the need to change the underlying structure of the software. The speed of the data pro- cessing is greatly increased through the use of concurrent computing.
The software is described in detail in the master thesis of Maas42. 42Maas 2018