Jfirgen Ebert, Roger Sfittenbach, Ingar Uhe University of Koblenz-Landau
Institute for Software Technology {ebert, sbach, uhe}@informatik.uni-koblenz.de
Abstract. Meta-CASE tools are used to generate CASE tools; KOGGE is such a meta-CASE system. Two of KOGGE's main objectives are adaptability and flexibility which address the growing need for prob- lem specific solutions. As an example it is shown how a CASE tool for the object-oriented method BON - BONsai - was constructed us- ing KOGGE.
K e y w o r d s : Meta-CASE, CASE, declarative modeling, software engineering en- vironments, BON
1 I n t r o d u c t i o n
C A S E (Computer Aided Software Engineering) was one of the buzzwords of the late eighties. However, use of CASE tools in practice showed that they were not applied as widely as expected. One of the reasons for this is that there are so many different methods, dialects of methods, heterogeneous environments and continuously changing requirements. Thus, most CASE tools do not fit their specific context exactly. The inflexibility of the existing CASE systems demon- strated that there was a need to build systems which can be adjusted to the individual situation.
M e t a - C A S E t o o l s - tools which are used to build CASE tools - solve this problem. There are two different kinds of meta-CASE systems. The first type offers a predefined set of supported notations which can be used. System like this are e.g. Toolframe [DK95] and Paradigm+ [P94].
Generators of CASE tools fit into the second category. They offer the pos- sibility to produce completely new CASE tools. Metaview [Fi94] and MetaEdit [KLR96] are examples of this approach. In Koblenz, the meta-CASE system
K O G G E [EC94][Me94] (KOblenz Generator for Graphical design Environments)
has been developed to generate CASE tools which support visual languages and methods. Main objectives are adaptability and flexibility based on a declarative and graph-based approach.
In this paper the meta-CASE system KOGGE will be described. In order to illustrate the KOGGE approach it will be shown how KOGGE was used to implement a CASE tool supporting the object-oriented method BON.
The paper is organized as follows: Section 2 sketches BON and the generated tool BONsai. The ideas of KOGGE and the construction process of a CASE
tool axe subject of Section 3. Section 4 focusses on aspects of adaptability, and Section 5 contains some concluding remarks.
2 B O N a n d B O N s a i
In early 1995 the University of D o r t m u n d was looking for a CASE tool which supported the Business Object Notation (BON). BON had been chosen to be used in a six-weeks software lab [B93]. Since such a lab has certain requirements with regard to a CASE tool and the m e t h o d chosen was quite new, no appropriate tool for BON was found on the market.
Therefore, it was decided to use the meta-CASE system K O G G E to generate the tool needed. In less t h a n three months a specially designed tool - named BONsai - was specified and tested. The first version was sucessfully used in the fall of 1995. At present, the third version of BONsai is being employed and it will be used with further extensions in 1997.
To introduce the way K O G G E tools work, a short description of the BON m e t h o d is followed by a presentation of how the tools for BON - BONsai I, BONsai II and BONsai I I I - support the method.
2.1 B O N
The object-oriented m e t h o d BON ([WN95]) by Kim Walden and Jean-Marc Nerson was influenced by the Eiffel school of thought. BON is guided by three main principles - seamlessness, reversibility and software contracting. Seamless- ness and reversibility refer to the possibility of seamless transition from problem domain requirements, via system design to executable code, and vice versa. Soft- ware contracting reflects the development of software as a series of documented decisions which are realized by assertions. Assertions are expressed by pre- and postconditions for single operations or by invariants for all operations of a class.
T h e main visual elements of BON are clusters, classes and relationships. A cluster, which describes a group of related classes (or clusters, respectively), is represented graphically by a box with rounded corners and a class is represented graphically by an ellipse. T h e relationships are drawn as single or double lines with arrows. For each kind of relationship - inheritance, aggregation and asso- ciation - specific arrow symbols are used.
A BON specification consists of various kinds of documents: the static ar- chitecture, the class interlace and the charts. A static architecture is a diagram representing the class structure of a system which is a graph whose nodes are classes or clusters and whose arcs are relationships among them. A chart is an informal description of a class or a cluster whereas a class interface is a definition of a certain class describing its signature and its assertions.
2 . 2 B O N s a i
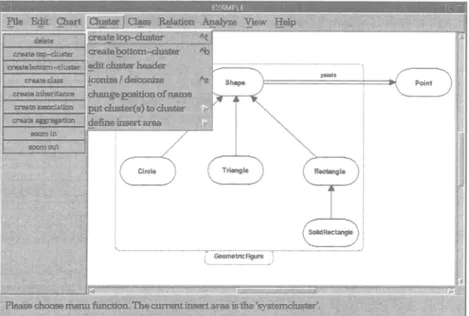
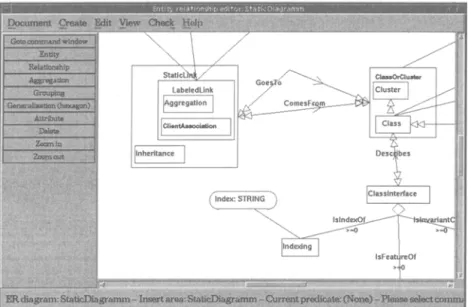
T h e CASE tool BONsai consists of editors for the static architecture, the class interfaces and the charts. Figure 1 shows the editor for the static architecture. It
offers the creation and deletion of the graphical items used, automatic drawing of relationships between the symbols and a number of supporting functions such as zooming, enabling a grid and different views of the system.
Fig. 1. Editor for the static architecture in BONsai III
But of course, BONsai is not only an editing facility for the most important document types of the BON method as described above. Additionally, it supports the user in the process of creating correct models according to BON through
explicit and implicit constraints.
Explicit contraints are tests that the user directly invokes by choosing the corresponding menu item whereas implicit contraints are permanently checked (and enforced) by the tool. An example for the latter is single inheritance which is mandatory in BONsai III. It supports this constraint by prohibiting the cre- ation of an inheritance relation which would result into a model with multiple inheritance. On the other hand, checking the properties of the root class - the starting class of a model- is implemented as an explicit constraint.
In Dortmund, BONsai is integrated into a software development environment which covers the whole development cycle. Thus, in addition to support the user in the modeling process BONsai also offers the generation of code. Although the preferred language for BON is Eiffel [M93], the code generated by BONsai is not restricted to a single target language. Content of the models is translated into a textual language which can be transformed into code frames of different programming languages. In BONsai I this was Eiffel while BONsai II and III generate code frames for BETA [DD96].
3 K O G G E
K O G G E ' s aim is to support the generation of tools for visual languages such as BON. K O G G E tools have also been generated for dataflow diagrams, entity relationship diagrams, state charts and others.
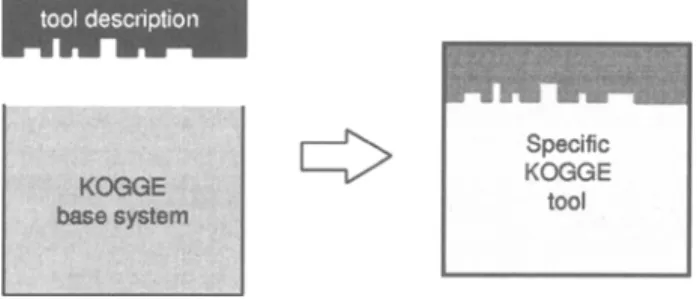
T h e basic idea is the following: instead of programming every single tool for all different methods, there is one b a s e s y s t e m - which is the same for all tools - and a specific t o o l d e s c r i p t i o n - which is unique. T h e tool description is interpreted by the base system, so t h a t the combination of b o t h of them results in a concrete tool. From the user's point of view the separation of the tool description from the base system is not visible. T h e users of a CASE tool generated with K O G G E just start one system.
T h e idea of ' t a b l e - d r i v e n ' tools is well-known from various areas such as compiler-construction [ASU86].
Fig. 2. Structure of KOGGE tools
Using K O G G E in the development of BONsai meant: a suitable tool description had to be constructed. Like any other K O G G E tool BONsai works as shown in Figure 2. The description for BON is interpreted by the base system, a screenshot of the resulting system was already shown in Figure 1.
At first (Section 3.1) we are going to describe how a tool description - actually the one for BONsai - is specified. This is done using another K O G G E tool called U r K O G G E . In contrast to constructing such a tool description for every new CASE tool, the base system (Section 3.2) is always the same. Section 3.3 explains the U r K O G G E in more detail and the connection to the generator concept mentioned above.
3.1 Tool Description
A K O G G E tool description always consists of three parts, describing 1. the concepts of the method,
2. the structure of the menus, and 3. the interaction with the user.
The first item defines the structure of the repository, whereas the tool's be- havior is determined by the interactions with the user connected to the menus.
There are specific editors for all of the three components.
3.1.1 D e s c r i b i n g t h e C o n c e p t s . Describing the concepts 1 of a method, or strictly speaking the concepts of its visual languages, means to describe what concepts are used, how they are combined and what context conditions must be preserved. In other words, the abstract syntax of the visual languages must be formalized.
In order to do this, one needs a formal basis to model and to implement the abstract syntax. In KOGGE, TGraphs [EF94] are used for this purpose which are the basis for the EER/GRAL approach of modeling and implementation with graphs comprehensively described in lEWD+96] and [CEW95]. Here, graph classes - which are sets of graphs - can be defined by extended entity relationship (EER) descriptions which are annotated by integrity conditions expressed in the constraint language GRAL (GRAph specification Language).
The E E R / G R A L descriptions define the set of correct syntax graphs in the sense of the method, for example the set of correct BON models. This descrip- tion is called a metamodel. This term refers to the fact that instances of this model are models themselves.
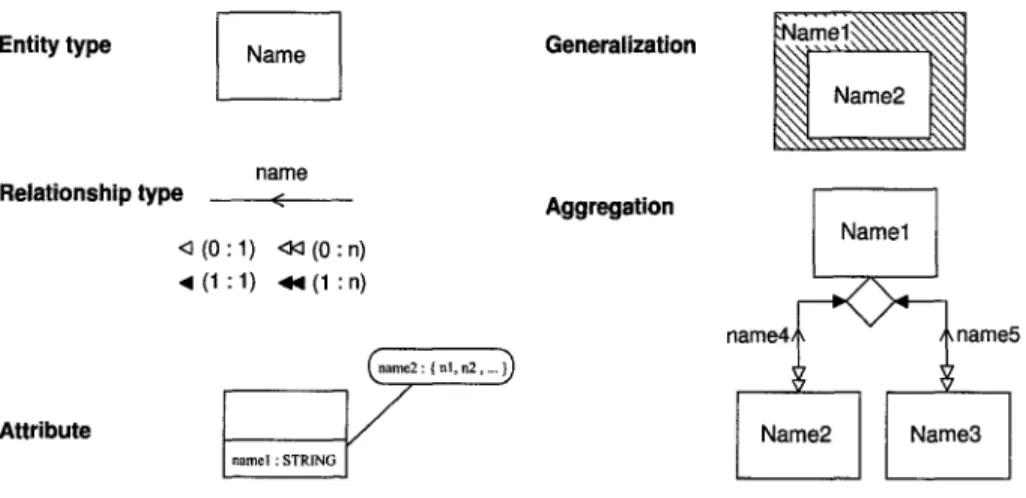
E E R . An EER description uses five different building blocks for formalization - entity types, relationship types, attributes, generalizations, and aggregations.
Figure 3 shows the corresponding graphical representation.
Entity type Name I Generalization
Relationship type
Attribute
name
<
< (0:1) <:~ (0 : n)
<1(1:1) ,~1 (1 : n)
name2 : { hi, n2, ...}~
r /
n a ~ l : STRING 1
Aggregation
Name1
n a m e 4 ~ name5
Name2 Name3
Fig. 3. EER building blocks
Regarding the underlying graph approach an entity type defines a set of vertices whereas a relationship type defines a set of edges. An attribute adds additional
1 Classes and clusters are examples for concepts in BON.
information to vertices or edges. Generalization defines a hierarchy between ver- tex types whereas aggregation can be chosen to add structural information 2.
G R A L . T h e Z-like [$92] assertion language G R A L is used to denote those integrity conditions which cannot be expressed by the E E R descriptions. These m a y be constraints on the values of the attributes of vertices and edges, the ex- istence or non-existence of a certain p a t h in a graph, the cardinality restrictions of vertex sets depending on attribute values, etc.
A GRAL assertion is a sequence of predicates which directly refer to the cor- responding E E R description. T h e syntax and the semantics of G R A L is formally described in [F97]. G R A L predicates can be tested efficiently.
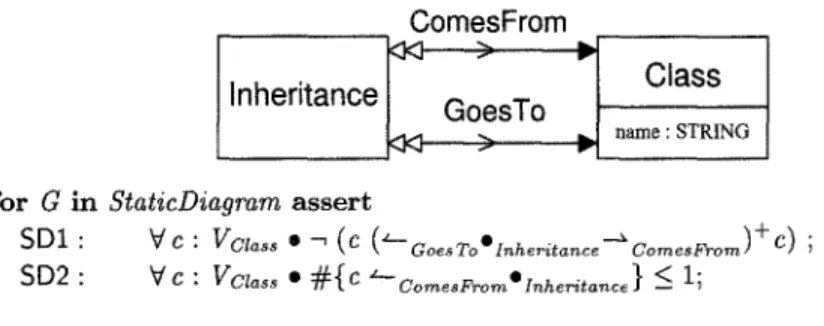
Here, we do not describe GRAL in detail but Figure 4 gives an example in the context of the BON method.
ComesFrom > ~.r
Inheritance~~ Go~sTo~
Classn a m e : S T R I N G
for G in StaticDiagram a s s e r t
SDI
: V c : Vot,~ * -~ (c (=-Go~.To'Z.h..it . . . . --~o . . . . F,~om) +c) ;SD2
:V
c : Vcta,, " ~ { c ="o . . . . F~'o~%,~h~t .... } <__ 1;Fig. 4. Example: Part of the EER/GRAL description of BONsai II/III
Inheritance
and Class are concepts used in the BON method. A class can be related to zero or more inheritance relations whereas an inheritance relation must relate to exactly one start class and one end class. This is modeled by the ComesFrom and the GoesTo relationship and the corresponding cardinalities. Ad- ditionally, the constraint t h a t no circles exist in the inheritance hierarchy must be preserved, i.e. constructions like 'class A inherits from class B which inherits from class A' are not allowed in a BON model. This is expressed by the G R A L predicate SD1 below the E E R description. SD2 prohibits the creation of multiple inheritance.E d i t o r s . T h e E E R / G R A L approach is the theoretical background to define the metamodel. To edit E E R / G R A L descriptions for the concepts of a m e t h o d two tools are used: A visual E R E d i t o r and a text editor f o r G R A L predicates. T h e screenshot presented in Figure 5 gives an impression which shows a part of the metamodel of BON. One can recognize the GoesTo and ComesFrom relationships of the small example above. T h e C l a s s and I n h e r i t a n c e entity types are con- 2 Note that these elements axe used in the BON metamodel, part of it is shown in
Figure 5.
Fig. 5. ER editor with a part of the metamodel for BON
nected to t h e m by their generalizations C l a s s 0 r C l u s t e r and S t a t i c L i n k . T h e G R A L predicates are edited by a separate text editor which is not presented here. Like all K O G G E tools the graphical editor supports the tool builder in dif- ferent ways: It supplies the graphical symbols; it supports a u t o m a t i c drawing of relationships between entity types; it makes grids, overviews and zooming func- tions available; it checks the syntactical conditions of E E R descriptions. This allows a comfortable and easy production of a m e t a m o d e l 3.
3 . 1 . 2 D e s c r i b i n g t h e M e n u s . In addition to describing the concepts of the m e t h o d it is necessary to define the menu structure of the tool for a specific m e t h o d . In K O G G E a (fairly simple) visual language is used in order to define the m e n u structure.
T h e m e n u structure is a directed acyclic g r a p h (dag). T h e r e are different types of nodes for m e n u s and m e n u i t e m s and two special nodes: root and panel.
Menu items or submenus are subordinated to one (or possibly multiple) menus by edges called connectors. Menus which are not submenus of any other m e n u have to be connected to root which serves as the parent of all menus on the t o p level. Menu items can - in addition to being connected to a m e n u - also be connected to the panel node which has the same function as t o o l b a r b u t t o n s in other tools and can be seen in the left p a r t of the screenshots. And finally, menu 3 Note that Figure 5 is also a screenshot of a KOGGE tool. Thus, a KOGGE tool is used for editing tool descriptions for KOGGE tools as described in Section 3.3 in more detail.
items have a few properties such as being enabled/disabled which can be set.
E d i t o r . T h e creation of menus is also s u p p o r t e d by an editor which offers operations to create, delete and edit all relevant items. Being a K O G G E editor, it provides the same supporting operations like different views etc. as the other editors (Section 3.1.1 and 3.1.3).
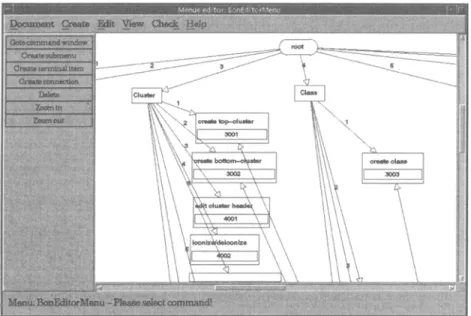
Fig. 6. Menu editor with a part of the cluster and class menu
Figure 6 shows a p a r t of the cluster menu. T h e c l u s t e r menu (Figure 1) contains the m e n u items create top-cluster, create bottom-cluster, edit cluster header, iconize/deiconize etc. Create top-cluster and create bottom- cluster were also linked to the panel since they are frequently used operations.
T h e numbers, e.g. 3001, accompanying the m e n u items correspond to events in the state charts which are described in the next section.
3 . 1 . 3 Describing the I n t e r a c t i o n s . T h e interactions between user and tool and the behavior depending on these interactions are described by s t a t e charts [H87], A state chart is a graph whose nodes are - possibly c o m p o u n d - states a n d whose edges are transitions labeled with events and actions. In addition to s t a t e transition diagrams state charts possess a hierarchy which is obtained by superstates nesting other states; concurrency and broadcasting are further extensions of state charts.
T h e tool is always in a certain state, a state change is caused by an event triggering an action. In K O G G E events are defined by the m e n u items in the
menu structure or are self-defined. Actions can be described by procedures which are written in a macro language called KOGGE-Modula. This macro language is similar to the programming language Modula-2 ([W85]) and allows an imperative programming style including the definition and evaluation of GRAL predicates.
Additionally, the language is supported by a library that includes often used actions like file operations, a library of graphical symbols and graphical utility functions. State charts and KOGGE-Modula procedures can only manipulate the graph within the limits set by the EER/GRAL description.
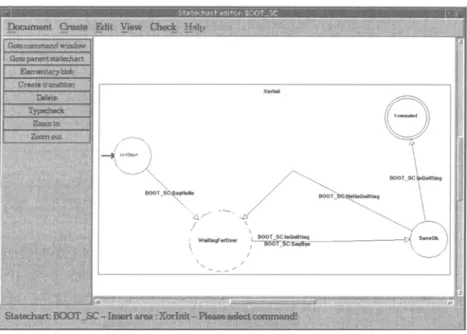
E d i t o r s . There is a graphical editor for state charts as well. This editor pro- vides the tool builder with functionality in order to produce the state charts for the tool. It works similar to the other UrKOGGE editors. Additionally, the consistency of the state charts is checked, for example, that at most one start state exists in a superstate. Figure 7 presents the top level of the state charts used in BONsai.
Fig. 7. State chart editor with the top-level state chart of BONsai
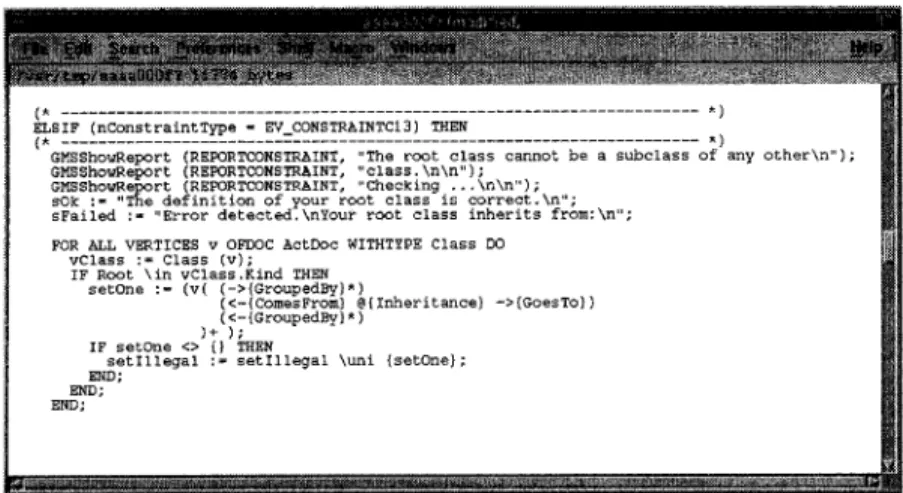
In order to produce the procedures in KOGGE-Modula a simple text editor is given by default or one can use other text editors which are available for the UNIX system (like NEdit shown in Figure 8). The figure also gives an impres- sion of what KOGGE-Modula procedures look like. The small procedure inside checks that the root class is not subclass of any other class (Section 2.2).
(,~ . . . * ) ELSIF (nConstraintType - EV_CONSTR&INTCI3) THEN
{, ... *)
GMSShowRepo~t (REPORTCONSTRAIHT, "The root class cannot be a subclass of any other\n");
G M S S h o ~ e p o r t (HEPORTCONSTRAINT, "class. \n\n") ; GM~Sho%~eport (REPORTCONSTR&INT, "Checking ...\n\n');
sOk := "The definition of your root class is correct.\n";
sEailed :- "Error detected.\nYou~ re*gt class inherits from:\n";
FOR ALL VERTICES v OFDOC ActDoc WITHTYPE Class DO vClass := Class (v);
IF Rcot kin vClass.Kind T H ~ setOne :- ( v ( ( - > { G r o u p e d B y } * )
(<-{ComesFrom} @{Inheritance) ->[GoesTo} ) (<-{GroupedBy} * )
) + );
IF setone <> {} THEN
setIllegal := setIllegal \uni {setone};
END;
END;
ENDS
Fig. 8. A KOGGE-Modula procedure for BONsai 3.2 B a s e S y s t e m
The base system is the static part of the KOGGE system (Figure 2). It does not need to be changed or enhanced in the process of specifying a specific KOGGE tool. The base system can be divided in two parts: the interpreters and the graphical modules.
The interpreters [C96] are needed to interpret the tool description and thus produce the specific tool. Corresponding to the tool description there are three interpreters: the ER interpreter, the menu interpreter and the state chart inter- preter. The ER interpreter is used to preserve the consistency of the tool with respect to its EER/GRAL description. The menu interpreter takes care of as- sembling the menus and the windows of the tool. And the state chart interpreter controls the tool depending on the underlying state chart descriptions and the user actions.
The functions of the graphical modules {Me95] are used to visualize the tool and its components. They offer the user interface including components such as dialog boxes, file selection boxes etc. on the one hand and on the other hand they provide a library of symbols like circles, rectangles and lines which can be used.
The kernel of the graphical modules is VarioCAD [DRB93] which is originally a CAD system. In addition to graphical functions such as zooming and alignment the graphical modules also provide operations which preserve the structure of the presentation. For example, a symbol which is logically positioned inside another symbol is moved simultaneously with the outer symbol.
The base system is implemented in C + + , employs X-Windows and is cur- rently available for Solaris, SunOS and Linux.
3.3 U r K O G G E and B o o t s t r a p p i n g
In Section 3.1 we demonstrated how a CASE tool description for BON was pro- duced using the three editors: ER editor, state chart editor and menu editor.
These three editors are also K O G G E editors and are parts of the tool called UrKOGGE. U r K O G G E is a K O G G E tool itself, t h a t means it consists of a tool description and the base system as any other K O G G E tool. T h e r e is only one dif- ference: instead of manipulating models of a certain CASE method, U r K O G G E manipulates tool descriptions, for example the BONsai description as shown in Figure 9.
Fig. 9. Using the UrKOGGE
In U r K O G G E , tool descriptions are normal data, both are handled in the same way. This is possible due to the underlying structure which allows a unifying mapping of all information to a single representation - namely graphs. Graphs are created, stored and manipulated using the G r a L a b software, a C + + class library for graph-based software development [DEL95].
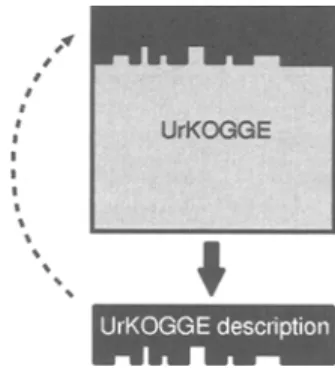
As a m a t t e r of fact, the tool description for the U r K O G G E can be edited in exactly the same way as the BONsai description. Of course, the very first version of the U r K O G G E description had to be generated from a text document. This r u d i m e n t a r y version is on the one hand used to control the base system, and on the other hand it can be loaded as d a t a which can be manipulated (as shown in Figure 10).
Fig. 10. Bootstrapping of the UrKOGGE
T h e person who is specifying the tool can enhance the data - the U r K O G G E de- scription - and add further functions to it. This modified U r K O G G E description can then be used as a new controling tool description. This process of enhancing
and improving the UrKOGGE description can be iterated.
Summing up, one can say this strategy of being able to manipulate/modify/
enhance the UrKOGGE specification in the same manner as the tool descriptions for other tools has several advantages. The main advantage is that we can change the UrKOGGE easily without having effects on other existing KOGGE tools.
4 A d a p t a b i l i t y
The use of CASE tools in the past, or the disappointment about the use of CASE tools in practice, has shown that flexibility and adaptability are very important qualities of any of these systems. There is a growing need for CASE tools to be adjusted to specific contexts, dialects of methods and changing requirements, to name just a few aspects. The specification of the CASE tool and its functionality, like it is done in KOGGE, makes it easy to meet these requirements which we will illustrate by a few more examples from the CASE tool BONsai.
The context or the situation for which a tool is used is important for the design of this tool. Since the department of computer science in Dortmund needed a CASE tool for a six-weeks software lab it was important that the resulting tool was simple enough that it could be learned easily, yet it had to have all the functionality to serve its purpose. The circumstances in which the tool was to be used lead to other customized features. For example, the tool should not have an open f i l e - m e n u item since the tool is embedded in a special environment.
CASE tools are subject to changing requirements. When a system is used practically, one finds out which parts are really used and necessary and which further functionality has possibly to be added. BONsai I, for example, allows multiple inheritance, while BONsai II and III only permit single inheritance.
This was due to the fact that Eiffel code was generate in the first version and BETA in the further ones.
Most methods used nowadays are not exhaustively explained or even inconsis- tent. Thus, people building tools have to make decisions what certain concepts really mean. Our approach makes it easy to change these interpretations of method features in case they were wrong or not useful.
The ability of adaptability was a main objective in designing KOGGE. A KOGGE tool is generated by a mostly declarative description in place of opera- tional programming. This declarative style leads to a higher level of abstraction which makes adaptability easy. For example, the shifting from multiple to sin- gle inheritance was achieved only by adding the second constraint SD2, already shown in figure 4, to the EER/GRAL description for BONsai I:
No further modifications were needed.
5 C o n c l u s i o n
Meta-CASE tools are needed to generate problem and context specific CASE tools. Our approach to meta-CASE - the system KOGGE - is suited to meet this
demand because it is formally well-founded and was sucessfully used in practice (each of the three versions of BONsai was used by 80-100 students). BONsai is not the only CASE tool specified, we also have one for dataflow diagrams [D96], the U r K O G G E itself and a tool to support the evaluation of software is under construction.
Note t h a t we did not describe how one can produce metamodels for the lan- guages used in these tools. This is a different research area which needs profound discussions, examples are given in [ES97] und [SE97].
All in all one can say t h a t generating CASE tools with K O G G E can - due to the high abstraction level of the description - be achieved in a short amount of time and the resulting tools can be modified easily as shown in the previous sections. Moreover the tool to specify other CASE tools itself can be changed since its tool control can be manipulated in the same manner. This flexibility is achieved because graphs are used for either one: for tool descriptions and for d a t a representation. At last, CASE tools developed with K O G G E all have a common look and feel because they all rely on the same base system.
But even though K O G G E tools have been used in practice, there is still a lot of room for improvement. As a research prototype K O G G E has always been focused to certain research areas. Thus, it does not support some important features for large scale applications, like multi-user facilities and version man- agement, but concentrates mainly on adaptability in a single user environment.
As the BONsai experience shows, K O G G E works quite well with regard to this.
A c k n o w l e d g m e n t : The authors express their thanks to Manfred Rosendahl for supervising the development of the graphical modules, the crew in the com- puter science department in Dortmund especially Thomas Biedassek, the former project members Martin Carstensen and Albrecht Meit~ner and numerous stu- dents for their work for the project and Angelika Franzke for thoroughly revising the paper.
References
[ASU86] Aho, A. V.; Sethi, R.; Ullman, J. D.; Compilers. Principles, Techniques and Tools. Reading, Massachusetts: Addison-Wesley, 1986.
[B93] Biedassek, T.; Software in der Ausbildung. Projekt OPHELIA fiir die Ausbildung in Software-Technik. In: UNIX-open - Reihe Praxis, 8/93, S. 76.
[C96] Carstensen, M.; Konzept eines CASE-Generators fiir CASE-Umgebungen.
Koblenz: erscheint als Dissertation, 1996.
[CEW95] Carstensen, M.; Ebert, J.; Winter, A.; Entity-Relationship-Diagramme und Graphklassen. Koblenz: Universit~it Koblenz-Landau, erscheint als Fachbericht Informatik, 1996.
[DK95] D~beritz D., Kelter, U.; Rapid Prototyping of Graphical Editors in an Open SDE. In: Proc. 7th Conference on Software Engineering Environments (SEE '95), p. 61-72. Noordwijkerhout: IEEE Computer Society Press, 1995.
[DEL95] Dahm, P.; Ebert, J.; Litauer, C.; Das EMS-Graphenlabor V3.O. Koblenz: Uni- versit~it Koblenz-Landau, Projektbericht, 1995.
[DD96] Doberkat, E.-E.; Dissmann, S.; Einfiihrung in die Programmierung mit BETA.
Bonn: Addison-Wesley, 1996.
[D96] Driike, M.; Dokumentation fiir den Datenflufldiagramm-Editor. Koblenz: Uni- versits Koblenz-Landau, Institut fiir Softwaretechnik, Studienarbeit, 1996.
[DRB93] Du, C.; Rosendahl, M.; Berling, R.; Variation of Geometry and Paramet- ric Design. In: Tang, Z. fEd.I; Proc. 3rd. International Conference on CAD and Computer Graphics, Aug. 23-26, 1993, p. 400-405. Beijing: International Aca- demic Publishers, 1993.
[EC94] Ebert, J.; Carstensen, M.; Ansatz und Architektur yon KOGGE. Koblenz: Uni- versit~t Koblenz-Landau, Institut fiir Softwaretechnik, Interner Projektbericht 2/94, 1994.
lEWD+96] Ebert, J.; Winter, A.; Dahm, P.; Franzke, A.; Siittenbach, R.; Graph Based Modeling and Implementation with E E R / G R A L . In: B. Thalheim fEd.];
Proc. 15th International Conference on Conceptual Modeling (ER'96), LNCS 1157. Berlin: Springer, 1996.
[EF94] Ebert, J.; Franzke, A.~ A Declarative Approach to Graph Based Modeling. In:
Mayr, E.; Schmidt, G.; Tinhofer, G. [Eds.]; Graphtheoretic Concepts in Computer Science, LNCS 903, p. 38-50. Berlin: Springer, 1995.
[ES97] Ebert, J.; Siittenbach, R.; An O M T Metamodel. Koblenz: Universit~it Koblenz- Landau, erscheint als Fachbericht Informatik, 1997.
[Fi94] Findeisen, P.; The Metaview System. Edmonton: Department of Computing Science, University of Alberta, 1994.
[F97] Franzke, A.; GRAL 2.0: A Reference Manual. Koblenz: Universit~it Koblenz- Landau, Fachbericht Informatik 3/97, 1997.
[H87] Harel, D.; Statecharts: a visual formalism for complex systems. Science of Com- puter Programming 8 (1987, 3), p. 231-274.
[KLR96] Kelly, S.; Lyytinen, K.; Rossi, M.; MetaEdit+: A Fully Configurable Multi- User and Multi-Tool CASE and CAME Environment. In: Constantopoulos, P.;
Mylopoulos, J.; Vassiliou, Y. [Eds.]; Advanced Information System Engineering, LNCS 1080. Berlin: Springer, 1996.
[KU95] KSlzer, A.; Uhe, I.; Benutzerhandbuch fiir das KOGGE-Tool BONsai III.
Koblenz: Universit~t Koblenz-Landau, Institut fiir Softwaretechnik, Interner Pro- jektbericht 4/96, 1996.
[Me94] Meii]ner, A.; Die PrSsentationskomponente yon KOGGE. Koblenz: Universitiit Koblenz-Landau, Institut fiir Softwaretechnik, Interner Projektbericht 1/94, 1994.
[Me95] Meifiner, A.; G R A B E - Eine objekt-orientierte Sprache zur Spezifikation yon Symbolen in interaktiven graphischen Editoren. Koblenz: FSlbach, 1995.
[M93] Meyer, B.; Eiffel - the language. New York: Prentice Hall, 1993.
[P94] ProtoSoft Inc. Paradigm +/Cadre Edition Reference Manual. Providence: Pro- tosoft, 1994.
[$92] Spivey, J. M.; The Z Notation. A Reference Manual. Prentice Hall: Hemel Hemp- stead, 19922 .
[SE97] Siittenbach, R.; Ebert, J.; A Booch Metamodel. Koblenz: Universit~t Koblenz- Landau, Fachbericht Informatik 5/97 , 1997.
[WN95] Walden, K.; Nerson, J.-M.; Seamless Object-Oriented Software Architecture.
Analysis and Design of Reliable Systems. Englewood Cliffs: Prentice Hall, 1995.
[W85] Wirth, N.; Programming in Modula-2. Berlin: Springer, 1985 ~.