Nepal
Trade and Competitiveness Study
A Study conducted as part of the Integrated Framework for Trade- Related Technical Assistance
Oct 22, 2003
33793
Public Disclosure AuthorizedPublic Disclosure AuthorizedPublic Disclosure AuthorizedPublic Disclosure Authorized
GOVERNMENT FISCAL YEAR July 15 – June 14; FY 03 = 2002-03
CURRENCY EQUIVALENTS Currency Unit NRs; US$1 = 78.64 ACRONYMS AND ABBREVIATIONS
ACAP Annapurna Conservation Area Project MW Megawatts
ADB Asian Development Bank NEA Nepal Electricity Authority
APP Agricultural Perspective Plan NGO Non-Governmental Organization
ASEAN Association of South East Asian Nations NLSS Nepal Living Standards Survey ASYCUDA Automated Systems for Customs Data NPC National Planning Commission AOTA Advisory and Operational Technical Assistance NRB Nepal Rastra Bank
ATC Agreement on Trade and Clothing NRs Nepali Rupees
BOI Board of Investment NTB Nepal Tourism Board
BOOT Build-own-operate-transfer NTPC National Thermal Power Corporation (India)
BOT Build-operate-transfer NTSC Nepal Trade and Competitiveness Study
BPC Butwal Power Company ODC Other Duties and Charges
CAAN Civil Aviation Authority of Nepal OECD Organization for Economic Cooperation and Development
DDC District Development Committee OPEC Organization of Petroleum Exporting Countries DFID Department of International Development, U.K OWC One Window Committee
DOC Department of Customs PATA Pacific Asia Travel Association
DOED Department of Electricity Development PEA Post Entry Audit DOLIDAR Department of Local Infrastructure Development and
Agricultural Roads
PEV Post Entry Verification
DOR Department of Roads PRC People’s Republic of China
EDIFACT Electronic Data Interchange for Administration, Commerce and Transport (UN System)
PSI Pre-Shipment Inspection
EPB Export Promotion Bureau PTC Power Trading Corporation (India)
ERR Economic Rate of Return RMRP Road Maintenance and Rehabilitation Project
FDI Foreign Direct Investment RNAC Royal Nepal Airlines Corporation
FNCCI Federation of Nepalese Chambers of Commerce &
Industry RUPP
Rural Urban Partnership Program
FNCSI Federation of Nepal Cottage and Small Industry SAARC South Asian Association for Regional Cooperation FY Fiscal year ending 15 July of the year specified SARI/E South Asian Regional Initiative for Energy
Cooperation and Development
GDP Gross Domestic Product SASEC South Asian Sub-regional Economic Cooperation GEFONT General Federation of Nepalis Trade Unions SEB State Electricity Boards (India)
GWhr Gigawatt hours SME Small and Medium Sized Enterprises
HDP Hydropower Development Policy SPS Sanitary and Phytosanitary Measures HMGN His Majesty’s Government of Nepal SNV Netherlands Development Organization HMIS Highway Management Information System Unit TA Technical Assistance
ICD Inland Container Depot TANN Trekking Association of Nepal
IDA International Development Association TBT Technical Barriers to Trade
IF Integrated Framework TC Transit Country
IMF International Monetary Fund TPC Trade Promotion Centre
IPP Independent Power Producer TRIPS Trade-related Intellectual Property Rights ITC International Trading Centre TRPAP Tourism for Rural Poverty Alleviation Program
kV Kilovolts UNCHS United Nations Center for Human Settlements
LC Letter of Credit UNCTAD United Nations Conference on Trade and Development
LLC Landlocked Country UNDP United Nations Development Program
MFA Multifibre Arrangement VDC Village Development Committee
MFN Most Favored Nations WECS Water and Energy Commission Secretariat
MOT Ministry of Transport WCO World Customs Organization
MPPW Ministry of Physical Planning and Works WTO World Trade Organization
MTEF Medium-Term Expenditure Framework WB World Bank
TABLE OF CONTENTS
PREFACE i
EXECUTIVE SUMMARY I
1. COUNTRY BACKGROUND 1
1.1 Economic Structure and Performance 1
1.2 Poverty and Its Determinants 2
1.3 Macroeconomic Performance and Reforms 3
1.4 Current Macroeconomic Environment and Recent Developments 4
1.5 Outlook for Macroeconomic Management 7
1.6 Organization of this Study 7
2. NEPAL’S TRADE REGIME AND PERFORMANCE 8
2.1 Performance and Structure of International Trade 8
2.2 Unrecorded (Informal) Trade 15
2.3 Trade Reforms and Current Trade Regime 17
2.4 Pattern of Incentives in Nepal 21
2.5 Implications of the Tariff Structure of WTO Bindings 22
2.6 Export Incentives and Administration 23
2.7 Strategy for Technical Assistance 24
2.8 Recommendations 27
3. NEPAL’S ACCESSION TO THE WORLD TRADE ORGANIZATION 28
3.1 What Does WTO Membership Offer Nepal? 29
3.2 WTO Accession Negotiations and the Implications of WTO Commitments 31 3.3 Implementation of Trade-related Regulatory Reforms 34
3.4 Conclusions and Recommendations 39
4. PRICE COMPETITIVENESS AND PRODUCTIVITY 41
4.1 Introduction 41
4.2 Defining Competitiveness and Comparative Advantage 41 4.3 Nepal’s Long-Term Competitiveness: Total Factor Productivity Trends and Determinants 44 4.4 Comparative Advantage and Competitiveness: Areas of Opportunity 48
4.5 Summary 51
5. FACILITATING TRADE: CUSTOMS AND TRANSPORT 52
5.1 Introduction 52
5.2 Governance 52
5.3 Infrastructure 55
5.4 Customs Procedures 56
5.5 Customs: Conclusions And Recommendations 60
5.6 Transport and Logistics 61
5.7 Analysis of Logistics Costs and Time 63
6. LABOR MARKETS IN NEPAL 67
6.1 Introduction 67
6.2 Labor Market Characteristics 67
6.3 Labor Market Policies and the Regulatory Framework 68 6.4 Options for Developing a More Flexible Labor Market 70
6.5 Education and Training 72
6.6 Implications for Actions 74
7. REGULATORY FRAMEWORK AND FOREIGN DIRECT INVESTMENT 75
7.1 Introduction 75
7.2 Legislative Framework for Investment 76
7.3 Business Approval Procedures and Lack of Government Coordination 77 7.4 Resource Mobility, Trade, Finance, and Exit Issues 79 7.5 Clarifying Laws, Regulations, and Bureaucratic Roles 80
7.6 Government-Business Collaboration 81
7.7 FDI’s Special Role and Restrictions 82
7.8 Investment and SME Issues 84
7.9 Conclusions and Recommendations 86
8. CASE STUDIES 87
8.1 Overview 87
8.2 Carpet Industry: Re-Invigorating a Stagnant Industry 89
8.3 Garments: Industry In Transition 91
8.4 Tea Processing Industry: Laying the Foundations for Future Growth 95
8.5 Agriculture 98
8.6 Tourism 101
8.7 Hydropower 105
9. TRADE AND POVERTY IN NEPAL: RESULTS OF A SIMULATION EXERCISE 108
9.1 Overview 108
9.2 Simulation Analyses 109
9.3 Formal Sector Growth and Employment Creation 110
9.4 Agriculture Sector and Growth of Transportation 111
9.5 Conclusions 114
REFERENCES 115
LIST OF FIGURES
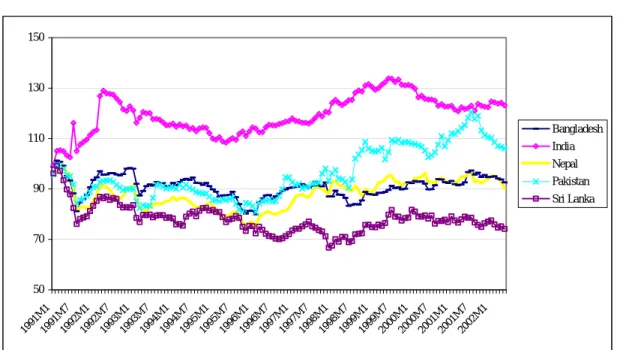
Figure 1.1 Real Effective Exchange Rates (REER), Nepal and South Asia 6
Figure 5.1 Comparison of Logistics Costs, by Route 65
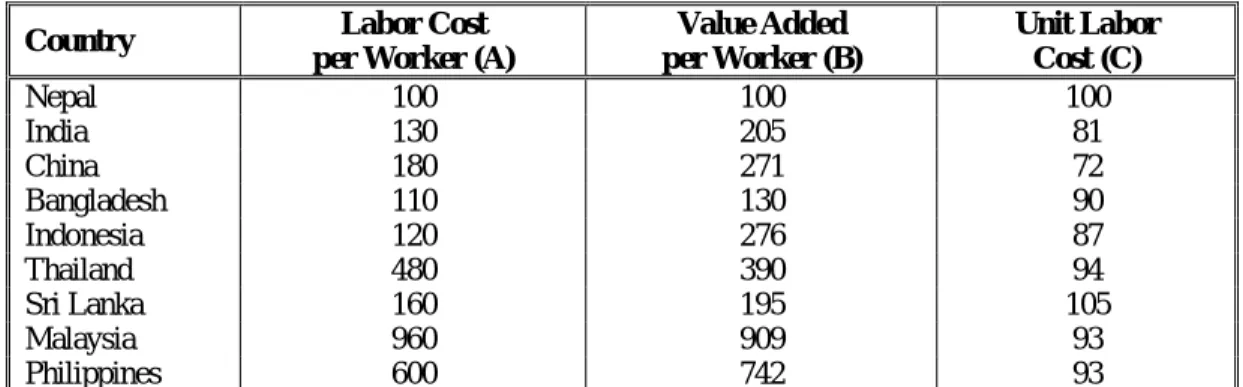
Figure 7.1 Low Government Effectiveness – Implementation Constraint 78 Figure 8.1 Composition of FOB Prices of Men’s Cotton Shirts 88 Figure 8.2 Potential 17% Reduction in Export (FOB) Price of Men’s Cotton Shirts after Improvements 88 Figure 8.3 Indicators of Labor Costs, Productivity, and Export Prices of Garments for Nepal, Relative to Key
Competitors 94
Figure 9.1 Sources of Household income for the poor, by region 108 LIST OF BOXES
Box 2.1 Nepal India Trade Agreement and the South Asian Association For Regional Cooperation (SAARC) 14
Box 2.2 Commodities by Tariff Band 20
Box 3.1 Glossary of WTO Terms 28
Box 3.2 ISO-9000 Certification: Provided by State or Market? 37
Box 5.1 Valuation Procedures 58
Box 6.1 Potential Model for a Contracts-based System 71
Box 6.2 Piloting Subsidized Access to Better Schools 73
Box 7.1 The Heritage Foundation Index: How To Improve Nepal’s Investment Score 76 Box 7.2 Case Study of an Enterprise in Limbo: No Exit Policy 79 Box 7.3 Foreign Investment in Small-scale Activities: Lessons From Indonesia 84
LIST OF TABLES
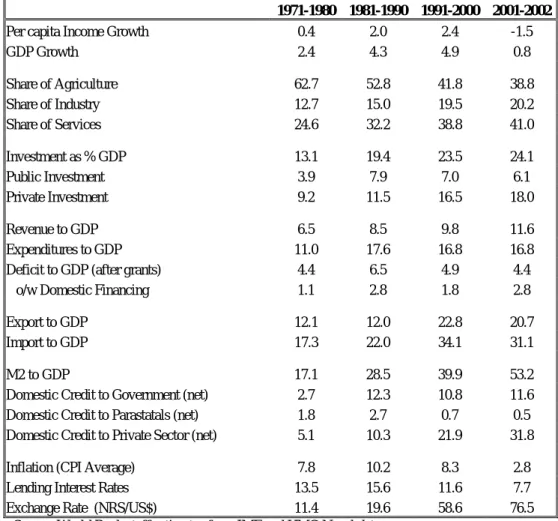
Table 1.1 Economic Performance Indicators ( Averages in % unless stated otherwise) 1
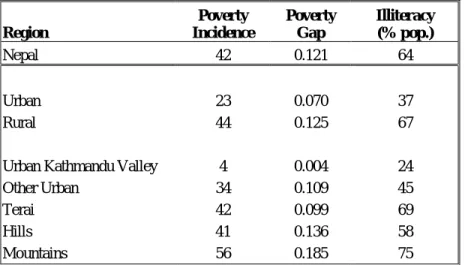
Table 1.2 Poverty Incidence by Region, 1995–1996 3
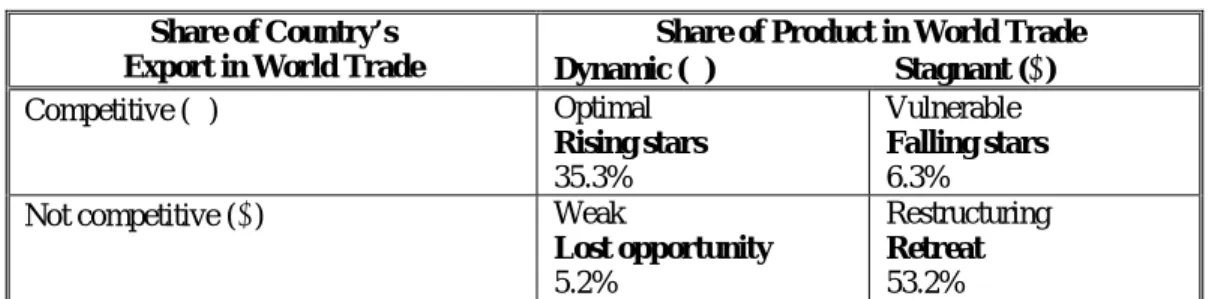
Table 2.1 Market Position of Nepal’s Exports, 1995–-1999 10 Table 2.2 Nepal’s Structure of Merchandise Imports and Exports 12
Table 2.3 Demand-Side Sources of Economic Growth 15
Table 2.4 Summary Estimates of Formal and Informal Trade Balance, 2000–2001 16 Table 2.5 Percent of Respondents (%) of Formal and Informal Traders Facing Varying Magnitude of Transaction
Costs in Indo-Nepal Trade 17
Table 2.6 Distribution of Tariff Rates 19
Table 2.7 India – Bound Rates and Applied Rates 23
Table 4.1 Index of Cost Competitiveness Indicators of Nine Asian Countries, 1999 42 Table 4.2 Nepal’s Annual Rate of Improvement in Unit Labor Cost , 1990-99 43 Table 4.3 Annual Percentage Change of Labor Costs and Labor Productivity of Eight Asian Countries 43 Table 4.4 Average Productivity in Manufacturing: Size and Sectors (Relative Unit) 45
Table 4.5 Comparative Infrastructure Indicators 46
Table 4.6 Comparative Infrastructure Costs 47
Table 4.7 Problems with Infrastructure Services 47
Table 4.8 Selected Export Products and Price-Margin Competitive Advantages 50 Table 4.9 Performance of Products with Comparative Advantage 50
Table 7.1 Foreign Direct Investment in Selected LLCs 82
Table 8.1 Estimated Earnings from Tourism in SASEC Countries 102 Table 9.1 Income Effects (%) of Employment Growth in Manufacturing (Low- vs. High-growth Scenario) 110 Table 9.2 Income Effect (%) in Households that Switch to Producing Marketable Crops 112 Table 9.3 Income Effects (%) of Growth on Employment in Transportation Sector 113 Table 9.4 Effect of 50% Reduction in Transportation Time on Agricultural Income (% Household Consumption,
Through Increased Fertilizer Use and Yields) 113
PREFACE
Following a request from His Majesty’s Government of Nepal (HMGN) in 2002, the Integrated Framework Working Group agreed to conduct a diagnostic trade integration study of Nepal as the first step in the Integrated Framework (IF) process of assisting Nepal with trade integration. The World Bank subsequently carried out this diagnostic Nepal Trade and Competitiveness Study on behalf of the IF Working Group, which consists of six agencies, (IMF, ITC, UNCTAD, UNDP, WTO and the World Bank), two donor representatives, an OECD-DAC observer and two LDC representatives. The World Bank also thanks the Department for International Development, U.K., the Lead Donor for the IF Work in Nepal, for providing assistance for this study.
This study is intended to aid policy makers, researchers, civil society stakeholders, and Nepal’s development partners to identify policy and technical assistance requirements for making the Nepalese economy more competitive and enabling it to get greater benefits from world trade.
Diagnostic trade integration studies balance the benefits of new research to support findings with the equally important task of systematically uncovering policy and capacity building requirements. Other goals are to stimulate debate and discussion on policy issues and identify policy areas that may require more in-depth work. This report contains a blend of detailed recommendations where these have been made possible by focusing on a particular bottleneck to trade where existing reforms need to be built upon (e.g. Customs reform) and broader suggestions designed to initiate further work required for policy development (e.g. labor market changes). As a diagnostic study aimed at assisting HMGN to produce practical, time bound policy initiatives with identified technical assistance needs to support them, this work has built on a series of relevant and recent studies undertaken in Nepal, often through support of other development partners.
The groundwork for this study was laid through a preliminary mission conducted in September 2002 and a full field mission in October 2002, during which consultants gathered data and conducted extensive interviews, including a small survey to supplement the larger FNCCI/World Bank survey of firms carried out in 1999.
The report was prepared by a team of international and national consultants, and by IMF and World Bank staff (see next page). Ahmad Ahsan was the Task Manager from the World Bank and Ross Chapman (from the Center for International Economics, Australia) led the team of consultants. This work was carried under the guidance of the Steering Committee for the Nepal Trade and Competitiveness Study (NTCS) appointed by HMGN. Comments were received from the Ministry of Industry, Commerce and Supply, Ministry of Finance, the National Planning Commission, Ministry of Labor and Transport Management, Department of Customs, Nepal Bureau of Standards and Metrology. The Steering Committee also included representatives from private sector bodies such as the Federation of Nepal Chamber Commerce and Industry (FNCCI), the Federation of Nepalese Cottage and Small Industries (FNCSI), Nepal Chamber of Commerce (NCC) and the Confederation of Nepalese Industries (CNI).
Valuable discussions were held with donor representatives such as ADB, DfID, the IMF, UNDP, and the USAID. The report has benefited from comments by peer reviewers (H. Shishido, IMF; and Kathie Krumm, World Bank), DfID staff, World Bank staff and management.
This report was discussed in the Nepal Trade and Competitiveness Study Conference held in Kathmandu on June 27, 2003 under the chairmanship of Dr. Shankar Sharma, Vice Chairman, National Planning Commission. The prioritized recommendations contained in the report and presented in the Policy and Technical Assistance matrix of the executive summary, reflect the comments made by the National
Steering Committee and other participants in that conference. A separate Volume on the Background Papers of the Nepal Trade and Competitiveness Study is also being prepared.
National Steering Committee
Chairman: Dinesh Chandra Pyakurel, Secretary, MOICS (Previous Chairmen and Secretaries: Bhanu Acharya, Lava K. Devacota). Members: Purushottam Ojha, Prachanda Man Shrestha (MOICS), Bidya Dhar Mallik (MoFinance), Ram Kumar Shrestha (NPC), Deependra Chhetri (NRB), Rajendra Khetan, Badri Ojha (FNCCI), Satish Moor (CNI) Basu Giri, Subarna Shrestha (FNCSI), Bala Ram Rajbhandari (NCC). Member-Secretary: Kailash Bajimaya, (MOICS). Advisor: Pushkar Bajracharya (Professor, Tribhuban University).
Study Team Members
Ross Chapman, (investment climate, tourism sector study), Tyler Biggs (price competitiveness of Nepali exports), Kelly Bird (manufacturing sector studies, trade and investment policy), Trent Bertrand (labor and land markets), Mike Watts (trade facilitation and transactions costs), Jim Robertson (trade policy and institutions), John Zerby (road transport, electric power and water sector studies); Local consultants: Binod Karmacharya (principal local consultant - trade performance, price competitiveness); Jagannath Adhikari (labor and land markets); Ramesh Chitrakar (investment impediments, tourism); Lokendra Kunwar (price competitiveness survey); Prakash Raj (tourism); Shiva Sharma ( labor and land markets); Rudra Suwal (price competitiveness survey); Ananda Shrestha (trade facilitation and transactions costs, road transport); Hari Man Shrestha (electric power and water); and Shanker Man Singh ( agricultural aspects of trade treaty); IMF: Hisanobo Shishido (Macroeconomic Update) World Bank staff: Ahmad Ahsan (Country Background and Price Competitiveness), Paul Brenton (Manufacturing Case Studies);
Burcu Duygan (poverty analysis); Forhad Shilpi (agriculture); Philip Schuler (WTO accession). Mr. Sujeev Sakhya, Visiting Humphrey Scholar at the World Bank provided valuable comments. Shahnaz Ahmed, Kiran Gautam, Lili-Anne Tabada and Sue Yukongdi helped to prepare the document in various stages.
i
EXECUTIVE SUMMARY
1. With a trade1 to GDP ratio of about 50%, an average tariff rate of 14%, and virtually no quantitative restrictions, Nepal is among South Asia’s most open and trade-dependent economies.
Despite its significant geographical constraints and policy and institutional weaknesses, Nepal has comparative advantage in a number of labor-intensive manufacturing and agricultural products. During the 1990s, these manufacturing exports grew (in U.S. dollar terms) at an average annual rate of 20%, compared to 15% overall export growth, though with considerable volatility.2 The share of certain products in world markets increased 2-10 times, reaching 7% in the case of carpets and 0.12% in the case of garments, while overall share in global exports doubled. The country’s potential for further trade growth remains high, as its share of exports in world markets is less than 0.02%. Also, while Nepal’s trade to GDP ratio is high by South Asian standards, the ratio in similarly sized economies is about 80%,3 indicating further potential for the country’s trade growth. Nepal’s proximity to large economies such as China and India also offers opportunities for trade.
Challenges to Trade Potential
2. Nepal’s geography is a major constraint to realizing its trade potential. It is a landlocked country of 23 million people, nestled in the southern slopes of the Himalayas, bordering China to the North and India in all other directions. Most of the country’s terrain is mountainous or hilly, with only 20% arable land. Nepal’s per capita income of US$250 in nominal terms or US$1,450 in purchasing power parity (PPP) terms makes the country one of the world’s poorest outside Sub-Saharan Africa, further constraining the development of domestic trade networks. Distance to the nearest port, located in India, is 660 miles. All of these factors make transport costs high, hinder the development of markets, raise the costs of expanding agriculture, and create near-complete dependence on India for transit routes.
3. As the sharp 18% decline in exports in the last fiscal year (FY 2002) suggests, Nepal faces numerous other challenges to realizing its export potential. The first set relates to the external economic environment. Nepal’s narrow export basket and a concentration of exports to only a few countries makes it susceptible to global economic volatility. A further challenge is posed by the forthcoming phasing out of the Multi-Fibre Arrangement (MFA) in 2005, whose quotas enabled significant growth of ready-made garments exports (28% of all exports in 2000). The second set relates to the Nepal’s close economic and trading relationship with India. Here, the new and more restrictive Nepal-India Trade Treaty of 2002 will slowdown Nepal’s manufacturing exports to India. In addition, uneven implementation and interpretation of the trade treaty measures by State Governments in India are imposing additional barriers to Nepal’s exports. Nepal will now need to focus more on exports to the large Indian market where it has true comparative advantage, including textiles and a variety of agricultural products. Third, Nepal also faces the challenge of its forthcoming integration into the World Trade Organization (WTO), which has to be met in a way that promotes its economic competitiveness. Finally, Nepal has to address its significant domestic or “behind-the-border” constraints of ineffective implementation and still pending regulatory constraints that lowers its productivity, makes its investment climate unfriendly and reduces its competitiveness.
1 Trade includes merchandise and non-factor services.
2 While exports fell steeply in FY 2001 and FY 2002 due to the global economic slowdown and domestic uncertainty and the more restrictive Indian trade treaty, exports to third countries have increased again in the current year. Garments exports, for instance are expected to increase by about 50%.
3 That is, countries with GDP of US$ 4-6 billion; examples include Azerbaijan, Estonia, Gabon, Honduras, and Yemen.
ii Study Goals and Findings
4. This study seeks to help Nepal address these challenges by analyzing its trade policies and performance, identifying constraints to increasing trade competitiveness, and recommending policy changes and technical assistance to remove these constraints. The study is timely, as Nepal’s draft Poverty Reduction Strategy Paper of 2003 assigns a key role to trade and exports as drivers of broad- based economic growth—one of the four main pillars of its strategy.
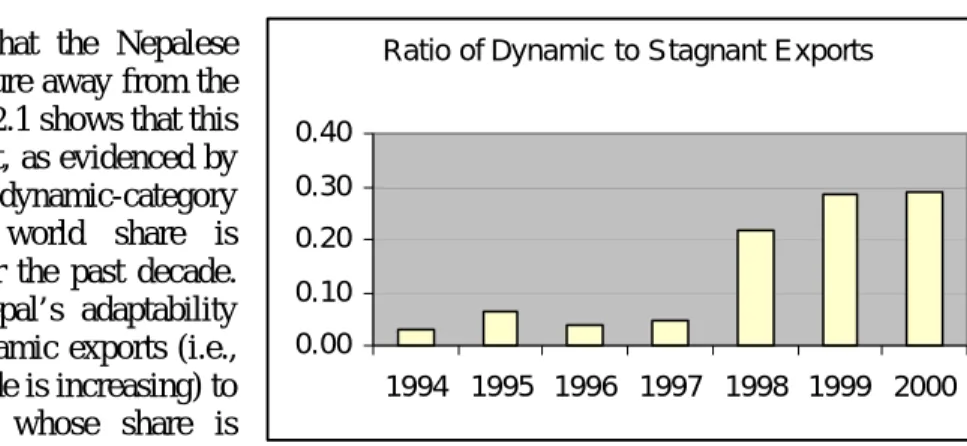
5. Key conclusions are that Nepal’s trade policies are generally sound, and the country is competitive in a variety of products. More than one-third of its export basket consists of “rising-star”
goods (ready-made garments, textiles, and jewelry), share in world trade and in Nepal’s exports are increasing. Minor reallocation of resources within Nepal’s garment and carpet sectors could bring more than 50% of its exports into this dynamic category.
6. These positive findings are tempered by constraints that make Nepal’s productivity among the lowest in the region, create an inhospitable business climate, and discourage foreign direct investment—a key conduit for export-market access and technology transfer. The most critical constraints are: i) delays in customs and transshipment to India’s Kolkata port; ii) high infrastructure costs, especially transport and power; iii) a rigid, formal labor market; and iv) weak policy and institutions in the areas of taxation, investment and trade promotion.
7. The Matrix at the end of this summary lists prioritized and sequenced policy recommendations and technical assistance requirements for overcoming these constraints. Case studies are also included in this report to show how Nepal can boost its trade competitiveness in six areas of comparative advantage.
Role of Trade in Nepal
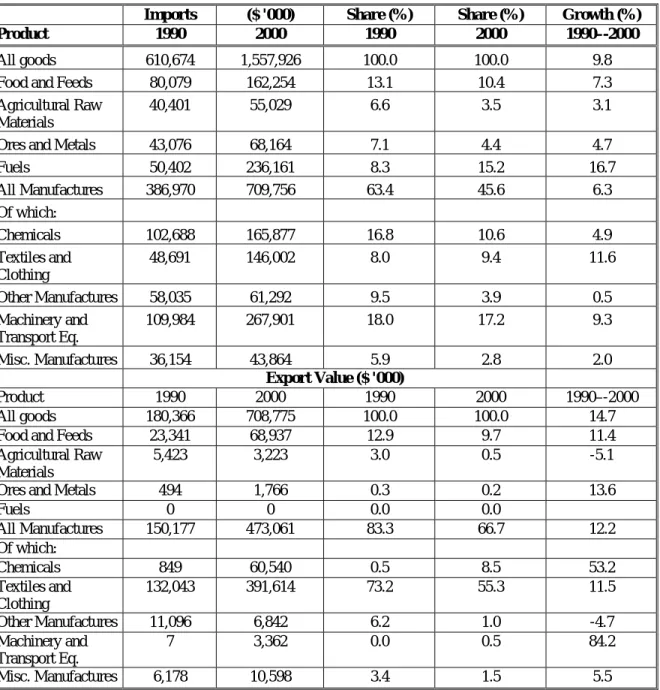
8. Despite significant structural changes in its merchandise exports over the last two decades, Nepal, like other low-income countries, remains dependent on relatively few exports, making it more vulnerable to external shocks. The share of primary goods declined from nearly 70% in the early 1980s to 17% in 2000, whereas export of manufactured goods increased from 30% to 66% over the same period.
However, Nepal’s exports (totaling US$ 709 million4, excluding re-exports) were heavily concentrated in a few manufactured items—mainly ready-made garments and carpets—which accounted for nearly 60%
of all export earnings. Nepal’s main imports include machinery and transport equipment (18%), followed by chemicals (17%) and food products (13%).
9. The destination of Nepal’s exports and the sources of its imports are limited to a few countries.
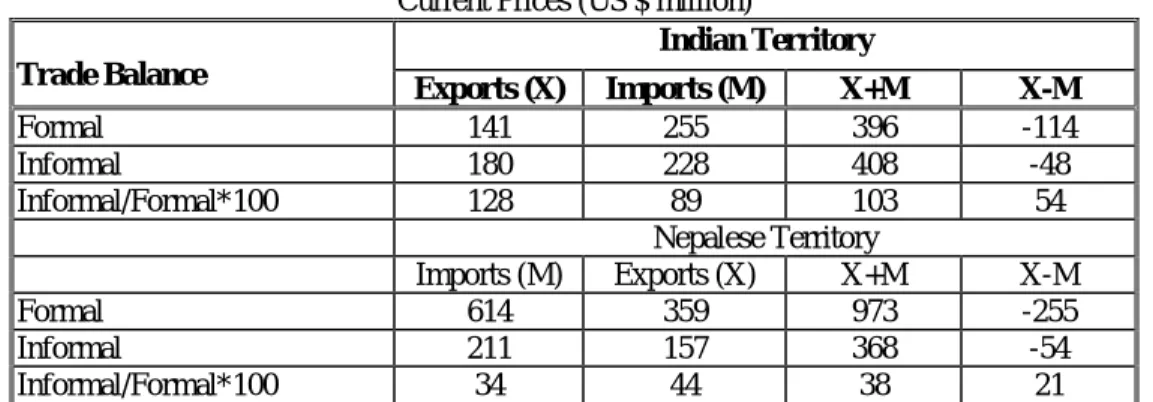
Exports directed to North America (clothing to the U.S.) and Europe (knotted carpets, mainly to Germany) comprised more than 50% of all exports in 2000. Indian markets—consisting mainly of textiles, food items, and chemicals—accounted for another 45%, although this share will fall now that the more restrictive Nepal-India Trade Treaty has been signed. The two main sources of imports are India (38%) and the East Asia region (33%). Estimates of informal trade with India show it to be significant, especially in agriculture (one-third formal volumes) and roughly balanced in each direction. Tariff differences between India and Nepal, versus other countries, offer one explanation for informal trade, but so do the high transaction costs of formal trade, suggesting the need for reforms.
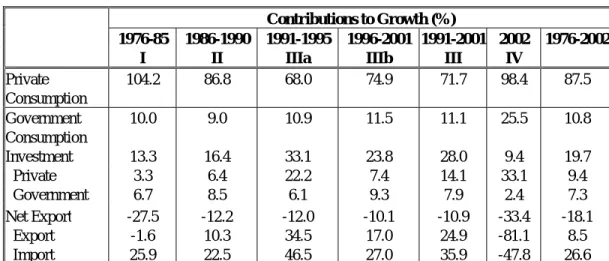
10. Notwithstanding its narrow base, Nepal’s growth in trade has been a driver behind accelerating per-capita economic growth to 2.4% per year in the 1990s, compared to the less than 1% growth rate for
4 The data is for the year FY 2000, the last year for which detailed breakdown of trade data is available from UN COMTRADE statistics.
iii
most of the country’s prior economic history. Following trade liberalization in the early 1990s, Nepal’s exports grew at an average annual rate of 15% throughout the decade, while the net exports of key items such as garments increased steadily, contributing to overall growth. Trade has stimulated demand-side growth by enabling Nepalese producers to access global markets instead of relying on weak domestic markets and stagnant agricultural incomes. On the supply side, liberalization of machinery, equipment, and raw materials imports helped to boost growth. Imports of machinery and transport equipment grew at about 10% annually during the 1990s, enabling the growth of private investment.
11. The importance of trade for growth and the nature of Nepal’s exports (labor-intensive manufacturing and diversified agriculture) mean that trade is critical for poverty reduction. As analysis of the 1995–1996 data suggests, if the 5% average growth rate of the 1990s could be restored in the next five years, and if inequality does not worsen and consumption grows at the same rate as income, then the share of population living below the poverty line would be expected to fall below 30% by the end of FY 2007.
A simulation exercise carried out for this study shows that trade and its associated improvement in transportation can raise the income of the poor (especially the urban poor) through employment and by encouraging farmers to switch to higher-value crops.
12. While Nepal has comparative advantage for a number of products and a significant potential for increasing its trade, medium-term prospects are challenging. The global economic slowdown and disruptions related to the Maoist conflicts have shown the downside risks by the collapse of exports and tourism in FY 2002. The forthcoming phasing out of the MFA, increasing competition from new WTO members and the recent new Nepal-India Trade Treaty all pose significant challenges for realizing Nepal’s export potential in the medium term. Overcoming them will require Nepal to undertake significant reforms and institutional development to increase its competitiveness.
Macroeconomic and Trade Policy
13. Nepal’s prudent macroeconomic stance throughout most of the 1990s has helped to increase its competitiveness. Low levels of domestic borrowing by the public sector, the nominal anchor of an exchange-rate peg with India, and a large jump in remittances by expatriate Nepalese labor have enabled Nepal to maintain macroeconomic stability. Sustaining this position, which keeps inflation low and avoids crowding out the private sector and real exchange rate appreciation, is fundamental to maintaining export competitiveness. The current exchange-rate peg served Nepal reasonably well in the 1990s by keeping the real effective exchange rate (REER) stable in the face of large inflows of labor remittances.5 However, the challenges noted above will increase competition in world markets. In that light, the current pegging arrangement and its level will require ongoing review to ensure that Nepal’s competitiveness does not erode.
14. Along with Sri Lanka, Nepal has the most liberalized trade policy in South Asia—comparable to those of the most liberalized developing countries. Since 1990, the average tariff has been reduced from 40% to only 14% (2001). Current policy aims for a further simplification and reduction of tariff bands.
As trade-related taxes account for about one-third of all tax revenue, the rationalization of tariffs will need compensating measures by enhancing the tax collection from other trade-neutral taxes.
15. Nepal’s tariff structure follows the basic pattern found in other developing countries, with cascading tariffs aimed at giving higher protection to producers of consumer goods and lower levels of protection on intermediate inputs. Given the reduction in tariff dispersion over the years, effective protection rates have also declined. Recently imposed additional duties and charges, levied on top of the
5 Initial research suggests that, on average, Nepal’s real exchange rate has tracked the equilibrium in the 1990s.
iv
basic tariff structure, are around 3 to 4% on average and can be as high as 14.5%. However, most of these do not discriminate against imports and are non-protectionist in nature.
16. The tariff regime also accommodates the preferential treaty for India and regional trade agreements, including the South Asian Preferential Trade Agreement (SAPTA). Preferences are given to Indian imports through rebates on ad-valorem customs duties. However, the effectiveness of these preferences, and those for SAPTA nations and the Tibet Autonomous Region of the People’s Republic of China, as well as the costs of trade diversion, have eroded with the steady decline in Nepal’s tariff levels.
In the event, trade with countries in the region, other than India, is negligible.
17. While the Nepal-India Trade Treaty of 2002 continues Nepal’s customs duty-free access to India in principle, it is more restrictive than the previous treaty. Under the new treaty, India has imposed quantitative restrictions on four items to restrict a “surge” in exports from Nepal to India. In addition both countries have the right to impose safeguard measures to protect their domestic industries and domestic value added requirements for trade have been increased. While exports to India have dropped due to these new restrictive measures on rules of origin, quota allocation and other non-tariff barriers, the proximity of the large Indian market continues to present Nepal with important opportunities to expand trade in goods and services where it has comparative advantage, which are identified in this report
18. Coordination of Nepal’s trade policies present major problems, as policies are developed and implemented by many agencies with multiple objectives. Given the importance of trade for the Nepali economy, the Government needs to make investment in trade policy capacity building a high priority. It needs to consider building an apex body with specific responsibility for trade policy development in line with its poverty reduction strategy, evaluation of these policies, and trade negotiation. Nepal needs technical assistance in all these areas. Trade promotion needs to be rationalized and separated from this body, based on public-private partnerships and cost-sharing.
Accession to the World Trade Organization
19. The forthcoming WTO accession, which will take place after Nepal’s ratification of the WTO agreement, holds important benefits and challenges for Nepal—one of the two least developed South Asian countries that are not yet WTO members. The benefits are threefold: i) discipline of Nepalese policymakers and policy credibility resulting from WTO commitments; ii) discipline of trading partners to give Nepal access to their markets and trans-shipment rights; and iii) WTO-required institutional improvements. The costs of accession stem from potential revenue loss and competitive challenges brought about by further tariff reductions and the need to strengthen institutional capacity.
20. A key issue during the negotiations was the level of tariff bindings. In its final goods offer, Nepal succeeded in preserving flexibility on the margin between bound and applied rates. Nepal should now rationalize the current tariff structure and adjust rates (possibly both up and down) within the confines of its tariff bindings to promote efficient development of domestic industries through appropriate levels of protection. But this can be done only if the analytical capacity for trade analysis within His Majesty's Government of Nepal (HMGN) is increased with technical assistance.
21. WTO compliance can impose costs in various ways. Standards compliance involves real resource costs and new testing facilities. The private sector stands to gain from such changes and should be persuaded to share these costs. Nepal has negotiated to phase out “other duties and charges”.
Consequently, Nepal will need to find other revenue instruments to compensate for possible revenue losses.
22. Having negotiated liberalization offers on trade in 11 service sectors (including many business support services, engineering and consulting), Nepal has to make best use of service sector liberalization
v
to promote its economic development. Nepal has submitted a lengthy legislative action plan; however, it requires substantial drafting and other technical assistance in such areas as Trade-related Intellectual Property Rights, Sanitary and Phytosanitary Measures, and Technical Barriers to Trade (see chapter 3.3 for a glossary). The United Nations Development Program (UNDP)’s assistance in these areas needs to continue. Nepal is considering using anti-dumping provisions and competition policy legislation open to members as safeguards against unfair trade practices. Technical assistance will be required for implementation in either case.
23. In the critical area of agriculture, subsidies are not an issue, given that Nepal has eliminated most of them. Current policies are generally appropriate. However, the Government’s view is some irrigation and agricultural subsidies may need to be reviewed, and which can be accommodated under aggregate measures of support to agriculture under WTO rules. Similarly, the treaty with India and regional agreement like SAPTA does not appear to be inconsistent with WTO rules.
24. In the area of intellectual property rights, implementation will be demanding. Existing patent protection falls short in several areas, and resources of the Department of Industry, the responsible agency, are inadequate to ensure compliance with existing requirements, even in such basic areas as storage for seized goods. Such capacity must be added as a priority. Gains from the enhanced property rights requirements of TRIPS will come only in the longer term for Nepal and will depend on being able to connect investors to capital markets and exploit property rights in traditional knowledge. Nepal needs assistance in the areas of trade negotiation and commercial diplomacy, support for this through adequate trade policy analysis and assistance in preparing and enforcing legal provisions, and overall implementation of WTO rules.
Competitiveness and Productivity: Constraints and Potential
25. Despite liberalization and growth of trade in the 1990s, the study shows that competitiveness of Nepal’s economy is low, as measured by firm-level surveys in manufacturing, farm yields, and aggregate productivity estimates. Labor productivity in manufacturing and agriculture are among the lowest in the region, while manufacturing unit labor costs are among the highest even though Nepal has comparative advantage in a range of agriculture and manufacturing products. While unit labor costs declined in the 1990s, this could not be sustained, partly because of the appreciation in the REER at the end of the 1990s.
26. This study shows how three key factors contribute to low price competitiveness and productivity in Nepal’s economy: i) inadequate mechanisms and incentives for firms to acquire new technology, ii) weak infrastructure, and iii) an unfavorable business climate. Rigid labor legislations in the formal sector, with strict anti-dismissal rules, prevent incentive-based wages, constrain investment in labor training, and decrease labor productivity. Inadequate bankruptcy and foreclosure provisions raise the costs of reallocation of factors to more productive uses, leading to an economy that tolerates a broader range of inefficient firms, compared to other developing countries. Price competitiveness is further diminished by a comparatively weak infrastructure and one of the highest charges for electricity in the region. Transport and transaction delays lead to exceptionally high inventory costs. An inadequate regulatory framework, unpredictable implementation, the Maoist conflict, and related uncertainty further add to costs.
27. Despite these constraints, Nepal’s economy has shown potential to be competitive in many areas.
This is evidenced by analysis of domestic resource costs, price differentials, and revealed comparative advantage. While growth has been rapid in these areas of comparative advantage, global market share is still low, suggesting significant potential for growth. However, given the increasing volatility and competition of global markets, Nepal must make significant efforts to improve trade facilitation and remove “behind-the-border” constraints to realize this potential.
vi Trade Facilitation and Behind-the-Border Constraints
28. Improving customs performance in governance, procedural and infrastructure areas to make it a facilitator of trade is a priority and is necessary for WTO accession. Customs processing delays at the border and Kolkata port add 3-5 days to the 8-day travel time between Kathmandu and Kolkata. Customs and trans-shipment delays can account for as much as 55% of the logistics costs of sending certain types of goods from Kathmandu to Kolkata, instead of the typical 25% for other international routes.
29. On the governance side, the Customs Department needs greater service orientation in trade facilitation, instead of focusing exclusively on revenue collection. Encouraging more voluntary compliance and transparency in customs clearance, developing a new code of conduct for the Department, and strengthening investment capacity are critical. The role of the Customs Officer and organization need to be reviewed and changed, in line with introduction of new post-entry audit and valuation and Automated Systems for Customs Data (ASYCUDA) rules. The Customs Department needs greater authority and support on budgetary, personnel, and management issues. In the medium term, Government needs to reconsider the concept of a Revenue Authority to improve coordination between the Customs and the Inland Revenue Departments. Overall, the Customs Act and Rules need reforming to be made consistent with WTO requirements. Other requirements are to simplify and harmonize trade documents and procedures with India and other neighboring countries and organizing systematic meetings with traders and training them in new procedures. Finally, sufficient resources need to be made available to open major customs posts on a 24-hour basis—a measure that will require Indian cooperation.
30. On the infrastructure side, there are four priorities: i) developing internal audit and investigative capabilities on such Customs clearance issues as valuation, classification, and origin (which need to be more selectively conducted, based on clearly defined risk-assessment criteria); ii) creating post-entry valuation capacity; iii) strengthening facilities to provide training in these new procedures; and iv) building up Customs infrastructure in such key facilities as Birgunj and the Tribhuban airport, which lack weighbridges, X-ray machines, testing, quarantine and refrigeration facilities and are clearly unable to handle the traffic.
31. Transport and Logistics: Pre-shipment transport costs account for 7-8% of the prices received by exporters (more than twice that in Bangladesh or Vietnam). Thus, reducing transport and logistic costs is critical for increasing competitiveness and there is significant scope to do so. For example, it is estimated that the current 8-day travel time between Nepal and Kolkata can be reduced to 3-5 days by using containerized rail transport from the Birgunj Inland Container Depot (ICD), thereby reducing transport costs by about 30%.
32. The logistics requirements of Nepali traders, however, remain heavily dependent on internal road freight. To this end, there is scope for significantly improving management of the roads system through more effective and timely maintenance and strategic expansion of the national road system. While the Government has recognized the importance of maintaining strategic roads, expenditure on rural agricultural roads has been slightly more than 25% of the budget, lowering agricultural competitiveness.
The Priority Investment Plan (PIP), which underpins the development of the roads infrastructure until 2007, needs to be more effectively implemented, especially at the district and village levels.
33. The recently created National Roads Board presents an opportunity for taking an integrated, national logistics system approach to road transport, rather than the project approach taken in the past.
However, this body needs technical strengthening, as well as an assured source of funding from a fuel levy. In addition, more information is needed on road use and evaluation of alternative transport corridors, including the one to Mumbai port, which is one of the more efficient ports in the region.
vii
34. While telecommunications development in Nepal has surpassed that of certain neighboring countries, the power sector (with a current 522-MW capacity) suffers from high costs, resulting from piecemeal development. Despite a doubling of generating capacity, supply and demand remain unbalanced, both regionally and seasonally. Past pricing has not been supportive of expansion. Evidence suggests that license agreements with independent power producers (IPPs) have been costly, though they have resulted in rapid expansion of electricity generation in recent years. Future licensing arrangements need to be better linked to the least cost expansion path of the national grid. Unbundling the generation, transmission, and distribution of Nepal’s power utility can increase efficiency and private sector participation. Despite much discussion, large-scale power exports to India have yet to occur because of the weak financial position of potential buyers, the large capital investments required for these projects and the still inadequate regulatory framework for private sector participation.
35. Labor Markets: Growth and poverty alleviation in Nepal are constrained by one of the most rigid regulatory frameworks for labor markets in the developing world and a poor-quality education system. Available evidence suggests Nepal has high labor-force participation, low unemployment, and underemployment.6 This study suggests that the key issue is low productivity of the labor force caused mainly by the effect of labor market regulations and the low quality of the education.
36. While labor market regulations directly affect about 2%7 of the labor force, the adverse implications extend much farther. These regulations lower labor productivity by creating disincentives for labor to be efficient and for firms to invest in training, restrict growth of firms, encourage more capital-intensive production, and generally discourage investment and employment in the formal sector.
In extreme cases, firms have the incentive to employ Indian labor in highly skilled positions rather than train Nepali workers. These regulations include the Labor Act of 1992, which prohibits, with the exception of criminal behavior, the dismissal of “permanent” employees (i.e., all employees with more than 240 days of employment). One result is that firms face great difficulties in closing down or changing their business. In addition, minimum wage regulations cover skills categories in firms with more than 10 employees, the mandatory payment of 10% of profits to a workers’ benefit fund (under the 1973 Bonus Act), and Trade Union resistance to providing incentive or performance-related pay.
37. Without labor market improvements, Nepal will find it impossible to increase competitiveness and formal sector employment significantly. This study suggests the following options for improvement:
drafting a labor law consistent with an Employment Contracts Law, which would allow unrestricted agreements between workers and employers of firms; amending the existing code to allow firms the flexibility of retrenching workers, along with compensation; amending the Bonus Act of 1973 to remove mandatory payments; and revisiting the Income Tax Law of 2002 to consider providing tax credits for companies that can document the costs of providing training for their workers
38. The long tradition of Nepalese seeking employment opportunities abroad has accelerated and diversified, with some 10-15% of the labor force now working as expatriate labor. Their annual remittances are estimated at US$800 million in the current year, four times the flow of official aid. A key issue is whether the recent surge in labor remittances is a lasting or a transitory phenomenon, and the conditions that can enable it to continue. Government has requested technical assistance for this purpose.
39. Investment Climate: With its considerable natural barriers, Nepal must make an extra effort to improve its investment climate relative to its competitors. At present, this is far from the case. The Heritage Foundation’s Index of Economic Freedom (based on relatively transparent and objective
6 These data have to be treated cautiously as labor market data is extremely weak (see Chapter 6).
7 Estimates by trade unions are that these regulations cover 8% of the labor force, while other estimate suggest it to be around 5%.
viii
indicators), for example, ranks Nepal 119 out of 250 countries—lower than half of Sub-Saharan countries and much lower than competitor economies of East Asia, such as Cambodia. A telling indicator of investment-climate problems is that foreign direct investment (FDI) is the lowest in Nepal, even among landlocked countries. More analysis is needed on why foreign investment has avoided Nepal.
40. While improvements in the 1990s brought about by the Foreign Investment and Technology Act of 1992 and rapid growth of private sector credit have facilitated market entry and increased investment over the past decade, the legislative policy and institutional framework governing investment in Nepal still need considerable improvement. Regulatory laws need more clarity and removal of inconsistencies.
The overriding 2002 Income Tax Act has not been accompanied by published amendments to the 1992 legislation where this has been overridden; this has created uncertainty with respect to investment incentives, most of which have been withdrawn. Business approval procedures, which are, in principle, business friendly, are implemented unevenly and unpredictably. The One Window Committee, whose nominal role is to expedite approval and granting of available facilities, is preoccupied with an ineffective duty-drawback scheme for exporters. Coordination between the line ministries relevant to approvals is weak. The separation between business and tax registrations introduces additional transactions costs.
41. These problems largely result from having too many entities responsible for areas of investment approval, investment concessions and facilitation, and trade and investment promotion. These bodies include the Investment Promotion Board, Board of Investment, Foreign Investment Promotion Section of the Ministry of Industry, Commerce, and Supplies (MOICS), Fast Track Committee, One Window Committee, and Trade Promotion Center. The number of bodies should be reduced to perhaps three that handle well-defined areas of approval, facilitation, and promotion.
42. The Government also needs to address private sector concerns about policy opacity and unpredictability, as well as lack of consultation on policy changes. Firms have cited the arbitrariness of tax administration and the opacity and inconsistency of tax laws as one of the main constraints to their business. Previous recommendations, dating back to 1997, to create a Revenue Authority and remove the constraints that civil-service rules impose on creating a well-motivated, facilitative revenue administration is currently being reviewed by the Government. The Government needs to take other intermediate steps to improve revenue administration and accountability and promote trade facilitation. For instance, arrangements to introduce on the spot resolution of the issues at the border will greatly help in minimizing transactions costs with customs.
43. Inefficiencies in factor markets (i.e., markets for land, finance, and labor) raise costs significantly, though trade finance per se does not appear to be a constraint. Inadequate specification of property rights indicated by delayed processing of contractual disputes by a weak judiciary, weak bankruptcy and foreclosure procedures, and the inability of financial institutions to recover bad loans all hinder reallocation of resources from less productive to more productive uses. Currently, the Government is reviewing the Insolvency Bill, Secure Transaction Bill, and Companies Act amendments to address these issues. Restructuring the balance sheets of state-owned banks is another priority and a prerequisite for addressing the critical issue of agricultural lending by the Agricultural Development Bank (ADBN) and extending credit guarantees on longer-term lending to exporters.
44. Rules governing foreign investment are liberal in principle but ambiguous and less friendly in practice. There are no restrictions on ownership or repatriation of investment and profits. The Negative List, which excludes certain activities from foreign investment, is relatively short. However, some excluded activities are ones in which foreign investment could help to lift efficiency and quality of local businesses, marketing, consulting and accounting services (i.e., critical support services for business).
Vaguely defined terms, such as cottage industry, create further investor uncertainty. The HMGN should
ix
address this issue immediately by redrafting the relevant part of the Foreign Investment and Technology Act.
45. This study makes specific recommendations for improving the investment climate. Key measures include: i) opening up business support services (e.g., accounting, consulting, marketing) to foreign investment; ii) rationalizing and reducing the number of organizations that handle investment and trade- related issues from more than 10 to about 3; iii) removing constraints on exporters by easing access to duty drawback; and iv) introducing a bankruptcy law and its implementation.
Case Studies
46. Carpets: The hand-knotted carpet/rug industry is a major source of foreign exchange (US$145 million in 2000) and employer of more than 50,000 workers, contributing significantly to rural and urban household incomes and poverty reduction. Carpet exports grew by 65% annually during the 1990s and increased their share of global market tenfold, even after the share fell towards the end of the 1990s.
Recently, however, the industry has stagnated in the face of static global demand, more intense international competition from machine-made carpets, inadequate marketing networks and design capacity and regulatory restrictions on product variety, lack of FDI, and price regulations, including minimum price restrictions. These regulations, intended to ensure product quality, need to be liberalized and replaced by other credible, quality-assurance arrangements.
47. Garments: During the 1990s, the ready-made garment (RMG) sector was a leading source of growth in manufacturing output, exports, and employment. Last year, exports slumped, but this year they are expected to increase by 50%, suggesting both the pitfalls and the potential of this sector. The external environment for garment exporters will change radically when the quotas on all suppliers in the European Union (EU) and U.S. are eliminated at the end of 2004 under the Agreement of Textiles and Clothing. At that time, competition from such countries as China and India will intensify. In the U.S. market, Nepalese suppliers now face competition from the preferences granted to selected African and Caribbean countries.
On the other hand, Nepal has not been able to exploit its duty- and quota-free access to the EU. This again suggests that Nepal needs the beneficial presence of foreign investors (as in Cambodia and Sri Lanka) to increase market access. The new trading environment will offer opportunities to efficient suppliers of garments. Nepalese garment exporters have advantages, particularly low-labor costs, which may enable them to exploit existing and emerging market opportunities. But current garments quota allocation rules need to be changed to support efficient producers. The case study in the report shows how policy reforms that increase labor productivity, increase competition, reduce transaction and transport costs can help to lower prices by more than 15%, enabling exporters to expand exports and output.
48. Agriculture: In a break with past performance, agricultural exports grew rapidly in the late 1990s.
Food and feed exports (e.g., beans, peas, lentils, other legumes, cardamom, and nutmeg) grew 15% per year in the second half of the 1990s, directed almost entirely to India. Nepal’s comparative advantage extends to a variety of forest products, including medicinal herbs and aromatics.8 Yet, value added in this sector currently accounts for only 1.5% of agricultural GDP. Comparative advantage extends to a range of other areas: honey, horticulture products, livestock, fisheries products, fiber, and off-season vegetables. Trade policy distortions are not widely evident. But poor factor markets lower competitiveness. The sustainability of agricultural credit, which doubled in the 1990s, is an issue. Large- scale subsidization of agriculture in neighboring Indian states affect border prices of produce adversely.
Several acts (e.g., Forest Act, Lands Act, and Cooperatives Act) hinder large-scale private commercial or contract farming and cause land fragmentation. Nepal’s higher agricultural processing costs compared to those of India (e.g., rice milling in Nepal is twice as expensive as in Uttar Pradesh) tax agriculture. To
8 Nepal is richly endowed with forest resources, which supply timber, fuelwood, and medicinal plants and herbs.
The country has more than 700 species of medicinal and aromatic plants, of which 250 species are endemic.
x
address these constraints, strategic investments are needed in the following areas: i) capacity building in agriculture-related agencies, ii) facilitation of border transactions, iii) infrastructure improvements to promote commercialization, and iv) enforcement of quality standards and SPS requirements at both farm and processing stages.
49. Tourism: With foreign exchange earnings of about $US167 million in FY 2000 (13% of current account earnings) and a high value-added component, tourism is a key service export for Nepal. The Himalayan landscape, a wide diversity of flora and fauna, and a rich heritage of cultural and religious sites give Nepal inherent advantages. In the 1990s, tourism grew rapidly before being interrupted by a series of shocks (e.g., Indian airlines hijacking, escalating Maoist conflict, etc.). In the last two years, the sector has experienced a severe downturn due to these factors, though more recently tourism from the Far East and India has been growing and shows promise. Improving transport will be key for this sector’s prospects. Eighty percent of tourists arrive by air. But the uncertain prospects of the Royal Nepal Airlines and the high landing costs of Tribhuban Airport can restrict air access. Inadequate road transport raises costs for tourists to pilgrimage sites like Mount Kailash (in Tibet) and to scenic, trekking and rafting destinations. Road-transport master planning needs to incorporate tourism’s needs along with freight. Cooperation between the agencies involved in this sector needs improving. Important segments of the industry are not well represented in the National Tourism Board (NTB) and there is political interference, leading to low performance. The funding of the NTB is volatile, depending on levying businesses on a billable, tourist-numbers basis. This funding volatility restricts tourism promotion exactly at the time it is most needed.
50. Tea: The tea processing industry, though currently small, is seen as a potential growth industry and an important channel for reducing poverty due to strong linkages to rural communities. The case study for tea also serves as an illustration of the issues facing commercial and estate farming. Large areas of Nepal are suitable for tea plantations, and global demand for niche teas, such as orthodox tea, continues to grow. Export quantities are small (less than 1,000 tons compared to more than 1.3 million tons of total world exports). As the Nepal industry is relatively young, the quality of tea trees is regarded as high, compared to those in India leading many to consider tea to be a potentially important export. However, significant obstacles to investment and expansion remain. These relate to weak capacity of the Tea Board resulting from lack of clarity of its role, inadequate funding, staffing, and in adequate participation of the private sector, cumbersome investment processes, and land fragmentation. The limited transport infrastructure and underdeveloped marketing channels further constrain tea’s potential. The Government is addressing some of the constraints that are hindering growth of the sector through its tea sector policy.
51. Hydropower: The potential market for selling power from Nepal to India—and particularly the Northern Grid Region that lies to Nepal’s west—is large. The Indian Central Electricity Authority (CEA) has estimated a shortage of roughly 10,000 MW in the Northern Region at the end of the Tenth Five-Year Plan (2007). At the same time, Nepal has a significant hydro resource base. By 2020, Nepal’s total domestic power demand is estimated at around 1,650 MW, compared to a hydro potential of about 43,000 MW. But the present level of exchange between Nepal and India is limited in capacity to 50 MW per annum, indicating the large constraints in this sector. Attaining Nepal’s hydropower export potential will require increasing system efficiency to lower its power production costs, and improving the financial viability of potential purchasers in India – the public state electricity boards or private purchasers. Recent reforms in India suggest increasing opportunities for power exports. However, exports are likely to take place in small to medium sized projects (200 to 300 MWs) or through incremental expansion of present arrangements, rather than through large multi-purpose projects. Two important institutional reforms are required. First, the Power Exchange Committee between India and Nepal, which has been defunct for some time, has to be reactivated. Second, the Government will need to facilitate the private sector of both countries to directly negotiate power development and trading arrangements.
xi
POLICY AND TECHNICAL ASSISTANCE MATRIX (A)
TOP PRIORITY MEASURES RECOMMENDED FOR IMMEDIATE IMPLEMENTATION
* Immediate = next 6 months
Objectives
Action
recommended Requirements
Time frame and agencies Implement
existing policy
Policy/
legislation change
Technical assistance Strengthen trade
policy capacity;
rationalize institutions and practices
! Continue activities of the National Steering Committee with the ToR to monitor implementation.
! Appoint national and international advisors to set up an apex trade policy evaluation, promotion and negotiations unit based on audit of existing trade policy expertise.
! As an interim measure, strengthen capacity in two trade divisions of the MOICS.
Yes
Yes
No
Yes
Yes
HMGN
HMGN, Development Partners (DP)
MOICS, DP/WTO MOICS/FNCCI/
DP Move toward WTO
compliance
! Identify service-related bottlenecks that increase costs, and liberalize these sectors.
Yes Yes HMGN, DP
Reduce transaction costs and improve market integration
! Complete legal review of Draft Nepal India Rail Agreement; finalize and implement.
! Appoint a terminal management operating company for Birgunj through competitive tender.
! Operationalize and fund Roads Board activities and expenditures, including fuel levy transfer; implement APP budget for rural roads.
! Fund customs and ASYCUDA training.
! Review passbook scheme for duty drawback;
implement or replace by exemption.
.
! Introduce One Spot Export Clearance Arrangement in major customs points.
! Review constraints to market access, especially in EU.
! Introduce on the spot resolution of issues.
Yes
Yes
Yes
Yes Yes
Yes
Yes
Yes
Yes
Yes
Yes
Yes
No
No
No
No No
No
Yes
HMGN
MOICS
MOF, Roads Board MOF DOC, DP MOF, DOC MOICS, DOC, MOF, DP MOICS, Export related agencies, DP, Private Sector MOF/MOICS/
FNCCI
Reform labor market mechanisms
! Review the Income Tax Act 2002, with a view to clarifying tax credits for accredited training to employees.
Yes No MOF
MOLTM Reform institutions
and regulations, targeting investment
! Review functions of BOI, IPB, OWC, Fast Track Committee, and TPC, with a view to rationalization to three bodies dealing with approvals, concessions, and facilitation.
Yes Yes HMGN, DP
Note: DP = Development Partners
xii
POLICY AND TECHNICAL ASSISTANCE MATRIX (B) SUPPORTING MEASURES
Short term= within12 months, Medium term = within 2 years, Longer term = 2 to 5 years
Objectives
Action
recommended Requirements
Time frame and agencies Implement
existing policy
Policy/
legislation change
Technical assistance TRADE POLICY AND
WTO ACCESSION
Institutional rationalization WTO accession
Tariff and duty drawback and tax reforms
! Set up public-private funded Trade Promotion Agency to replace TPC/EPB.
! TRIPS: finish drafting laws to bring Nepal into formal compliance; initiate extension services to educate SMEs on commercial benefits of trademarks and branding; construct facilities to hold confiscated counterfeit goods.
! TRIPS: Establish inquiry point (for non-agro.
Products); build capacity in judicial system to handle IP disputes; conduct public-education campaign on commercial benefits of patents, geographical indications, and commercial value of traditional knowledge; promote the private provision of intellectual property legal services to SMEs.
! SPS/TBT: Introduce legislation to base domestic regulations on international standards; accept, on reciprocal basis where needed, any goods bearing certificates of conformity assessment issued by other WTO members (e.g., the EU’s “CE” mark);
establish an inquiry point for SPS measures.
! Establish infrastructure and strengthen organization for implementing TRIPS/SPS/TBT legislation.
! Analyze impact of moving to a reduced tariff bands on effective protection, trade flows and revenue impact.
! Broaden tax base to compensate for selective phasing out of ODCs and reduction of customs duties through removing exemptions, and extending VAT base.
Yes
Yes
Yes
Yes
Yes
No
Yes
Yes
Yes
Yes (extend TA)
Yes
Yes
Yes
Yes
Medium term HMGN, FNCCI
Medium Term HMGN, MOICS, DP Medium Term HMGN, MOICS, DP
Medium Term HMGN, MOICS, DP
Medium term MOICS DP
Medium term MOICS, MoF DP
Long Term MOF, DOC