BHUTAN
HYDROPOWER EXPORT BOOM:
ITS MACROECONOMIC IMPACTS AND POLICY IMPLICATIONS
September 2002
Public Disclosure AuthorizedPublic Disclosure AuthorizedPublic Disclosure AuthorizedPublic Disclosure Authorized
69498
BoP BRER CPI CSO DoP FDI GDP GoI IMF INR MU MW Nu RMA UNDP WPI
CURRENCY EQUIVALENTS
Currency Unit = Ngultrum (Nu) US$1 = Nu 48.32 (September 18,2002)
FISCAL YEAR July 1 to June 30
ABBREVIATIONS AND ACRONYMS
Balance of Payment
Bilateral Real Exchange Rate Consumer Price Index
Central Statistical Organization Department of Power
Foreign Direct Investment Gross Domestic Product Government of India
International Monetary Fund Indian Rupee
Mega Unit Mega Watt
Bhutanese Ngultrum Royal Monetary Authority
United Nations Development Programme Wholesale Price Index
Vice President:
Country Director:
Mieko Nishimizu Marilou Uy
SadiqAhmed Naoko Kojo Sector Director:
Task Manager:
ACKNOWLEDGEMENTS
This report was prepared by Naoko Kojo. The report benefited from invaluable comments from and stimulating policy discussions with a number of World Bank staff members. These include Edgardo Favaro, Elena Glinskaya, Ijaz Nabi, Garry Pursell (SASPR), Roberto Zagha, Tara Vishwanath (SASVP), Simon Bell (SASFP), and Tetsuya Konishi (ECSSD). The internal reviewer for this paper was Shahrokh Fardoust. Will em H. Buiter, European Bank of Reconstruction and Development, provided insightful comments as an external reviewer.
This report would not have been completed without the excellent cooperation of many officials of Royal Government of Bhutan and Royal Monetary Authority of Bhutan. In particular, the staff would like to thank Ugyen Norbu, Karma Tashiteem (Ministry of Finance), and Panjore (Royal Monetary Authority) for their constructive comments at the workshop of December 2001 and provision of requisite data. The draft report was discussed with the Royal Government officials in October 2002.
Administrative support was provided by Juliet Teodosio. The report was completed under the guidance of Sadiq Ahmed (Sector Director, SASPR) and Marilou Uy (Country Director for Bhutan). The Vice President for the South Asia Region is Mieko Nishimizu.
T ABLE OF CONTENTS
Executive Summary ... 6
1. Introduction ... 7
2. Mineral Export Boom, Real Exchange Rates and Dutch Disease ... 8
2.1 Spending Effect ... 8
2.2 Resource Movement Effect ... 10
2.3 Dutch Disease and Monetary Effects ... 11
3. Empirical Analysis: Bhutan's Power Exports and Macroeconomic Impacts ... 11
3.1 Power Sector ... 12
3.2 Power Exports and Real Exchange Rates ... 23
3.3 Power Exports and Dutch Condition ... 28
4. Policy Recommendations ... 38
4.1 Fiscal Policy ... 39
4.2 Exchange Rate Management ... 40
4.3 Private Sector Development .......... .42
5. Conclusions ... 43
Appendix 1: Measuring Real Exchange Rates ... 44
Appendix 2: Empirical Analysis: Determinants of Bilateral Exchange Rate of Ngultrum ... .47
References ... 53
T ABLE OF BOXES Box 1. Nigeria's Dutch Disease ... 11
Box 2. Botswana's Experience ... 40
T ABLE OF FIGURES
Figure 1. Dutch Disease (Classical Definition) ... 9
Figure 2. Bhutan: Power Exports (as percentage of total exports, GDP) ... 13
Figure 3. Bhutan: Volume of Sales by Chukha Hydropower Corporation (in mega units) ... 13
Figure 4. Bhutan: Power Tariff per Unit (in ngultrum) ... 14
Figure 5. Bhutan: Real Power Tariff per Unit (in ngultrum, constant 1980 prices) ... 14
Figure 6. Bhutan: GDP Growth Rate (in percent per annum) ... 16
Figure 7. Bhutan: Index ofGDP (1980 = 100) ... 16
Figure 8. Bhutan: Government Tax and Non-tax Revenues and Power Exports ... 18
Figure 9. Bhutan: Fiscal Development (as percentage ofGDP) ... 18
Figure 10. Bhutan: Current Account Transactions with India (as percentage ofGDP) ... 19
Figure 11. Bhutan: Net Capital Inflows from India and Power Export Revenues ... 19
Figure 12. Bhutan: Balance of Payments (as percentage ofGDP) ... 20
Figure 13. Bhutan: Current Account and Balance of Payments with Third Countries ... 20
Figure 14. Bhutan: Net Capital Inflows by Countries of Origin (as percentage ofGDP) ... 21
Figure 15. Bhutan: Net Capital Inflows (in millions ofngrultrum, constant 1980 prices) ... 21
Figure 16. Bhutan: Gross Rupee and Hard Currency Reserves ... 22
Figure 17. Bhutan: Bilateral Real Exchange Rates 1/ ... 24
Figure 18. Price Indices: Bhutan CPI and India WPI (1980 = 100) ... 26
Figure 19. Price Indices: Bhutan CPI and India CPI (1980 = 100) ... 26
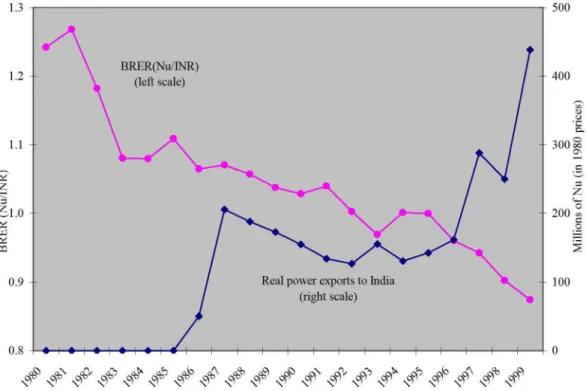
Figure 20. Bhutan: BRER(NU/INR) and Real Power Exports to India (in 1985 prices) ... 27
Figure 21. Bhutan: Composition of Absorption ... 30
Figure 22. Bhutan: Volume of Food Imports (in metric tons) and Power Income ... 3l Figure 23. Bhutan: Government Capital Expenditure and Grants (as percentage ofGDP) ... 32
Figure 24. Bhutan: Government Domestic Revenues and Current Expenditure ... 32
Figure 25. Bhutan: Components ofGDP ... 33
Figure 26. Bhutan: Index of Sectoral Output (1980 = 100) ... 34
Figure 27. Bhutan: Components ofGDP (as percentage of non-power GDP) ... 34
Figure 28. Bhutan: Exports and Non-power Exports ... 35
Figure 29. Bhutan: Exports by Country of Destination ... 35
Figure 30. Bhutan: Inflation Rates (in percentage per annum) ... 37
Figure 31. Bhutan: Money Supply (M2) and Money Velocity ... 37
EXECUTIVE SUMMARY
Bhutan has shown remarkable economic performance over the last two decades. Growth during the second half of the 1990s was particularly strong, with annual GDP growth averaging 6.5 percent. A large part of this performance has been supported by generous inflows of foreign aid and buoyant electricity exports to India, which have spurred growth both directly by expanding export earnings and indirectly by stimulating investment in the construction and transport industries. Growth prospects for Bhutan look bright, supported by enormous hydropower generation potential. In particular, the scheduled commissioning of the Tala hydropower project in 2005/06 is expected to give a major boost to growth by tripling the country's power generation capacity.
While the expansion in power exports has brought significant benefits to Bhutan, there has been concern that it may not be an "unmitigated blessing." Despite large net inflows of foreign capital, Bhutan's macroeconomic indicators suggest that inflation has so far been modest and under control. Over time, however, the real value of the ngultrum has appreciated steadily against the Indian rupee, eroding Bhutan's export competitiveness with India. Concern has been raised whether this is a sign of the Dutch disease caused by increased power exports to India, and whether additional foreign exchange inflows, including power export earnings and the World Bank's financial assistance, may undermine Bhutan's growth prospects by discouraging production and investment in the tradable sector such as agriculture and manufacturing.
The results of the empirical analysis of the Bhutanese economy indeed confirm that the power exports to India as well as fmancial assistance have caused real appreciation of the ngultrum against the rupee over time, through increased private spending and short-term monetary disequilibrium. Despite the real appreciation, however, the study finds little evidence to suggest contraction or stagnation of the non-power tradable sector. While the performance of the tradable sector may have been stronger in the absence of the real appreciation, thus far there is no sign of the Dutch disease, or the Dutch condition, in the Bhutanese economy.
Nevertheless, our empirical results indicate that further increases in power exports as well as foreign aid - regardless of which currencies they are denominated in - will likely put further upward pressure on the real value of the ngultrum against the rupee and could lead to the Dutch condition. Although there is no immediate threat that requires urgent policy attention, the country's long-term growth prospects will also depend on how effectively the Government uses the increasing power rents and foreign aid, and how well the Government manages the exchange rate.
1. INTRODUCTION
Bhutan has shown remarkable economic performance over the past two decades. Growth during the second half of the 1990s was particularly strong, with annual GDP growth averaging 6.5 percent. A large part of this performance has been supported by generous inflows of foreign aid and buoyant electricity exports to India, which have spurred growth both directly by expanding export earnings and indirectly by stimulating investment in the construction and transport industries. Growth prospects for Bhutan look bright, supported by enormous hydropower generation potential. In particular, the scheduled commissioning of the Tala hydropower project in 2005/06 is expected to give a major boost to growth by tripling the country's power generation capacity.
While the expansion in power exports has brought significant benefits to Bhutan, there has been concern that it may not be an "unmitigated blessing." Despite large net inflows of foreign capital, Bhutan's macroeconomic indicators suggest that inflation has so far been modest and under control. Over time, however, the real value of the ngultrum has appreciated steadily against the Indian rupee, eroding Bhutan's export competitiveness with India.
The 2000 Country Assistant Strategy for Bhutan views this as a sign of the Dutch disease caused by increased power exports to India, and suggests that additional foreign capital inflows,
including further expansion of power export earnings and the World Bank's fmancial assistance, may undermine the country's growth prospects as real appreciation tends to discourage
production and investment in the tradable sector such as agriculture and manufacturing.
This paper examines empirically the macroeconomic impacts of Bhutan's increased power exports to India. It is the first serious attempt to address the presence of the Dutch disease in the Bhutanese economy. Previous attempts had been hampered by lack of sufficiently long time- series data.! Four sets of key questions are addressed in this study: (i) what are the features of the power export boom in Bhutan? Is it a temporary or permanent phenomenon? How large are power exports? (ii) Have power exports appreciated the real value of the ngultrum? If so, would further increase in power exports put further upward pressure on the ngultrum? (iii) What have the impacts on the tradable sector been? Are there Dutch-disease symptoms? (iv) Are these impacts sizable enough to require policy interventions? If so, what kind of policy options are then available to the Government?
The results of the study may help the Royal Government of Bhutan formulate appropriate policy strategies to make effective use of power income to improve its population's living standards and well-being, while reducing heavy reliance on the foreign aid in order to achieve a self-sustained economy in the long-run.
The structure of this paper is as follows. Section 2 reviews the mechanism of how a natural resource export boom can lead to real appreciation and then to contraction of the tradable sector - that is, how the Dutch disease can happen. Section 3 then examines empirically Bhutan's power exports and their impacts on the domestic economy in line with the discussions in Section 2. It first discusses the features of Bhutan's power exports and assesses the main impacts on national
1 Data sets are available upon request.
income, government revenues, and external positions. It then empirically investigates the impacts on the real exchange rate and analyzes the impact on the economic structure in Bhutan. Section 4 provides a set of policy implications to the Government. Section 5 concludes the paper.
2. MINERAL EXPORT BOOM, REAL EXCHANGE RATES AND DUTCH DISEASE
A natural resource export boom can cause major distortions in an economy by discouraging production and investment in the non-booming exportables sector, often referred to as the "Dutch disease." 2 The extensive literature on the subject has been surveyed by Corden (1984) and Neary and van Wijnbergen (1986).3 The discussion here is concise and selective. It serves only to provide the background information necessary for the analysis in Section 3.
2.1 Spending Effect
The Dutch disease can be analyzed in the context of two separate effects in the real sector - a spending effect and a resource movement effect - and a monetary effect (see Figure 1).
Let us assume a natural export boom. First, there will be a rise in real income. The increased real income will raise spending on both tradables and non-tradables through the income effect, in the form of government expenditures and private spending, thereby stimulating the demand for both goodsY However, since the prices oftradables are determined on the world market, the higher domestic demand does not push up the prices of tradables. Any excess demand for tradables is met by an increased volume of imports.
The domestic prices ofnon-tradables, in contrast, will rise in response to the higher demand.6 Accordingly, there is a decline in the prices of tradables relative to the prices of non-tradables, which by definition is real appreciation of the home currency. 7 The extent of the real
2 Named because of the Netherlands' experience with the discovery of natural gas in the 1970s.
3 Also see Buiter and Purvis (1983), Corden and Neary (1982), Eastwood and Venables (1982), Neary and van Wijnbergen (1984), and van Wijnbergen (1984). Amongst the literature, a formal analysis developed by Corden and Nearly (1982) has become a standard model in the literature. For computable general equilibrium model, see Bruno and Sachs (1982).
4 Provided that both tradables and non-tradables are nonnal goods.
5 The response of expenditure to real exchange rates does not matter whether the expenditure comes from the public or the private sector. According to Vaey-Zadeh (1989), even if all the windfall income accrues to the govermnent, increases in mineral rent tend to generate a positive "confidence effect" on consumers, affecting aggregate expenditure by the private sector.
6 Provided that there is no corresponding expansion in the domestic supply ofnon-tradables.
7 Note that the (bilateral) real exchange rate of the home currency against the foreign currency, BRER, can be expressed as BRE~ == eP/ / ~NT, where e is the fixed nominal exchange rate of the home currency, ~T
the prices oftradables and P/T the prices ofnon-tradables. Namely, the real exchange rate is merely the relative prices oftradables to non-tradables. A decline in BRER indicates real appreciation of the home currency. BRER is frequently used to measure the relative profitability of producing tradables compared with non-tradables. A fall in BRER (real appreciation) indicates a loss of profitability by producing tradables relative to producing non-tradables, and vice versa.
Figure 1. Dutch Disease (Dutch Condition)
Natural resource export boom
Real Sector
1 1
Monetary Sector- - - - - - - - ------------- - - - -
Increase in real income
Confid,nce effect
11
Incom, ojf<ctSpending on both tradables &
non-tradables increase
Current account surplus BoP surplus
Fixed ex.rate re gime
Floating ex.rate regime
1
Reserve accumulation Nominal appre ciatipn Spending effect
Relative pric e of tradable s to
non-tradables declines
\ I
, ,Money supply incre as e s beyond demand for : money(= monetary disequilibrium) :
\
, , '________________________
~
_________ , ____________ / __ _Mo_n'ta,y_,~,ct
______j
Real appreciation (Relative pric e change s)
Reduces incentives for production&
investment in tradable sector
~ Resource movement effect Re s ourc e s move out of tradable to non-tradable sector
Dutch disease (Dutch condition)
appreciation depends on the extent to which the prices of non-tradables rise relative to prices in tradables, namely on the marginal propensity to spend on non-tradables. This is the spending effect of increased real income.
2.2 Resource Movement Effect
Second, the real exchange appreciation will induce a consequent shift of resources from non- booming tradables to non-tradables, by reducing incentives for production and investment in the non-booming tradable sector.
With real appreciation of the home currency, the prices of tradables competing with imports in the domestic market as well as the prices of tradables sold in the competitive world market will tend to fall. As a result of the relative price change (real appreciation), incentives for production and investment in the non-booming tradable sector will likely decline in favor of the non-tradable sector. The growth rate of exports in the non-booming tradable sector will therefore slow, while the volume of imports will increase. Correspondingly, there will be a shift of labor and capital away from the non-booming tradables in favor ofnon-tradables, which will raise the real wage and lower the returns to capital accumulation. Wage rigidities may give rise to unemployment and productivity will decline in the non-booming tradable sector.
Real appreciation may also reduce the rents of the booming sector provided that the booming sector participates in domestic factor markets, but it may not be sufficient to bring down the booming sector's output. When the booming sector operates as an enclave sector, there will be no resource movement out of the booming sector.
4
In summary, real appreciation driven by a natural resource export boom tends to slow down the rate of growth of the non-booming tradable sector relative to the rate of growth in the non- tradable sector, worsening the trade balance.
These adjustments following an export boom - contraction of the tradable sector relative to the non-tradable sector - summarize the classic model of the Dutch disease, which is accompanied by real appreciation of the home currency (decline in relative prices). 8,9 It is a natural factor
movement due to changes in relative prices, and is a natural welfare improving symptom of the economy's adjustment to its new equilibrium.
Despite its name, however, the Dutch disease itself does not constitute a "disease" for which corrective actions are called for, but is a "condition" where real appreciation caused by a natural resource export boom leads to a shift of resources from the non-booming tradable sector to the non-tradable sector. Thus it would be more accurate to refer to it as the "Dutch condition" rather than the "Dutch disease." Whether the Dutch condition leads to a real disease largely depends on the country's policy responses to the boom. In the case of Nigeria, the economic deteriorations
8 Although the Dutch disease is usually discussed in the context of natural resource export booms, it can happen with any types of foreign capital inflows if they raise domestic spending through increased real income.
9 While real exchange rate variabilities, often evidenced in countries experiencing a natural resource export boom, pose a threat to macroeconomic stability, they do not constitute a pre-condition leading to the Dutch disease. Regardless of the presence of exchange rate variabilities, with real appreciation, resources tend to move away from the tradable sector to the non-tradable sector.
Box 1. Nigeria's Dutch Disease
During the 1970s, Nigeria enjoyed an oil export boom as a result of dramatic increases in the prices of oil. The resulting real appreciation of the Nigerian naira reduced the relative export prices of non-booming tradable goods and subsequently damaged Nigeria's manufacturing and agricultural sectors. The Government responded to the boom with increased expenditures financed by external borrowing against the strength of oil, as well as a monetary expansion that was followed by high inflation. When the oil boom ended abruptly in the 1980s, Nigeria was left with deterioration of balance of payments, and a resulting loss of international reserves and large foreign indebtedness. The consequence was a substantial decline in output.
In the case of Nigeria, it was more of a poor policy response, rather than the resource movement out of the non-booming tradable sector, that was the most important cause of affliction, often erroneously referred to the Dutch disease.
that followed the oil export booms in the 1970s were clearly the direct result of the Nigerian government's inappropriate policy responses to the temporary boom, but not the direct result of the Dutch condition itself (see Box 1).
2.3 Export Boom and Monetary Effects
A standard Dutch disease model does not include the monetary factor. Hence, emphasis has been placed only on the spending and resource movement effects. However, natural resource export booms are also likely to have an important monetary effect through net reserve accumulation (under a fixed exchange regime) or nominal appreciation of the home currency (under a floating exchange rate regime).
Under a fixed exchange rate regime, the increased price of the booming natural resource will tend to raise the supply of money by generating a balance of payments surplus and a net accumulation of international reserves or capital outflows. Unless the increase in international reserves is fully sterilized, the real money supply could increase beyond the demand for money, generating short- term monetary disequilibrium. Inflation will tend to result in further real appreciation of the home currency, exacerbating the Dutch condition. Under a floating exchange rate regime, nominal appreciation of the home currency leads to real appreciation, without reserve
accumulation and with partial sterilization. This monetary channel, however, would operate only in the short-run, affecting the dynamics of the real exchange rate. In the long-run real exchange rates respond only to changes in the real fundamentals.
3. EMPIRICAL ANALYSIS: BHUTAN'S POWER EXPORTS AND MACROECONOMIC IMPACTS
This section analyzes empirically how the expansion of hydropower exports to India has affected the Bhutanese economy. It addresses a number of important questions: Is the real appreciation of the ngultrum associated with power exports? Have power exports led to an increase in spending
by the Government and the private sector through increased real income, thereby resulting in appreciation of the ngultrum? What are the impacts on the tradable sector? Has there been a relative decline in the tradable sector? What about the monetary effect of power exports? Would further expansion in power exports undermine the growth prospects of Bhutan's tradable sector?
This section fIrst provides the background information about Bhutan's power sector - the booming tradable sector - and discusses the main impacts of power exports on national income, government revenues and external positions. Next, it focuses on the movement of the real exchange rate of the ngultrum. A formal statistical analysis is conducted to examine whether power exports have indeed led to real appreciation of the ngultrum. Finally, it analyzes how the domestic economy has responded to the increased power exports. We examine the presence of the Dutch condition in the Bhutanese economy in terms of a spending effect, a resource
movement effect, a monetary effect.
3.1 Power Sector 3.1.1 Background
Bhutan's hydropower exports began in 1987 with the commissioning of the 336MW Chukha hydropower project, which has boosted GDP directly through export earnings and indirectly through the growth of the construction and transport industries, as well as energy-intensive industries such as cement, ferro-alloys, and calcium carbide. According to the long-term bilateral purchase agreement between Bhutan and India, after Bhutan's domestic demand is met, all surplus supply of power is exported to India, whose vast market suffers chronic excess demand.
The power sector operates as an enclave sector in the Bhutanese economy. It does not participate in the domestic factor markets. The sector generates very little domestic employment and tends to use expatriate labor from India. Financing is provided exclusively by India. Thus, there is no resource movement between the power sector and the rest of the economy in Bhutan.
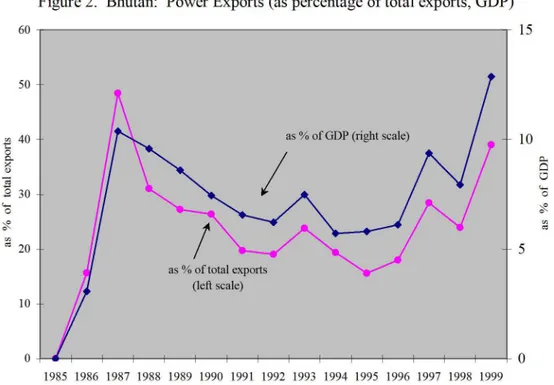
Over time, sales of hydropower have grown to become Bhutan's dominant source of export earnings. In 1999, power exports generated nearly 40 percent of Bhutan's total export earnings, and accounted for about 13 percent ofGDP (see Figure 2). Tariffrevisions in the late 1990s caused the growth of power exports to accelerate (see Figure 4). The commissioning of the Kurichhu project in the late 2001 is expected to add still more export revenues to the country beginning in 2002/03. By 2005/06, Bhutan's power export capacity is set to triple, with the commissioning of the Tala project (1,020 MW), but still up to only about one-tenth of the country's technically viable potential (16,000 MW).lO
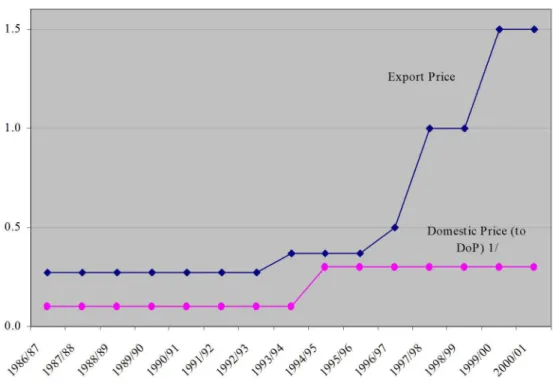
The tariff of electricity exports from the Chukha plant is set bilaterally with India at the political level. The nominal tariff has been revised every two or three years since 1992 primarily to keep pace with inflation (see Figure 5). Since 1996, however, the nominal tariff has been revised more frequently and more sharply. The real tariff of power more than doubled between 1996 and 2000 (see Figure 5).
10 Bhutan is endowed with enonnous hydropower generation potential. The total capacity is estimated to be about 30,000 MW, of which over 16,000 MW is technically viable.
Figure 2. Bhutan: Power Exports (as percentage of total exports, GDP)
60~---~ 15
50
t 40 o 0..
X "
3 B 30 '-o -cr
~ 20
10
as % of total exports (left scale)
as % ofGDP (right scale) 10
5
o +-~r---~~---+---r--~--~--+---r---~~---+---+--~---+ 0
1985 1986 1987 1988 1989 1990 1991 1992 1993 1994 1995 1996 1997 1998 1999
10-
CI 0 '-0
0 ~
en '"
Figure 3. Bhutan: Volume of Sales by Chukha Hydropower Corporation (in mega unit)
1,500 Export to India
1,000
~
500 Domestic Sales (to DoP) 11
O+-~'----r--~---'----r---~--~--'----r--~---'----r---~~
~ ~ B ~ ~ ~ ~ ~ n b ~ ~ ~ ~
'-d"o ~\'B ~"6 ~ ~o, \0, 0>0, ~o, ~o, 00, '-do, \0, ~o, f3
~oo ~"o ,-0,"000 ~~ ~o,~ ,-0,0," ~o, ~o, ,-0,0, ~o, ~o, ,-0,0,'\ ~o,oo ~o,o,
1/ Sale of electricity to the Department of Power, DoP, which distributes electricity domestically.
Source: Data provided by the Bhutanese authorities.
1.5
1.0
0.5
Figure 4. Bhutan: Power Tariff per Unit (in ngultrum)
: : : : : : := .;' •
Export Price
•
Domestic Price (to DoP) 11
• • • •
0.0 + - - - , - - - , - - - - , - - - , - - - , - - - , - - - , - - - - , - - - , - - - , - - - , - - - , - - - - , - - - , - - - 4
Figure 5. Bhutan: Real Power Tariff per Unit (in constant 1980 ngultrum)
0.6 ~---,
0.5
0.4
0.3
0.2
0.1 Domestic price
(to DoP)
0.0 +---,----r---r---r---,---,---,----r---r---,---,---,----r---r--~
1986 1987 1988 1989 1990 1991 1992 1993 1994 1995 1996 1997 1998 1999 2000
1/ The price at which power is sold to the DoP. DoP applies different tariff rates for domestic power supply.
Source: Data provided by the Bhutanese authorities.
The tariff for power to be exported from the Tala project, in contrast, will likely be determined at the commission level and take generation costs into account. Therefore it is expected to be closer to the market price. Payments for power sales, as well as all other imports and exports between Bhutan and India, take place in the Indian rupee according to the bilateral free trade agreement between the two countries.
The Government ofIndia (GoI) has provided financial assistance (in the Indian rupee) for the construction of all major power plants, except the Basuchu project, which was built for domestic purposes only and was financed by Austria. Each GoI financing consists of 60 percent grant elements and 40 percent soft loan elements.
Chukha Hydropower Corporation is a government-owned corporation that is managed by the Department of Power in the Ministry of Trade and Industries. It is not a foreign direct investment from India. The export proceeds realized by the corporation are channeled to the Government via surplus transfers, corporate taxes and dividend payments. All the investments in the power sector are recorded outside the government budget.
Under the Electricity Act approved by the National Assembly in July 2001, the utility side of the Chukha Hydropower project was corporatized in July 2002. A regulatory body, the Bhutan Electricity Board, was also set up at this time. All other power plants, including those to be commissioned in the future (such as the Tala project), will be merged into Chukha Hydropower Corporation
Because of Bhutan's long-term sales agreement with India, electricity export earnings from India will continue to be a permanent source of income to Bhutan. The risks of reduced demand from India is likely to be very small. At present, Bhutan supplies less than 0.5 percent ofIndia's demand. While internal demand in Bhutan will also rise substantially with progress in the Rural Electrification Program (supported by the Asian Development Bank), the rise in Bhutan's power generating capacity (when the Tala project is completed) is expected to meet both Bhutan's expected demands and a larger part of India's as well. The risks of sharp contractions in electricity supply as a result of technical and climate change are also considered to be low. 11
Bhutan's power plants are operated as run-of-the-river schemes and are environmentally benign.
Unlike other natural resource export booms based on exhaustible resources (such as oil, gas, coal, copper), Bhutan's hydropower is renewable and environmentally friendly, constituting a
permanent resource for exports. Looking ahead, the power sector is expected to continue to be the main engine of growth in the country and a source of significant rupee earnings.
3.1.2 Impacts on National Income
Regular power exports to India since 1987 have permanently raised the level of Bhutan's national real income.
11 However, in May 2002 the power generation ofthe Kurichhu project was severely disrupted by a heavy storm, which damaged two transmission towers and two conductors. The damages also disrupted the supply of power from Kurichhu to India, causing a revenue loss of about Nu.8 million, equivalent to US$170,000 or 11 days of power generation from the Kurichhu project.
Figure 6. Bhutan: GDP Growth Rate (in percent per annum)
20 , -- - - ,
15
10
5
Figure 7. Bhutan: Index ofGDP (1980 = 100)
400 .---~---__,
350
300
250
200
150
· ··· · · · · L . t . <
... Permanent increase in
real income
Source: RMA Annual Reports (various issues.)
A plotting of the real annual growth rate of GDP in Bhutan for the period 1980-2000 shows a large spike (18 percent) in 1987, followed by a sharp decline to one percent in the following year, indicating that the regular power exports to India had a large "level effect" on GDP (Figure 6).
However, the magnitude of the level effect should not be over-emphasized. First, fiscal yearl987 was 15 months long (April 1, 1987 - June 30, 1988) due to the transition from old fiscal years (April 1 - March 30) to new ones (July 1 - June 30) that occurred in 1988. Strictly speaking, therefore, the growth rate in 1987 is not comparable to that of other years. If equally
appropriated, the 12-month growth rate of the fiscal year 1987 could have been around 14 percent.
The index of GDP shown in Figure 7 indicates that the "accelerating effect" on the growth rate may have been marginal during the initial years after the power export had began. In the late
1990s GDP grew at an accelerating rate as the result of the tariff revisions.
3.1.3 Impacts on Government Revenues
Power exports have also contributed significantly to a rise in government revenues through increases in the corporate tax revenue, surplus transfers and dividend payments from Chukha Hydropower Corporation.
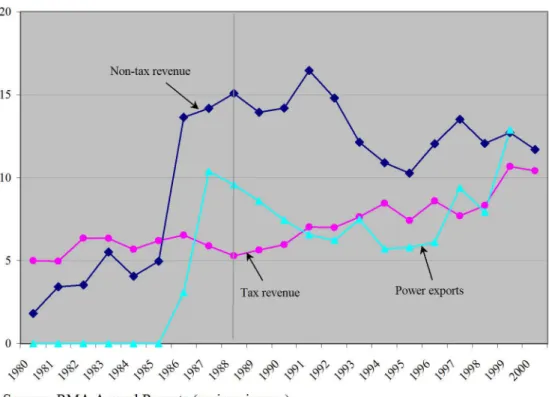
Figure 8 shows government tax and non-tax revenues together with power exports as percent of GDP over the last two decades. Although the Government does not publish the breakdown of revenues, it is evident from Figure 8 that there is a high correlation between government non-tax revenue and power export proceeds. The level of government non-tax revenue has risen
significantly since 1987, most likely as a result of surplus transfers and dividend payments from Chukha Hydropower Corporation. In contrast, government tax revenue has risen gradually over time.
The overall fiscal position was more or less balanced during the 1990s (see Figure 9). From 1998 on, however, the fiscal position began to deteriorate. The fiscal deficit widened significantly from 1.9 percent ofGDP in 1998 to 4.0 percent ofGDP in 1999, and further to 6.1 percent of GDP in 2000. This fiscal easing is viewed as a reflection of increased capital expenditures related to the construction of new power projects, which are temporary in nature and financed exclusively by foreign aid.
3.1.4 Impacts on External Positions and Reserves
Because of the special relationship with India, Bhutan maintains two sets of external accounts:
one with India denominated in the Indian rupee, and the other with countries other than India, or the "third countries" in the Bhutanese term, denominated in the US dollar.
(i) Current Account
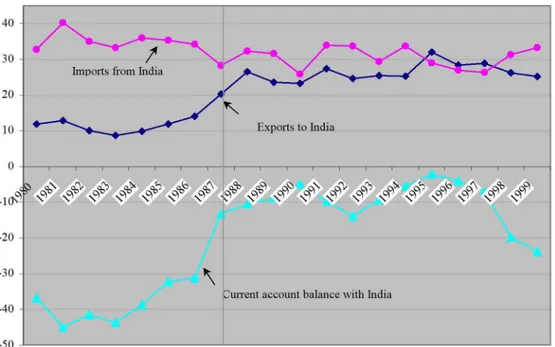
Bhutan's current account position with India has improved markedly as a result of regular power exports. While Bhutan has continued to run a current account deficit with India throughout the past two decades, the magnitude of deficit has shrunk considerably since regular power exports began in 1987 - from the average of38.4 percent ofGDP for 1980-86 to the average of 10.2 percent ofGDP for 1987-99 (see Figure 10). Between 1995 and 1997 net exports (trade balance) were even in surplus, but larger net transfer payments kept Bhutan's current account balance with India from turning positive.
Figure 8. Bhutan: Government Tax and Non-tax Revenues and Power Exports (as percentage of GDP)
20 .---~---__,
Non-tax revenue 15
10
5
Tax revenue Power exports
""I:) ",," :bv ",,'" ~ ",," ""b ~ ",,'b ~ AI:) A' A"" A'" At>< A" Ab A'" A'b AC) ~C'.I:)
~ ~ ~ ~ ~ ~ ~ ~ ~ ~ ~ ~ ~ ~ ~ ~ ~ ~ ~ ~ f Source: RMA Annual Reports (various issues.)
Figure 9. Bhutan: Fiscal Development (as percentage ofGDP)
60 .---~---__,
50
40
30 Govemment revenue
I I
(ina!. grants 1/) 20
10
f
Government expenditure (inc!.
net lending)
Fiscal balance
-20 ~---~---~
1/ Grants are both from India and countries other than India.
Source: RMA Annual Reports (various issues.)
Figure 10. Bhutan: Current Account Transactions with India (as percentage ofGDP)
40
30
20
10 Exports to India
-20
-30
urrent account balance with India -40
-50 ~---~---~
Source: RMA Annual Reports (various issues.)
Figure 11. Bhutan: Net Capital Inflows from India and Power Export Revenues (as percentage of GDP)
50
40
30
20
10 Power export revenue
Net catpial flows from India 11
~~~~~~~~~~~~~~~~~~~#
~ ~ ~ ~ ~ ~ ~ ~ ~ ~ ~ ~ ~. ~ ~
"
~ ~ ~"
Source: RMA Annual Reports (various issues.) 1/ Consist of concessionalloans and grants.
Figure 12. Bhutan: Balance of Payments (as percentage ofGDP)
20 , ---,---,
15
BoP w( third cOlUltries 10
5
-5
BoP wi India
-10 L -____________________ ~~ __________________________________ ~
Source: RMA Annual Reports (various issues.)
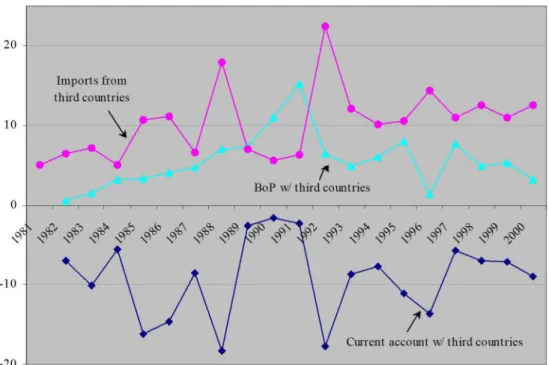
Figure 13. Bhutan: Current Account and Balance of Payments with Third Countries (as percentage of GDP)
20
10
-10
Imports from third cOlllltries
Cnrrent accollllt wi third cOlllltries
-20 L -____________________________________________________________ ~
Source: RMA Annual Reports (various issues.)
Figure 14. Bhutan: Net Capital Inflows by Countries of Origin (as percentage ofGDP)
70 ~---,
60
6:' 50
o o '2F
<n 40
~
~ o
<:::
3 30 '0..
"
u
"
Z 20
10
from third countries
from India
o +-~--'-~---r--r--r--~~--~~--'-~---r--r--r--~~--'-~--4
~ ~ ~ ~ ~ ~ ~ ~ ~ ~ ~ ~ ~ ~ ~ ~ ~ ~ ~ ~ ~
~ ~ ~ ~ ~ ~ ~ ~ ~ ~ ~ ~ ~ ~ ~ ~ ~ ~ ~ ~ f Source: RMA Annual Reports (various issues.)
Figure 15. Bhutan: Net Capital Inflows (in millions ofngrultrum, constant 1980 prices)
<n
'"
.g
0- o
00
1,200 ,..---,
1,000
~ 800
from India
200
Source: RMA Annual Reports (various issues)
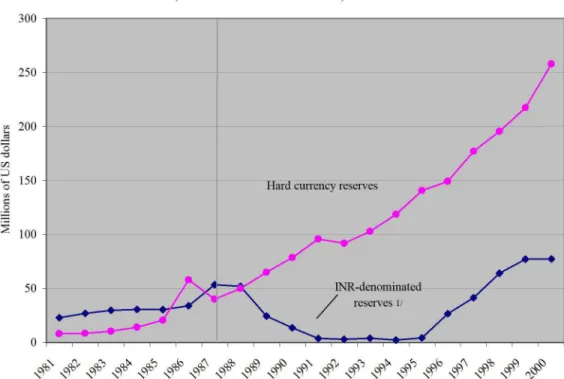
Figure 16. Bhutan: Gross Rupee and Hard Currency Reserves (in millions of US dollars)
300 ~---.---,
250
'" 200
~ o
"0 (/)
:J
<.;... 150
o '"
~ t:
~ 100
50
Hard currency reserves
1/ Rupee-denominated reserves are converted to the US dollar using the nominal exchange rate.
Source: RMA Annual Reports (various issues).
Beginning in 1996, however, Bhutan's current account deficit with India began to widen. The current account position worsened from -2 percent of GDP in 1995 to -24 percent of GDP in 1999. It is clear that power exports had a positive effect on Bhutan's current account position up to 1995, but thereafter the net effect is ambiguous. Data indicate that imports of machinery, transport, mechanical appliances, and mineral products as well as base metal and base metal products have grown sharply since 1998. These are viewed to reflect increased imports of capital goods and intermediate goods related to the construction of new power projects and thus are temporary. However, in the absence of dis aggregated data, the source of the increased current deficits is not clear.
Data also indicate that imports of non-durable consumer goods (in particular food items) have grown substantially, although a strict distinction between imports of consumer goods and capital goods is often difficult. 12 It is likely that power exports have fueled private consumption through the income effect. The Bhutanese authorities expect this trend to continue.
(ii) Balance of Payments
Notwithstanding the persistent current account deficits, Bhutan's balance of payments with India has been in significant surplus most of the time, except for the 1989-92 and 1994 periods. This has been attributed to large net capital inflows from India, comprising concessionalloans and
12 The Bhutanese authorities noted that most of the economic growth for the past 5 years have been used to increase private consumption.
grants.13 The magnitude of net foreign aid inflows has been large enough not only to finance current account deficits but also to turn the balance of payment position into a significant surplus.
Figure 11 shows how large the aid flows from India have been in comparison to power exports.
In the early 1990s, when India suffered a balance of payments crisis, net capital inflows from India plunged sharply, causing deficits in Bhutan's balance of payments with India (see Figure
12). Even during this time, the magnitude of capital flows from India was still larger than power export revenues, although Bhutan's BoP deficit with India could have been 4-5 percent worse had there been no power exports. During this period, Bhutan financed its BoP deficit with India by running down the rupee reserves (see Figure 16). At the same time, imports from third countries were compressed significantly (see Figure 13) and Bhutan actively sought financial assistance form other countries (Figure 14), raising the US dollar BoP surpluses. The sharp rise in aid inflows from India in the late 1990s (Figure 15) reflects increased concessional financing for the construction of the 1,020MW Tala hydropower project, which is viewed as a short-term
phenomenon.
(iii) International Reserves
Reflecting the strong BoP position with India, Bhutan has accumulated sizable rupee reserves (see Figure 16). Gross rupee reserves increased from RS.71 million (US$2.3 million) in 1994 to RS.3.6 billion (US$77 million) in 2000, equivalent to nearly 26 months of imports from India.
Hard currency reserves have also increased steadily, reaching US$260 million in September 2000, equivalent to 6 moths of imports from countries other than India. Although Bhutan's international reserves may appear large when measured by months of imports, the authorities are concerned that purchase of two new aircraft planned in 2002/03, for example, would easily use up a large part of the country's hard-currency reserves, and noted that more reserve accumulation would be necessary to reach a comfortable level.
3.2 Power Exports and Real Exchange Rates
Have the increased power exports affected Bhutan's real exchange rates? If so, how has it happened?
Understanding the relationship between power exports and the exchange rate is very important to Bhutan's future macroeconomic management. Note that the country's power export earnings will triple within the next few years. If increased power exports have caused significant effect of appreciating the ngultrum against the rupee in the past, it is likely that the real exchange rate of the ngultrum will be significantly affected by the tripled power export earnings expected in the coming years. If the effect is deemed significant, the Government may need to counter these effects with appropriate policy responses.
This subsection answers the question raised above in four steps. First, as background
information, the exchange arrangement in Bhutan is discussed. Second, the historical behavior of the ngultrum's real exchange rates is presented. In the third step, the historical movement of the exchange rate is compared with the historical movement of power exports. Finally, a formal statistical analysis is conducted to examine the relationship between the real exchange rates and power exports.
13 Since Bhutan receives no private capital inflows, except a very small scale ofFDI, this paper uses capital inflows and foreign aid inflows (which consist of concessionalloans and grants) interchangeably.
3.2.1 Bhutan's Exchange Rate System
Bhutan operates under a fixed exchange regime. Reflecting its special trade relationship with India, Bhutan's currency, the ngultrum, is fixed at par to the Indian rupee, which also circulates freely within Bhutan (as legal tender) and is the currency in which the bilateral trade between the two countries takes place. Goods move freely between the two countries, with India accounting for more than 80 percent of Bhutan's total trade and a substantial portion of its foreign aid.
Trade with countries other than India takes place in the US dollar and is an important source of hard-currency earnings for Bhutan. Since the exchange rate of the ngultrum against the rupee is one, the exchange rates of the ngultrum to the US dollar as well as to other non-rupee currencies are the same as the rupee exchange rates, which are determined on the basis of the prevailing quotations by the State Bank ofIndia for those currencies.
3.2.2 Bilateral Real Exchange Rates (BRER)
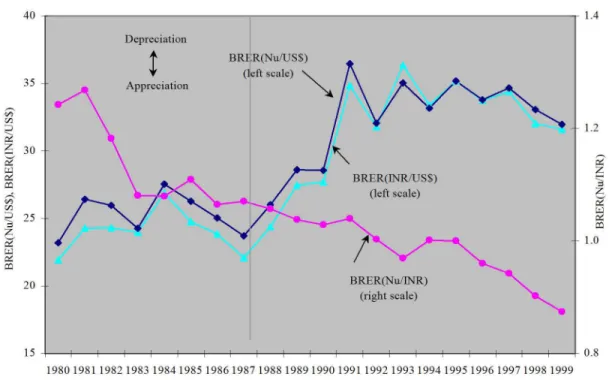
Figure 17 shows the WPIICPI-based bilateral real exchange rates of the ngultrum against the Indian rupee, BRER (Nu/INR), and against the US dollar, BRER(Nu/US$), as well as the bilateral real exchange rate of the rupee against the US dollar, BRER(INRlUS$), for the period
1980-99 (see Appendix 1 for the measuring ofBRER). Figure 17 indicates that BRER(NU/INR), which is calculated using India WPI as a proxy for the prices of tradables and Bhutan CPI for
~
""
r/J
:J
~
Ot ~
P:l
~
""
r/J
:J ':3
~ U;l
~ P:l
Figure 17. Bhutan: Bilateral Real Exchange Rates 1/
40 -,-- - - , - - - --y- 1.4 Depreciation
35 Appreciation
30
25
20
BRB:R(Nu/US$)
(left scale)
BRER(Nu/INR) (right scale)
1.2
15 +-_+-~~-~~-~-~~-~_r-r__+-+__+-+__+-~~-~-+0.8
198019811982198319841985198619871988198919901991 1992 1993 1994 1995 1996 1997 1998 1999
1/ The bilateral real exchange rates are calculated using CPI and WPI (base year = 1995).
Source: RMA Annual Report, IMF International Financial Statistics and World Bank staff estimates.
Table 1. Cross-country Comparison: Bilateral Real Exchange Rate Variability
Country Bhutan Venezuela Nigeria Colombia
Exported commodity Electricity Oil Oil Coffee
Exchange variability II 0.04 24.7 34.2 9.8
Period 1980-99 1980-00 1980-00 1980-00
II Measured as the standard deviation ofthe real exchange rate changes during the specified period.
Data source: IMF International Financial Statistics and World Bank staff estimates.
the prices ofnon-tradables, has been on the downward trend since 1981, meaning real appreciation of the ngultrum against the rupee. Given the fixed exchange rate, the real
appreciation was driven primarily by the difference between Bhutan's CPI and India's WPI (see Figure 18). Between 1981 and 1999, the ngultrum appreciated by 45 percent against the rupee in real terms. The real appreciation was particularly rapid during 1981-83; the ngultrum appreciated by about 8 percent annually. On the other hand, 1984-94 saw a more gradual rate of real
appreciation. The average annual real appreciation was 0.7 percent during this period. The appreciation accelerated again beginning in 1995, with the average annual appreciation being 2.5 percent for 1995-99.
It should be noted that BRER(NU/INR) has shown a very steady movement, but not a volatile movement, as often seen in natural resource exporting countries. The exchange rate variability measured by the standard deviation of the BRER(Nu/INR) for the entire sample period is 0.02.
This is significantly lower than that of other countries which experienced oil or coffee export booms in the 1980s (Table 1).
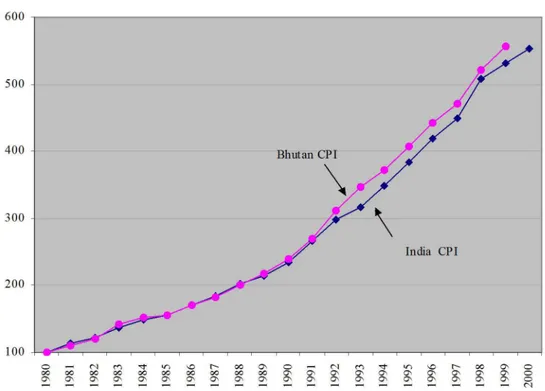
Figure 17 also shows a depreciating real exchange rate of the ngultrum against the US dollar, which is driven mainly by the real depreciation of the rupee against the US dollar. The sharp real depreciation of the rupee and the ngultrum to the US dollar in the early 1990s was driven by the balance of payments crisis of India. Note that BRER(Nu/US$) follows BRER(INRlVS$) very closely. By definition, the gap between the two series represents a difference in CPI between Bhutan and India (see Figure 19), since the nominal exchange rate of the ngultrum to the rupee is one.
3.2.3 Bilateral Exchange Rates and Power Exports
Now that we have the historical behavior of the ngultrum real exchange rate, we are ready to examine its relationship with power exports. Hereafter, we focus only on the bilateral real exchange rate of the ngultrum against the Indian rupee. Given that Bhutan's primary trade partner is India, with whom power trade takes place, the exchange rate of the ngultrum to the rupee assumes more importance than any other rates. Unless otherwise specified, hereafter the
"exchange rate" refers to the bilateral real exchange rate of the ngultrum to the rupee,
BRER(NU/INR). Similarly, "real appreciation" refers to real appreciation of the ngultrum against the rupee.
Figure 20 plots both BRER(NU/INR) and real power exports from India for 1980-99. In Figure 20, there seems to be a negative relationship between the two series, that is, power exports seem to be negatively associated with real appreciation of the ngultrum against the rupee. While real
Figure 18. Price Indices: Bhutan CPI and India WPI (1980 = 100)
600 r---~
500
~" ~ ~'" ~ ~~ ~b ~ ~'b ~o, ~~ ~" ~"v ~'" ~b< ~~ ~b ~'\ ~'b ~o, s;:,~
~ ~ ~ ~ ~ ~ ~ ~ ~ ~ ~ ~ ~ ~ ~ ~ ~ ~ ~ ~ ~
o ~---~
Source: IMF International Financial Statistics.
Figure 19. Price Indices: Bhutan CPI and India CPI (1980 = 100)
600 , ---,
500
400 Bhutan CPI
\
300
\
India CPI 200
Source: IMF International Financial Statistics.
Figure 20. Bhutan: BRER(NU/INR) and Power Exports to India (in millions of ngultrum, constant 1980 prices)
l.3 -,--- - - ----,- 500
1.2
1.1
0.9
BRER(NuIINR) (left scale)
Real power exports to India (right scale)
400
~ en
"
.g
0-
300:31:
0-,
2- '"
"-Z 200 o en t:
100
~ ~
0.8 -H~ ... t_4I>_+ ... t_4I>_+4-1__t_-1__t_____1-_I_____1-_+__t-_I___r-+___r-_I_--+ 0
Source: Data provided by the authorities and World Bank staff estimates
appreciation started before the country began to receive regular power export income in 1987, the rate of appreciation accelerated in the late 1990s, when Bhutan's power export earnings increased substantially due to tariff revisions.
3.2.4 Empirical Analysis: Determinants of Bilateral Exchange Rate ofthe Ngultrum To examine this relationship more formally, we have conducted a regression analysis using annual data for 1983-99, which is the longest period for which all variables are available. 14 The details of the empirical analysis are provided in Appendix 2. Here we present only the main findings.
The regression results indicate that increases in power exports have indeed caused real
appreciation of the ngultrum over time. Both the power tariff (in real terms) and the volume of power exports appear to have contributed to the appreciation, implying that future increases in either variable are likely to cause further appreciation of the ngultrum.
The results also suggest that the real appreciation took place through the accumulation of international reserves (monetary effect), which have largely been affected by net capital inflows
14 While data on other variables are available for 1981-99, the monetary data are available only from 1983 onwards.