P olicy R eseaRch W oRking P aPeR 4776
Community Participation in Public Schools
The Impact of Information Campaigns in Three Indian States
Priyanka Pandey Sangeeta Goyal Venkatesh Sundararaman
The World Bank South Asia Region
Human Development Department November 2008
i
mPacte
valuations
eRiesn
o. 26
WPS4776
Public Disclosure AuthorizedPublic Disclosure AuthorizedPublic Disclosure AuthorizedPublic Disclosure Authorized
Abstract
The Impact Evaluation Series has been established in recognition of the importance of impact evaluation studies for World Bank operations and for development in general. The series serves as a vehicle for the dissemination of findings of those studies. Papers in this series are part of the Bank’s Policy Research Working Paper Series. The papers carry the names of the authors and should be cited accordingly. The findings, interpretations, and conclusions expressed in this paper are entirely those of the authors. They do not necessarily represent the views of the International Bank for Reconstruction and Development/World Bank and its affiliated organizations, or those of the Executive Directors of
Policy ReseaRch WoRking PaPeR 4776
This study evaluates the impact of a community-based information campaign on school performance from a cluster randomized control trial. The campaign consisted of eight to nine public meetings in each of 340 treatment villages across three Indian states to disseminate
information to the community about its state mandated roles and responsibilities in school management. The findings from the first follow-up 2–4 months after the campaign show that providing information through a structured campaign to communities had a positive impact in all three states. In two states there was a significant and positive impact on reading (14–27 percent) in one of the three grades tested; in the third
This paper—a product of the Human Development Department , South Asia Region—is part of a larger effort in the department to promote rigorous studies which can inform policy. Policy Research Working Papers are also posted on the Web at http://econ.worldbank.org. The author may be contacted at ppandey@worldbank.org.
state there was a significant impact on writing in one grade (15 percent) and on mathematics in the other grade tested (27 percent). The intervention is associated with improvement in teacher effort in two states. Some improvements occurred in the delivery of certain benefits entitled to students (stipend, uniform, and mid day meal) and in process variables such as community participation in each of the three states. Follow-up research needs to examine whether there is a systematic increase in learning when the impact is measured over a longer time period and whether a campaign sustained over a longer time is able to generate greater impact on school outcomes.
Community Participation in Public Schools: The Impact of Information Campaigns in Three Indian States
Priyanka Pandey, Sangeeta Goyal and Venkatesh Sundararaman∗
∗South Asia Human Development, World Bank. This work benefited from generous financial support from the EPDF trust fund and by Government of the Netherlands through the BNPP program. We are extremely grateful to the Nike Foundation for generous financial support and advice in the development of campaign tools. We thank Nazmul Chaudhury, Amit Dar, Stuti Khemani, Michelle Riboud and Michael Ward for very helpful comments. We are grateful to the Ministry of Human Resource Development and the respective Departments of Education in Karnataka, Madhya Pradesh and Uttar Pradesh for extending their cooperation.
1. Introduction
Learning outcomes have recently gained increasing importance in the policy debate on basic education in developing countries. Findings reveal that in countries such as India although 93 percent of children ages 6-14 are in school, learning achievements are low.
According to the Annual Status of Education Report (ASER) in 2005, 67 percent of Indian children in grades 3 to 5 cannot read simple text. The problem of poor quality outcomes is a more general one and is not limited to the education sector. Various public services across many countries suffer from poor quality (Global Corruption Report, 2006;
World Development Report, 2004).
Targeting resources efficiently to communities and getting public workers to perform their tasks have remained a challenge for several public services in developing countries.
This challenge is thought to be due to weak mechanisms of accountability in public service delivery, resulting in dysfunctional services. Chaudhury et al (2006) document provider absence rates among publicly funded health workers and school teachers in six developing countries- Bangladesh, Ecuador, India, Indonesia, Peru and Uganda. Absence rates in these countries range from 11 to 27 percent among primary school teachers.
Despite these high rates, health workers and teachers are rarely held accountable for their absences.
Clearly, interventions that provide physical resources alone are not enough to improve outcomes if workers delivering the service do not perform as expected. The notion of grass roots participation by the community in local monitoring has gained prominence in recent years and is regarded as key in improving public service delivery (World Development Report, 2004). The idea behind this approach is that since the community is the direct beneficiary of these public services, it has a greater incentive to monitor the services than the state or district governments. However there are potential problems with this approach. Monitoring public services is a public good and therefore may be subject to free rider problems. It may also be prone to capture by local elites. Whether or not community participation actually works to improve service delivery is an empirical question.
With the intention of increasing service providers’ accountability to the local community, a number of developing countries including India are decentralizing control over local public services to local communities. Many Indian states have devolved control over schools to the local communities, through greater involvement of village education committees and parent-teacher associations in school oversight roles. However, anecdotal reports and survey-based evidence indicate that communities and members of the local governments are often uninformed of what services they are entitled to and what state mandated controls they have over these services (CAG report, 2001; Bardhan and Mukherjee, 2005; Banerjee et al, 2006). Although it is mandatory for the communities to oversee service delivery, our baseline survey also reveals that village education committee meetings are rarely held and the community is neither aware of nor participating in its oversight roles especially in two of the three states where the study was conducted. High teacher absence rates recorded in a number of Indian states in
recent studies confirm that teachers continue to have low levels of accountability and motivation.
Providing information that empowers stakeholders may be one way to stimulate public participation towards increasing the demand for quality services. In recent work Reinikka and Svensson (2004) provide evidence on the effect of a newspaper campaign initiated by the Ugandan government to boost the ability of schools and parents to monitor local officials’ handling of a large school grant program. They find that publishing in the newspaper diversion of primary school funds reduced capture of school funds from 80 percent to 20 percent. However informational campaigns that involve a consistent and replicable intervention, random assignment to intervention, and rigorous evaluation of outcomes are lacking.
This study is an evaluation of a community-based randomized controlled trial to determine the impact of information dissemination on learning and other school outcomes. The information campaign gave information to the community, village education committees and parent teacher associations on their oversight roles in school management as well as the services they are entitled to. Our hypothesis was that school outcomes may improve if the community has detailed information about the control it has over the schools and the services parents are entitled to from the school. The study was conducted in three Indian states, Karnataka, Madhya Pradesh (MP) and Uttar Pradesh (UP). Even though all three states have devolved oversight roles to the community, they differ in the extent of oversight devolved.
The magnitude of the impact of such an intervention will depend on several factors.
First, changing attitudes and practice patterns require ample time to take place, since they have been a way of life for decades. This is perhaps the greatest limitation of the current study, in which we are measuring outcomes after only two to four months. The exact nature of the intervention, the extent of oversight the community has over schools, and the extent of public action in response to the campaign will also be important. The relative population proportions and interests in public services of the different groups in the community will be one of the determinants of public action. If local elites do not have a stake in public services’ outcomes, public action may be captured (Bardhan and Mukherjee, 2002).
In Karnataka, a second intervention was added to encourage greater demand for quality schooling. In addition to the information on community oversight roles given in the first intervention, 1) the community was given information on the economic benefits of schooling and 2) there was explicit advocacy to the community in campaign meetings to monitor learning in schools. All else including the execution of the campaign remained identical between the first and second interventions.
The evidence from randomized evaluations so far on this topic is mixed. A recent randomized study in the Indian state of UP with a 5-6 month follow-up period found no impact of information on learning outcomes (Banerjee et al, 2006). The information was on the oversight roles of the community over public schools and was given by the village
head in a village meeting organized for the purpose. Another study in India, also in UP, with a one-year follow-up finds a positive impact of information on receipt of health and other social services, based on self-reported outcomes (Pandey et al, 2007). The information given was on the oversight roles of the community with respect to health services, schools and village governance. The standardized campaign was done through several repeat village meetings over a period of 2 months and was structured to disseminate the information uniformly across villages via tools such as audio tape, posters and take-home leaflets. The results from these studies are not strictly comparable due to differences in campaign structure and outcome measurement. For this research agenda to inform policy dialogue, clearly more research is needed that is based on replicable ways of information dissemination, objective outcome measurement and follow up surveys over longer periods to see if impacts are sustainable.
In this study, based on a follow-up survey 2-4 months after the campaign, we find a positive impact in all three states, although there are differences in where the impact occurs. In both MP and UP, there is a positive impact of the campaign on reading in one of the three grades tested. In Karnataka, the average impact of both the interventions is positive on writing in one grade and on mathematics in the other grade tested. There are significant improvements in behavioral variables such as teachers’ engagement in teaching in MP and teacher attendance in UP. In Karnataka where teacher attendance and engagement in teaching at baseline were much higher than in the other two states, there is no observed impact on teacher effort. There is no additional impact of the second intervention that involved an added advocacy element compared to the first intervention in Karnataka.
The team intends to continue the study to examine if learning shows a systematic increase when the impact is measured over a longer time period and whether a campaign sustained over a longer time generates greater impact on school outcomes.
Section 2 describes the context and background for the study. Section 3 describes the methodology, section 4 presents findings from the baseline survey, section 5 provides results on the impact of the campaign and section 6 discusses the results.
2. Background and Context in India
Since the mid 1990s, Indian states have decentralized control over local public services to the immediate communities, intending for improved accountability. The 73rd amendment to the Indian constitution in 1992 made it mandatory for Indian states to devolve control over public services and over funds for these services to the local government (called the gram panchayat1). However it was left up to the states as to how much control to devolve. As a result, various states in India have devolved control over services to different extents.
1 A gram panchayat is the lowest administrative unit consisting of two to three revenue villages on average.
The elected village government (gram panchayat council with the gram pradhan as its head) is formed at the gram panchayat level.
In parallel, another dimension of devolution has been that a number of Indian states trying to expand education rapidly have enacted policies to recruit contract teachers, often hired by local communities. These teachers are being hired at lower salaries and on more flexible, short-term contracts. In some cases, parents and community members participate in both their selection and performance monitoring such as attendance. This is meant to increase teachers’ accountability to local communities. A brief description of the school oversight committees and their oversight roles and responsibilities in the three states is below.
Madhya Pradesh A parent teacher association (PTA) is mandatory in every school and parents of all children enrolled in the school are members. The PTA has an executive committee which runs the PTA, though all parents are supposed to participate in decision making. The school headmaster is the secretary of the PTA and a parent is the chair. The executive committee has 14 members who elect the PTA chair from among them. The PTA chair and the head teacher jointly operate the school account. The school account receives annual grants for repair and maintenance, for school development, teaching learning material (TLM), money for school dress, money for civil works- school building, rooms, toilet, drinking water etc and money for mid day meal. The PTA is supposed to manage and monitor funds coming to the school accounts, determine how to use and give consent for use of these funds, request additional funds if civil work etc are required, keep record of accounts, verify/sign on every teacher’s attendance in order for teacher’s monthly salary to be released. The contract teachers (called samvida shikshak) are hired on a 3 year renewable contract by the block panchayat. Applicants have to satisfy eligibility criteria (education, residence, reservation if any by caste, gender) and are expected to be selected according to qualification (grade attained in an exam for all applicants, grades obtained previously, interview with block panchayat). There are former contract teachers (called shiksha karmi) in MP who have been made permanent recently, except that their salaries are much lower than that of regular civil service teachers. Regular teachers and shiksha karmis are no more being recruited.
Karnataka Every school has a mandatory school development and monitoring committee (SDMC). The SDMC members include the head teacher of the primary school, elected members of the village government and parents of children. One of the parents is the chair of SDMC. SDMC chair and the head teacher jointly operate the school account. The types of funds received in the school account are similar to those in the case of MP. PTAs exist but do not have any explicit control over the schools. SDMC is supposed to call a meeting of all parents every 3 months to discuss trimester exam results. There are no contract teachers in Karnataka. The SDMC can inspect the schools and complain to the district or block education office.
Uttar Pradesh A village education committee (VEC) is mandatory in every gram panchayat. There is one VEC for all the primary and junior government schools in the panchayat. The VEC typically has 5 members – it is headed by the gram pradhan (who is the elected head of the village government). Other members include the
senior most head teacher among the schools, and three parents of children in these schools. The pradhan and the head teacher jointly operate the school account. The school account receives annual grants for repair and maintenance, school development, TLM, money for school dress, money for civil works- school building, rooms, toilet, drinking water etc if authorized and contract teachers’ salary. The gram panchayat account which is cosigned by the VEC head receives scholarship funds and mid day meal funds. The VEC is supposed to manage and monitor funds coming to the school account and to the gram panchayat account (funds earmarked for the school), determine how to use and give consent for use of these funds, request additional funds if civil work etc are required, keep record of accounts, and select contract teachers (called shiksha mitras). An additional contract teacher can be hired if the pupil-teacher ratio in the school exceeds 40, up to a maximum of two contract teachers and up to a maximum ratio of 3:2 of regular to contract teachers. For selection of contract teachers, VECs are required to follow state guidelines outlining eligibility criterion (18-35 years of age, minimum education of grade 12, preferably a resident of the gram panchayat2, and if there are reservations by caste, gender) and are expected to rank applicants in order of qualification (grades obtained in grade 12, 10). The contract is for a 10 month period and VEC decides whether to renew the contract to the next year. With a two-thirds majority, the VEC can remove the contract teacher anytime during this contract.
3. Methods Setting
This study is a cluster randomized controlled trial of 610 gram panchayats (GPs) across three states, Karnataka, MP and UP, randomly allocated to receive or not receive the treatment which is an information campaign. A GP is a cluster of approximately 1-3 adjacent villages and is the smallest unit of local government, which consists of an elected head and council members.
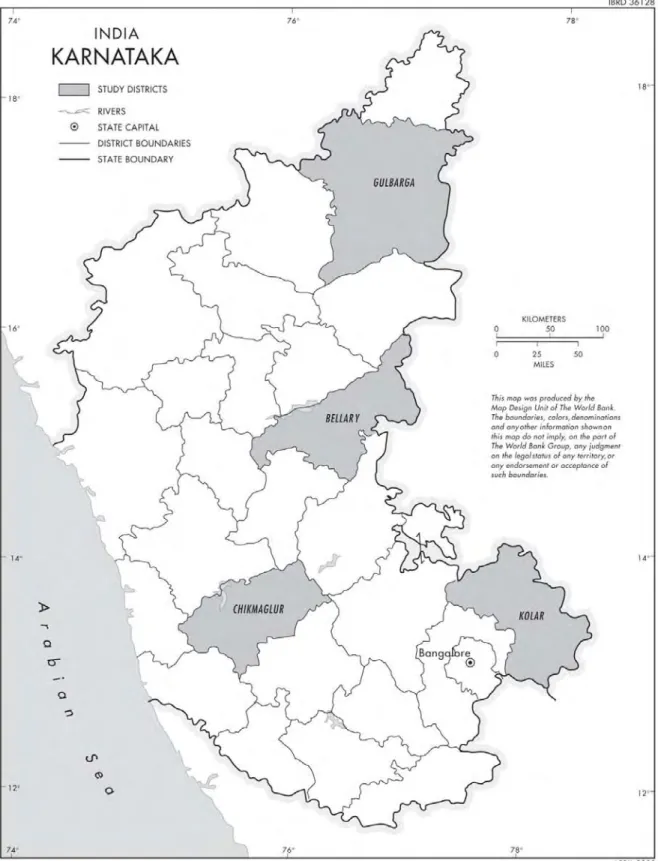
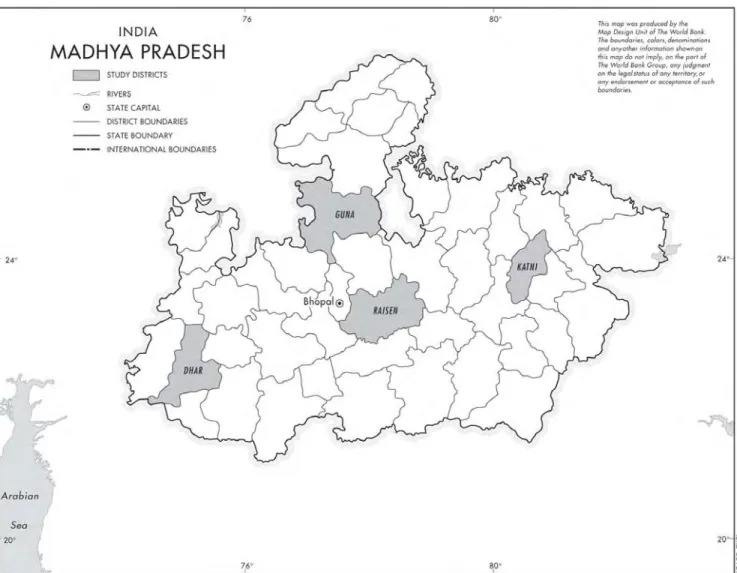
The trial was conducted from February 2006 to August 2007. In each state four districts were chosen purposefully, matched across states in terms of the literacy rate (Figures 2- 4). The districts in order of literacy rate going from low to high literacy are: Sitapur, Pratapgarh, Hathras and Kanpur Dehat in UP, Dhar, Guna, Katni and Raisen in MP, Bellary, Gulberga, Kolar and Chikmagalur in Karnataka (Table 1).
Within a district, 50 gram panchayats (GPs) were randomly selected from two randomly chosen blocks. A block is an administrative unit between a district and a GP. Of these, 25 GPs were randomly chosen to be in the treatment group and another 25 were kept to serve as control. This gives a total of 100 control GPs and 100 treatment GPs per state.
We used a random number generator to randomly select the blocks and then GPs within the blocks. The GPs within each block were then randomly assigned to intervention and
2 If the VEC cannot find a suitably qualified candidate within the gram panchayat, it can consider candidates from neighboring panchayats.
control arms. Treatment and control GPs were evenly spread across the two blocks to reduce any potential contamination between intervention and control villages.3
In Karnataka the design was identical except an additional set of treatment villages was added that received a slightly different treatment- information and advocacy campaign.
The number of GPs in each of the three cells in Karnataka (control, treatment 1 (information campaign), treatment 2 (information plus advocacy)) is 70.
Sample sizes were determined using cluster randomized sample size calculations based on a 5 percent significance level and 80 percent power. Figure 1 describes the flow of study participants through the trial.
Timeline In MP and UP, baseline surveys were administered between February and April 2006. The interventions were carried out from September to November 2006 and follow up surveys were administered between February and April 2007. Karnataka had a shifted timeline due to different school year timing. Baseline surveys in Karnataka took place between July and August 2006, the interventions were carried out from February to April 2007 and follow up surveys were done between July and August 2007.
Baseline survey One randomly selected public primary school in every GP was chosen for the survey. All teachers teaching grades 1 to 5 are in the sample. In MP and UP, 45 randomly chosen students per school (15 each from grades 2-4) and in Karnataka 30 randomly chosen students per school (15 each from grades 4-5) are in the sample (within each grade, 5 each from Scheduled caste (SC)/scheduled tribe (ST), other backward classes (OBCs) and other category (consisting of general or high castes). Half were chosen to be girls in each grade and category. The school enrollment registers were used for random selection of students. Sometimes a given grade had less than the required number of students from a given category for the sample. In these cases, a total of 15 students were selected from the grade to maintain the overall sample size. This resulted in a slightly uneven distribution of SC/ST versus OBC and general category students. We used the state government’s definitions for caste (see the list of references).
The surveys were conducted by in-person interviews by a team of trained research assistants with prior experience in administering rural household surveys in the region.
Surveys were conducted in local languages: Hindi in MP and UP and Kannada in Karnataka. Instruments were pilot tested prior to use.
Outcomes measured in baseline survey
• Teacher attendance and activity: Four unannounced visits were made per school with a 2 to 3 week gap between two consecutive visits to collect information on teacher attendance and activity. Teacher attendance on each visit is 1 if teacher is present in school, 0 otherwise. Activity is a measure of whether a teacher is
3 Although districts with varying literacy rates are chosen to be in the sample in each state, the sample design is not meant to represent the state but to provide enough statistical power for a valid assessment of the impact of the intervention in each state.
actively engaged in teaching when the survey team arrives unannounced. Teacher activity on each visit is 1 if teacher is teaching, writing on the board, supervising written work, teaching by rote, 0 if teacher is absent, chatting, sitting idle/standing outside classroom, keeping order in classroom but not teaching, doing other non teaching work. Since there are four observations per teacher on attendance and activity, the variables teacher attendance and activity are taken as averages for the teacher across the visits and are interpreted as the fraction of visits a teacher was present (or engaged in teaching).
• Sample students were tested on a competency and curriculum based language and math tests that last approximately 20 minutes per child. The language test was a test of reading and writing skills. The math test was a test of number recognition, addition, subtraction, multiplication and division. Tables 1-3 in appendix B present details of the test items. In MP and UP tests took place at the end of school year while in Karnataka, these were held 4 months later at the beginning of school year in 2006. That is, the test given to end of school year grade 4 students in MP and UP was given to beginning of school year grade 5 students in Karnataka. And the test given to end of school year grade 3 students in MP and UP was given to beginning of school year grade 4 students in Karnataka.
• An interview of the parents of sample students on their knowledge about existence of school oversight committees, whether the students had received their entitlements for the current school year- textbooks, school uniform, how much scholarship was received, whether mid day meal was delivered every day in the past 7 school days and whether parents had spoken with the school oversight committee or the teacher regarding quality of education in the school. The survey team had instructions to make sure that both parents of the selected student as well as the student are present for the parents’ interview.
• Interview of members of the oversight committees: VEC in UP, PTA committee in MP and SDMC in Karnataka, to measure their participation in school management and knowledge of oversight roles and responsibilities. Members were asked about the number of committee meetings in the current school year, whether they had attended the most recent meeting, the number of school inspections or visits by the committee in the current school year, whether they had participated in the school visit.
Additional data were collected on students’ socio-economic background such as parents’
education, caste, wealth and teacher characteristics such as age, education, experience, type of contract, training.
Intervention
We collaborated with the Nike Foundation in creating the campaign design. The foundation provided financial support and creative advice in the development of campaign tools.
An information campaign was conducted in each intervention GP from September to November 2006 in MP and UP. In Karnataka, the campaign took place between
February-April 2007. The campaign made use of the following tools to communicate the information- a short film of 6 minutes, poster, wall painting, take home calendar and a learning assessment booklet.
The tools were piloted prior to the campaign to test if the parents and school committee members understood the information being communicated. The results of the pilot indicated that the tools were very effective in communicating the information. The tools were the same in all three states except that the information communicated was state specific, pertaining to the SDMC in Karnataka, the PTA in MP and the VEC in UP.
In addition to the information campaign treatment in each of the three states, there was a second treatment done only in Karnataka. The only dimension in which the second treatment was different from the first was that the film had an additional 1-2 minutes capsule at the end. This capsule showed average wages in the state for different levels of schooling to increase awareness about the economic benefits of schooling and advocated the audience to become involved in monitoring outcomes in the school. Except for this add on part, the film was identical to that in the first treatment. All other tools were the same as in the first treatment. The campaign was conducted in the second treatment in exactly the same way as in the first.
The information campaign was conducted in three rounds in each GP, each round separated by a period of two-three weeks. Each round consisted of two to three meetings in different neighborhoods of the GP as well as distribution of posters and take home calendars. Residents were informed in advance about the dates and locations of meetings, and separate meetings were held in SC/ST, OBC and high caste neighborhoods. The primary target audiences at the meetings were parents and members of the school oversight committees. Each meeting lasted about 30-40 minutes and consisted of a 6-7 minute film presentation that was played twice, opportunities to ask questions and for discussion to happen among the audience. People were notified that the information was collected from the government. To ensure that the information campaigns were uniform, research assistants read a scripted introduction and were only allowed to answer questions to which the answers were already written on the calendars.
Any other questions or issues were not answered. The team was also not allowed to participate in any discussion that took place among the community members following the film presentation. The distribution of take-home calendars was done house-to-house to avoid a household receiving multiple copies of the calendar.
The film, poster and calendar focused on the following information: details of roles and responsibilities of the village education committees in UP, of the parent teacher associations in MP and of the school development and monitoring committee in Karnataka (these are described in brief in section 2); rules for selection of VEC members in UP, PTA members in MP, SDMC members in Karnataka; rules for conducting committee meetings; number of mandatory meetings, minimum attendance requirements for the meetings to be conducted; record keeping of the minutes of the meetings;
organization and funding of school accounts; right to information regarding the school including the right to obtain copies of any school record; where to complain about school
related problems; benefits that students in primary grades are entitled to such as cash stipend, textbooks, mid day meal, school uniforms.
The film and posters contained key information while the calendar contained all of the information in detail. The learning assessment booklet outlined the grade wise minimum levels of language and math skills that children were expected to have, based on minimum level of learning (MLL) framework recognized by the government of India.
Parents could use the assessment booklet to test their child to find out whether the child knows the minimum that is expected for his grade. The information in the communication tools was obtained from the basic education departments of respective state governments.
Before the campaign was launched, all tools were verified and approved by the state governments for their content.
On average, about 770 residents of an intervention GP in UP and about 675 residents of an intervention GP in MP attended the three rounds. No information campaign was held in the control villages. The campaign team was blind to the baseline and follow up surveys. They were also unaware of the control GPs.
Follow-up survey
Baseline survey participants were re-interviewed 12 months later by research assistants who had no knowledge of the intervention. To maintain this blinding, intervention group parents, students or committee members were not asked if they attended an informational meeting.
One year after the intervention, we conducted focus group discussions in 10 randomly selected intervention GPs in each of the states MP and UP. We conducted 2 focus group meetings in each village, one among low caste residents (SC and ST) and the other among residents belonging to general and backward caste categories (non-SC/ST). Each meeting had on average 12 participants who were asked if they remembered the campaign, whether they had discussed the information with anyone else in the village afterwards, whether they had taken up any school related issues with the teachers or VEC/PTA, why bigger changes were not seen and what could be done to improve the campaign. In these GPs, school committee members (i.e., VEC in UP and PTA in MP) were also asked the same questions as in the focus group discussions. In addition, they were also asked about any changes in the functioning of committee meetings and whether they ever tried to assess children’s learning in the school. These were individual interviews conducted in private, unlike the focus group discussions. 40 members participated in each state.
Analysis
Teacher attendance is defined at the teacher level as the average of whether the teacher was present across the four visits. It takes values between 0 and 1. Teacher activity is defined at the teacher level as the average of whether the teacher was engaged in teaching across the four visits. It also takes values between 0 and 1.
The unit of analysis for teacher attendance and activity outcomes is the individual teacher. The units of analysis for student test and whether the student received their entitlements (mid day meal, text books, school uniform and scholarship) are individual students. For outcomes from interviews of school committee members, the unit of analysis is the individual member.
To measure the effect of the campaign, for every outcome we conduct a linear
“difference in differences” regression analysis comparing the change in intervention to the change in control group from baseline to follow up after adjustment of standard errors for clustering. Focus groups are analyzed by percentage of respondents to each question.
Responses to open ended questions put to focus groups are presented as main themes that were mentioned.
It should be noted that all results reported below are for the study sample within the states, although reference is sometimes made to the states.
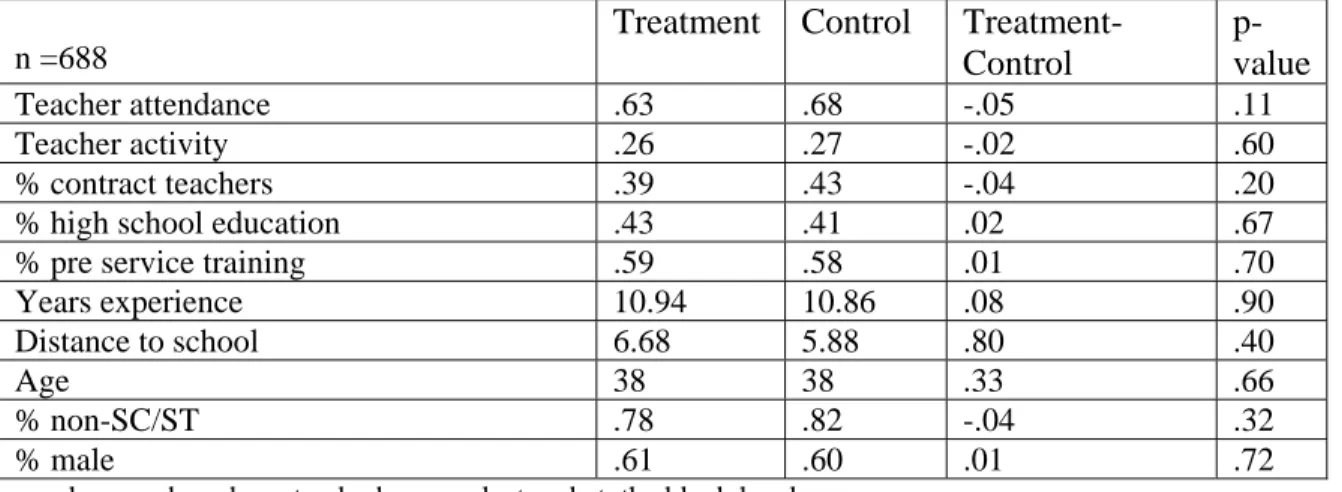
4. Baseline Characteristics
Table 2 presents a summary of key variables at baseline. Baseline outcomes are reported in detail in another paper (Pandey et al, 2008). Baseline survey suggests that treatment and control villages are similar in socio-economic characteristics of the sample as well as in measured outcomes. It indicates low teacher attendance and poor student learning.
Parents and village education committees are neither aware of their oversight roles nor participating in school management. However, there is substantial heterogeneity in outcomes across states. Karnataka has better student and teacher outcomes as well as higher levels of community awareness than MP and UP.
4.1 Teachers’ Effort
Average teacher attendance was 65 percent in UP, 67 percent in MP and 88 percent in Karnataka. Average fraction of teachers present and actively engaged in teaching is 27 percent in UP, 31 per cent in MP and 68 percent in Karnataka. In each of the states, teachers in treatment and control schools are similar in attendance, activity and other socio-economic characteristics (Tables 3A-3C).
Unlike Karnataka, both MP and UP have a cadre of contract teachers. 16 percent of teachers in MP and 41 percent in UP are contract teachers. In both states contract teachers have higher mean attendance and activity compared to regular teachers.
4.2 Learning Achievement in Language and Mathematics
What is the benchmark? We use the minimum level of learning (MLL) framework recognized by the government of India as a benchmark for the minimum that a child in a given grade should know. The competencies tested for each grade fall either within or below the set of competencies listed by the MLL for the grade. Tables 1-3 in appendix B
describe the test items used and the minimum grade level for the competency as outlined in the MLL framework. As an example, the MLL for language specifies that a child in grade 1 should be able to read simple sentences and write simple 3 syllable words. A child in grade 2 should be able to read short paragraphs as well as write dictated sentences. In mathematics, a child in grade 2 should recognize numbers up to 100, be able to do two digit additions with carryover and subtractions with borrowing. The framework expects at least 80 percent of children to be able to do at least 80 percent of the competencies for the grade. The framework can be found at www.education.nic.in/cd50years/r/2S/Book2S.htm.
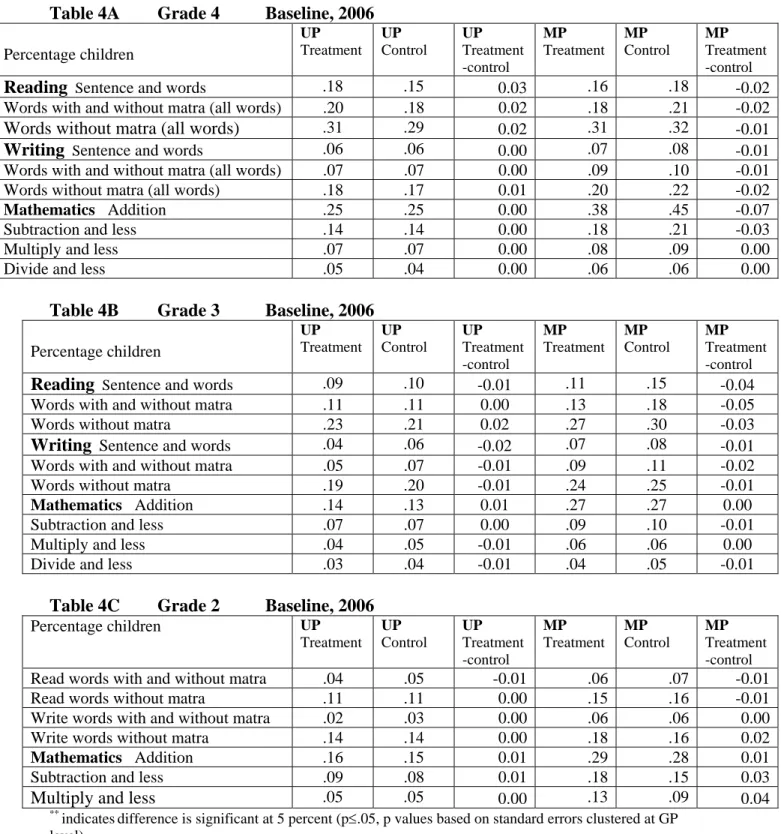
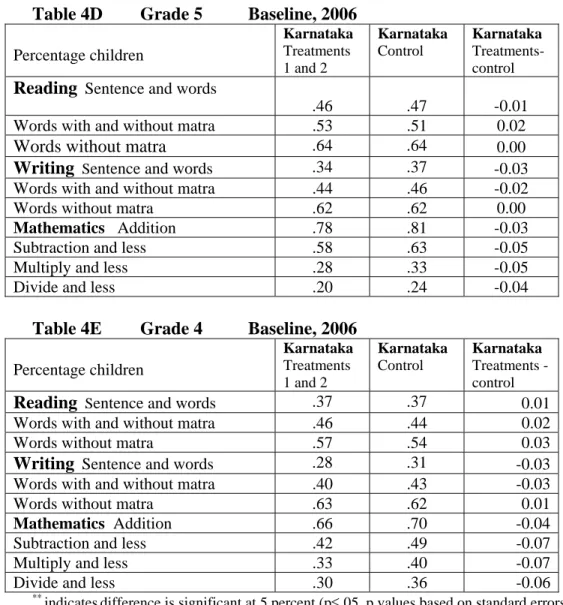
Tables 4A to 4C present performance of sample children in language and math in grades 2, 3 and 4 for MP and UP at end of school year. Tables 4D and 4E present the same for grades 4-5 in language and math for Karnataka at beginning of school year. In all three states students perform similarly in treatment and control schools in the grades tested.
Given our MLL benchmark, student performance as measured by the percent correct responses on each item is low in all three grades in MP and UP and relatively higher in Karnataka. On all competencies including basic ones such as recognizing words on the language test and solving addition or subtraction on the math test, the sample of children in MP and UP perform dismally and children in Karnataka do much better. Barely 16-18 percent in MP and UP at the end of grade 4 can read a simple sentence and words compared to 47 percent in Karnataka. Of the fourth graders, 41 percent in MP, 25 percent in UP and 79 percent in Karnataka can add two-digit numbers. The percentages who can do addition and subtraction are 19 in MP, 14 in UP and 60 percent in Karnataka.
How do these numbers compare to the findings of the Annual Status of Education Report (ASER) in 2005 and 2006? The ASER learning assessment surveys were conducted nation wide in India by Pratham, a non-government organization, in November- December of each year, which makes ASER 2005 closer in timing to our baseline survey than ASER 2006. ASER 2005 finds that the percentages of children in grades 2-5 in government schools who can read a simple text with short sentences are 47 in MP, 39 in UP and 50 in Karnataka. The percentages of children who can subtract are 45 in MP, 32 in UP and 41 in Karnataka. Our baseline results differ in that students in MP and UP perform worse and those in Karnataka do better compared to the ASER findings. Possible reasons for differences between results of the two surveys, conducted 2 months apart from each other, are differences in survey and testing methodologies.
4.3 How Much of the Entitlements Reach the Students?
In all of the three states, children enrolled in primary grades in public schools are entitled to receive certain benefits as incentives to attend school. These are free mid day meal and free textbooks for all, free school uniform for certain students and scholarship for certain caste categories. In UP, SC/ST and OBC students are eligible for annual scholarship of Rupees 300. High caste (i.e., those in the other or general caste category) students below the poverty line are also eligible for the same amount of scholarship. In MP female students in SC and ST caste categories are entitled for annual scholarship of Rupees 150.
In MP and UP, all female students in educationally backward blocks, defined as blocks with low female literacy rate, are entitled to free school uniform annually. In Karnataka all students in the state are entitled to free uniform each year.
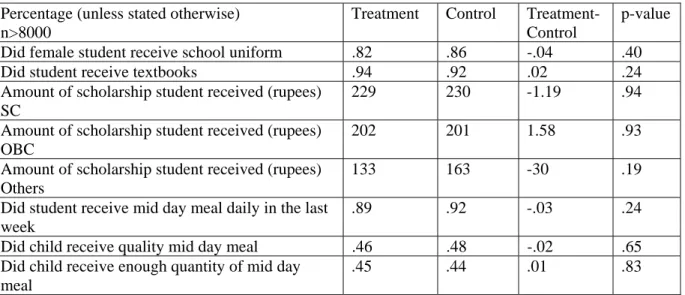
Tables 5A-5C present how much of these entitlements reach the children they are intended for in treatment and control villages. In each state, treatment and control villages are similar in the extent to which entitlements reach the students.
In MP and UP, textbooks and uniforms reach the students much more than mid day meals or scholarships; more than 80 percent of students received textbooks and uniforms. A student belonging to SC or ST category in UP received Rupees 229 in scholarship when the entitled amount was Rupees 300 and in MP, a female SC or ST student received Rupees 53 when the entitled amount was Rupees 150.
In Karnataka, there is greater efficiency in delivery of entitled benefits than in the other two states. More than 93 percent of students received meals, books and uniforms.
4.4 Are Local Communities Aware of Their Roles and Active in Managing the Schools?
This subsection discusses the findings at baseline on local participation in school management. In line with the variation in teacher effort and learning outcomes, there is a parallel variation in community participation across the states.
4.4.1 The committees with oversight responsibilities
Tables 6A-6F present results based on interviews of members of school oversight committees. In each state treatment and control villages are similar in the functioning of the school committees and the awareness of members about their oversight roles and responsibilities.
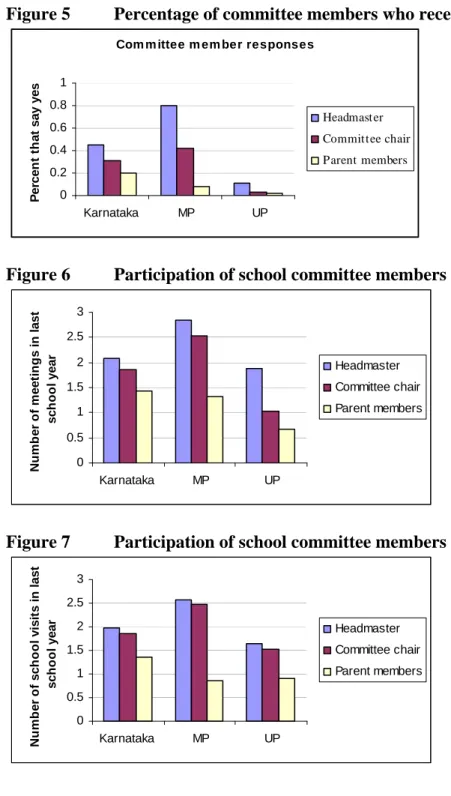
A large proportion of committee members in all three states stated not having received any training from the government regarding their roles and responsibilities (Figure 5).
Parent members of these committees had the lowest positive responses. About 20 percent of parent members reported receiving any training in Karnataka, compared to 8 percent in MP and 2 percent in UP. In all of the states, headmasters seem to be most informed about the roles and responsibilities of the school committee. Parent members of the committees seem to be the least informed and participating the least, particularly in MP and UP (see also Pandey et. al, 2008). Parent members of the school committees in Karnataka seem to be more informed about their roles and report somewhat greater participation in meetings and school inspections relative to their counterparts in MP and UP.
Figure 5 Percentage of committee members who received training
Com m ittee m em ber responses
0 0.2 0.4 0.6 0.8 1
Karnataka MP UP
Percent that say yes
Headmaster Committee chair Parent members
Figure 6 Participation of school committee members
0 0.5 1 1.5 2 2.5 3
Karnataka MP UP
Number of meetings in last school year
Headmaster Committee chair Parent members
Figure 7 Participation of school committee members
0 0.5 1 1.5 2 2.5 3
Karnataka MP UP
Number of school visits in last school year
Headmaster Committee chair Parent members
5. Impact of the Information Campaigns
The analysis is a “difference in differences” linear regression where the change in outcome from baseline to follow up is the dependent variable and is regressed on a constant term and a treatment dummy variable. For individual i in village j in block k, the regression equation is as follows:
ΔΥijk = a + bΧjk + εijk
where ΔΥijk is the change in outcome from baseline to follow up, Χjk is a dummy variable taking value 1 if village j in block k belongs to the treatment group and 0 if it belongs to the control group. εijk is a random error term and a is a constant term in the regression equation. The estimate of the coefficient b is an estimate of the average treatment effect.
Because there were two interventions in Karnataka as opposed to one in MP and UP, we first present all results from the latter two states and then discuss results from Karnataka.
5.1 Teacher Attendance and Activity
Tables 8A and 8B present the difference in differences analysis of the impact of the campaign on teacher effort. The unit of analysis is the individual teacher.
In UP, the intervention is associated with 7 percentage points (11 percentages) higher teacher attendance and this effect is significant with p value of .04 (Table 8A). There is no effect of the intervention on teacher activity. The impact of the campaign on attendance is no different for contract teachers than for regular teachers. In MP, there is no effect of the intervention on teachers’ attendance but the intervention is associated with 9 percentage points (30 percentages) higher teacher activity with a p value of .02 (Table 8B). Again the impact of the campaign on teacher activity is no different for contract teachers than for regular teachers.
It is interesting to note that even though contract teachers have different appointment terms than regular teachers, in both states the impact of the campaign is similar regardless of the contract type.
State government elections were going on in UP during the follow-up survey. Teachers were expected to carry out many election-related tasks including preparing voter identity cards which would have interfered with teaching. This may be why engagement in teaching was unchanged by the intervention in UP even though teacher presence improved.
5.2 Learning Achievement
Tables 9 and 10 present the results. The unit of analysis is the individual student. There is a positive and significant impact on reading in grade 3 in both states (p<.05). In UP, the impact is on percentage of children who can read sentence and words, while in MP there is an impact on percentage of children who can read words without matra. The magnitude of the impact is 3 percentage points (27 percentage) in UP and 4 percentage points (14 percentage) in MP. There is no significant impact on other competencies. For grades 2 and 4, there is no impact on the competencies tested.
5.3 Change in Other Outcomes: Entitlements Received by Students
This subsection presents the impact of the intervention on entitled benefits to students in primary grades. As mentioned in 4.3, these are scholarships for certain caste categories, free school uniforms for female students in educationally backward blocks, free
textbooks daily mid day meal for all students. The unit of analysis is the individual student.
Because the entitlements can differ across caste categories and by gender, results are presented separately for these sub groups wherever applicable. These analyses are valid since the sample selection was stratified by caste categories and by gender. Tables 11A and 11B present difference in differences analysis of the impact of the campaign.
Scholarship: In UP, SC/ST and OBC students in primary schools are eligible for scholarship. In addition, high caste (i.e., those in the other category) students below the poverty line are also eligible for scholarship. There is no effect of the intervention on scholarships for SC/ST and OBC category students. But there is a positive and significant impact on scholarship received by high caste students. The magnitude of this effect is 33 percentages and the associated p value is .04.
In MP, girls from SC and ST caste categories are eligible for scholarship. There is a significant impact of the intervention on scholarship received by SC and ST girls. The intervention is associated with 26 percent higher scholarship received and the p value for this effect is .02.
Uniform for girls: In both states, in educationally backward blocks which are defined as blocks with low female literacy rate, all girls in grades 1-5 are entitled to free school uniform annually. In UP, in the districts with educationally backward blocks, there is a significant impact of the campaign on the percentage of girls who received school uniform. The magnitude of this increase is 18 percentages and has a p value of .05.
In MP, there is a no overall impact on girls who receive school uniform but there is a significant impact on the percentage of girls from high castes who received school uniform. The size of this effect is about 14 percentages and the associated p value is .02.
Mid day meal and textbooks: In both states, there is no impact on the delivery mid day meal and whether textbooks were received.
5.4 Change in Processes: Is There an Observed Increase in Community Participation in Oversight of the School?
In UP, the unit of analysis is the individual VEC member. Tables 12A and 12B present difference in differences analysis of the impact of the campaign. The intervention is associated with a 25 percentage increase in the number of VEC meetings and a 25 percentage increase in members’ participation in school inspections. Both these effects are significant at p value below .03. The campaign significantly influences the knowledge of VEC members regarding teacher aspects of roles and responsibilities.
In MP, the difference in differences analysis is not possible at the individual member level since new rules for PTA election came into effect just as the campaign was starting.
The PTA committees were re elected based on these new rules during or after the
campaign. However difference in difference analysis can be done, using average PTA response at the GP level by member category (whether PTA member is secretary, chair or parent). This analysis shows no significant impact of the intervention on PTA members’
participation and awareness (Tables 12C and 12D). If we look at whether parents talked to the PTA regarding the quality of education, difference in differences analysis indicates no significant change. However there is a significant increase in percentage of parents who talked to the teacher about the quality of education in campaign villages compared to control villages (Table 13B).
5.5 Focus Groups in MP and UP
Thirty-five percent of the participants in the 40 focus group stated they had taken up teacher attendance issue with the teacher or the VEC and 41 percent said they had taken up issues of their children’s learning with the school, VEC or PTA. More than 70 percent of these participants who took up school issues stated talking to the teacher and 30 percent or less talked to the VEC. More than 85 percent stated going along with other parents, rather than alone, to talk to the teacher or VEC. 61 percent of focus group members had used the learning assessment booklet distributed in the campaign to assess children’s learning.
73 percent of focus group participants had discussed the disseminated information with others in the village and 59 percent said the discussion went on for at least a few weeks.
All of the groups mentioned student learning as a main theme discussed. Other topics of discussion were teacher attendance, quality of teaching and entitlements such as mid day meal. When asked why bigger changes did not occur in learning or teacher effort, prominent themes were that “teacher is dominating”, “it is difficult to talk to the teacher”
and “teacher does not care”. When asked how the information campaign can be made more effective, the dominant response was to have more frequent meetings. 73 percent of the groups mentioned meetings should be held more often, at regular intervals. Other suggestions were to call all parents to the meetings, to hold the meeting in the school and to focus the information campaign towards illiterate parents.
In similar interviews with 80 members of the VECs and the PTAs, 87 percent of the members reported discussing the information in the campaign with others in the village and 76 percent mentioned children’s learning as the main theme discussed. 53 percent of members reported talking to the school teacher or VEC/PTA chair about teacher attendance or teaching issues and 39 percent had discussed children’s learning issues.
More than 75 percent of those who took up these issues talked to the teacher rather than the VEC chair. 78 percent of members reported using the learning assessment booklet to assess children’s learning.
When asked if there was a change in the manner in which committee meetings were conducted since the campaign, 71 percent of VEC and PTA members responded in affirmative, saying that meetings were held more often compared to before. Of these, 75 percent mentioned children’s learning when asked what was discussed in the meetings.
73 percent suggested more frequent meetings as a way of making the campaign more effective.
5.6 Impact in Karnataka
As a reminder to the reader, we briefly describe again the two treatments in Karnataka.
The first treatment is an information campaign similar to that in the other two states. The second treatment is an information and advocacy campaign that differs in one dimension from the first treatment. The difference is in one campaign tool, the film which had an added 1-2 minute capsule at the end. The rest of the film is identical to that in the first treatment. The extra portion of the film informs the audience of the economic benefits of schooling in Karnataka and advocates active involvement of parents in the school. The campaign was implemented in identical manner in both treatments. Since the treatments have one difference but are otherwise identical, in reporting the impact of the treatments we report the average impact of the two treatments combined compared to control group and the extra impact of the second treatment compared to the first treatment.
Teacher effort: Tables 14A presents the analysis of the impact of the campaign on teacher effort. The average impacts of the treatments on teacher attendance and teacher activity are insignificant. The effect of the second treatment with the longer film is no different from the effect of the first treatment.
Learning achievement: Table 14B presents the results. There is a positive and significant effect on writing in grade 4 (p<.02). This impact is on the percentage of children who can write words. The magnitude of the impact is 6 percentage points (15 percentages). There is no additional impact of the second treatment i.e., the impact of the second treatment is not significantly different from that of the first treatment. In grade 5, there is a positive and significant impact on percentage of children who can do multiplication and lower competencies (p<.03). The magnitude of the impact is 8 percentage points (27 percentages). Again there is no extra impact of the second treatment.
Entitlements: The entitlements include free textbooks, free school uniforms and daily mid day meal for all students. Table 14C presents the results. There is no impact on whether textbooks and uniforms were received but note these were already at 97 percent at baseline. There is a significant improvement in the percentage of children reporting satisfactory quality of mid day meal. The magnitude of this impact is 5 percentage points (7 percentages) and has a p value of .03.
Change in process: Difference in differences analysis is not possible at the individual member level since 53 percent of SDMC members changed between baseline and follow up surveys. Difference in difference analysis can be done, using average SDMC response at the GP level by member category (whether member is secretary, chair or parent). This analysis shows no significant impact on SDMC members’ participation but a positive and significant impact on awareness regarding one of the roles and responsibilities (Tables
14D-E). There is a significant impact on the percentage of parents who talked to SDMC regarding the quality of education (Table 14F).
6. Discussion
We find that providing information through a structured campaign to communities about their oversight roles in schools had a positive impact in all three states. Impacts were observed on process or behavior outcomes, delivery of inputs to students, teacher effort and learning outcomes.
However, there are differences across states in where the impact occurs. This is not surprising given that the states had different starting points. Outcomes at baseline were much higher in Karnataka suggesting greater efficiency in delivery than in MP and UP.
Also the institutions created by decentralization differ across states in structure and the extent of oversight roles, possibly contributing to differences in impact.
First, on process and behavior outcomes, improvements were observed in community participation. In MP there is an increase in the percentage of parents talking to the teacher about school quality issues and in Karnataka there is an increase in the percentage of parents talking to the school oversight committee. In UP there is a significant increase in the number of meetings and school visits of the school committee itself.
Differences in the pattern of impact on participation across states can be due to several factors. Besides the differences in the structure and oversight of institutions created by decentralization, the time between the intervention and the follow up survey may matter for change in behavior to be observed. In MP and Karnataka, there may not have been enough time for committee members’ participation to have changed. In both these states, elections for school committees took place before the follow up survey and resulted in a majority of new members since baseline. Another factor can be that there are multiple channels of change in process. In MP, the channel being observed may be from parents to the school as there is a significant increase in the percentage of parents talking directly to the teachers. This is supported by focus group discussions where more than 70 percent of the parents who took up school related issues talked with the teachers and less than 30 percent approached the school committees. In Karnataka, the channel being observed may be from parents to the school via the oversight committee.
Second, on the delivery of inputs, improvements occurred in certain entitled benefits reaching the students in each of the three states. Cash stipend and uniform entitlements improved in MP and UP, and the quality of mid-day meals improved in Karnataka.
These outcomes are easier to influence over a short time period. For instance, it may be easier for a parent to demand these entitlements from the teacher than to influence the quality of teaching. The impact in MP and UP varies by student’s caste suggesting that caste may be an important factor in influencing individual or collective action. In Karnataka there is no impact on other entitlements because their reach was already high at baseline.
Third, with respect to teacher effort outcomes, in MP there is positive impact on teachers’
engagement in teaching, in UP the impact is on teachers’ attendance while no such impact is observed in Karnataka. Teacher attendance and engagement in teaching were much higher at baseline in Karnataka; nearly 90 percent of the teachers were present and 80 percent of those present were teaching. This may be why we do not observe any impact on teacher effort here. The difference in impact may also be due to the difference in the extent of control the oversight committee has over teachers. In MP, the school committee is obligated to verify teachers presence in order for the teacher to receive his or her salary while in UP, the committee has power over hiring and firing of contract teachers. In Karnataka, the committee has no explicit control other than filing a complaint in the education office. This may explain why in Karnataka teachers with low baseline attendance in treatment villages were more likely to be transferred out of the school (Table 15).
Fourth, on learning outcomes, in MP and UP the impact is on reading in one of three grades tested. The size of the impact is 14% in MP and 27% in UP. In Karnataka, the impact is on writing in one grade (15%) and on mathematics (27%) in the other grade tested. Even though there is impact, it does not occur uniformly across grades or competencies. This may be because test scores are unlikely to be influenced much in a short time and a longer time horizon is needed to assess impact on learning.
What are the mechanisms through which outcomes changed? Focus groups conducted in two of the states shed light on the possible channels of change. Changes seem to have occurred through discussions among villagers as well as villagers bringing up issues with teachers and school oversight committees. In interviews conducted during focus group, committee members reported more frequent meetings and school inspections, indicating increased oversight of school committees.
Previous work on this topic finds mixed results on the impact of information to empower communities (Banerjee et al, 2007; Pandey et al, 2007). However few randomized trials of structured campaigns have been conducted. Our findings clearly suggest that 1.) Decentralization to communities is meaningless unless it is made real i.e., communities at least need to know what oversight roles they have. 2.) Second, providing information to communities that are unaware, through a structured campaign, can play a useful role in changing behavior and learning outcomes. The nature of the intervention, in particular the structure and intensity of the campaign, may have been important for the results observed.
Strengths of our study include using a structured intervention that is easily replicable, a rigorous cluster randomized controlled trial design, and broad geographic coverage.
Perhaps the greatest limitation of the findings reported here, is that outcomes are measured soon after the intervention. Changing behavior to change school outcomes requires time to take place. Barriers to collective action are apparent from focus group discussions and may take time to be overcome, especially in light of the recent studies which document that institutions tend to persist (Engerman and Sokoloff, 2000; Banerjee and Iyer, 2004). More follow up work is needed to examine whether learning shows a systematic increase when the impact is measured over a longer time period, whether a
campaign sustained over longer time generates greater impact on school outcomes and whether there are sustained differences in impacts across states.
Figure 1: Flow of study participants through the trial (Study design is similar for three states, except for few differences in Karnataka; see section 3)
100 GPs (half of sample GPs in each block) randomly assigned to control.
One public primary school per GP randomly selected for baseline and follow up surveys 45 students per school – 15 each from grades 2, 3 and 4 randomly selected for baseline survey.
Within each grade, 5 chosen randomly from each caste category- SC/ST, OBC and Others. Half chosen randomly to be girls.
Baseline survey: Feb-April 2006 100 GPs (half of sample GPs in each block)
randomly assigned to intervention.
One public primary school per GP randomly selected for baseline and follow up surveys 45 students per school – 15 each from grades 2, 3 and 4 randomly selected for baseline survey.
Within each grade, 5 chosen randomly from each caste category- SC/ST, OBC and Others. Half chosen randomly to be girls.
Baseline survey: Feb-April 2006
4 districts chosen purposively in Uttar Pradesh (UP)
2 blocks randomly selected per district and 25 gram panchayats (GPs) randomly selected per block = 200 GPs per state
Intervention: Information campaign took place from September to November 2006
Follow up survey: Feb-April 2007
Follow up survey: Feb-April 2007
No information campaign
Figure 2: Study districts in Karnataka
Figure 3: Study districts in Madhya Pradesh
Figure 4: Study districts in Uttar Pradesh
REFERENCES
1. Annual Status of Education Report (ASER) 2005 – Rural. Pratham.
http://www.pratham.org/aser-report/Aser%20Full%20Report%202005.pdf 2. Banerjee A, Banerji R, Duflo E, Glennerster R, Khemani, S. Can information
campaigns spark local participation and improve outcomes? A study of primary education in Uttar Pradesh, India. Policy research working paper. 2006; 3967: World Bank.
3. Bardhan P. Decentralization of Governance and Development. Journal of Economic Perspectives 2002;16(4):185-205
4. Bardhan P, Mookherjee D. Decentralizing antipoverty program delivery in developing countries. Journal of Public Economics 2005;89(4):675-704 5. Census of India 2001. http://www.censusindia.net
6. Central List of Other Backward Gradees. National Commission for Backward Classes, Government of India. http://ncbc.nic.in/html/faq6.html
7. Chaudhary N, Hammer J, Kremer M, Muralidharan K, Rogers H. Missing in Action:
Teacher and Health Worker Absence in Developing Countries. Journal of Economic Perspectives 2006; 20(1):91-116
8. Constitution of India, 73rd amendment, 1992.
http://indiacode.nic.in/coiweb/amend/amend73.htm
9. Gaiha R, Kaushik PD, Kulkarni V. Jawahar Rozgar Yojana, Panchayats, and the rural poor in India. Asian Surv. 1998;38(10):928-949.
10. List of scheduled castes and scheduled tribes. Census of India 2001.
www.censusindia.net/results/upscst.PDF
11. Pandey P, Sehgal A, Riboud M, Levine D, Goyal M. Informing Resource-Poor Populations and the Delivery of Entitled Health and Social Services in Rural India. A Cluster Randomized Controlled Trial. Journal of American Medical Association; Oct 24/31, 2007; 298(16): 1867-1875
12. Pandey P, Goyal S, Sundararaman V. Public Participation, Teacher Accountability and School Outcomes: Findings from Baseline Surveys in Three Indian States.
Working Paper, World Bank, 2008.
13. World Development Report, World Bank, 2004.
14. Reinnika R, Svensson J. Local capture: Evidence from a Central Government Transfer Program in Uganda. Quarterly Journal of Economics 2004;119(2):679-705 15. Report of the Comptroller and Auditor General of India on the Union Government
2001. http://cag.nic.in/html/reports/civil/2001_book3/index.htm 16. Teachers Skipping Work. World Bank.
http://web.worldbank.org/WBSITE/EXTERNAL/COUNTRIES/SOUTHASIAEXT/0 ,,contentMDK:20848416~pagePK:146736~piPK:146830~theSitePK:223547,00.html 17. Teachers and Doctors: Missing in Action. World Bank.
http://web.worldbank.org/WBSITE/EXTERNAL/NEWS/0,,contentMDK:20861757~
pagePK:64257043~piPK:437376~theSitePK:4607,00.html 18. Census Terms, Census of India 2001.
http://www.censusindia.net/census2001/history/censusterms.html 19. Ministry of Social Justice and Empowerment, Government of India.
http://scialjustice.nic.in/schedule/faq.htm#sc1