Report No. 37
South Asia Human Development Sector
Sri Lankan Population Change and Demographic Bonus Challenges and Opportunities in the New Millennium November 2012
Discussion Paper Series
Public Disclosure AuthorizedPublic Disclosure AuthorizedPublic Disclosure AuthorizedPublic Disclosure Authorized
74168
Report No. 37
South Asia Human Development Sector
Sri Lankan Population Change and Demographic Bonus Challenges and Opportunities in the New Millennium
November 2012
Discussion Paper Series
Discussion Papers are published to communicate the results of the World Bank’s work to the development community with the least possible delay. The typescript manuscript of this paper therefore has not been prepared in accordance with the procedures appropriate to the formally edited texts. Some sources cited in the paper may be informal documents that are not readily available.
The findings, interpretations, and conclusions herein do not necessarily reflect the views of the International Bank for Reconstruction and Development/The World Bank and its affiliated organizations, or those of the Executive Directors of the World Bank or the government they represent.
The World Bank does not guarantee the accuracy of the data included in this work. The boundaries, colors, denominations, and other information shown on any map in this work do not imply any judgment on the part of the World Bank concerning the legal status of any territory or the endorsement or acceptance of such boundaries.
iii
Contents
Acknowledgements ... vi
Executive Summary ... vii
1. Introduction ... 1
2. Population Growth in the Past ... 1
3. Components of Population Change ... 3
3.1 Fertility ... 3
3.2 Mortality ... 13
3.3 Migration ... 15
4. Future Population of Sri Lanka ... 18
4.1 Size and Growth ... 19
4.2 Main Features of the Future Population ... 20
4.3 The Dependency Burden ... 27
5. Demographic Bonus... 28
5.1. Other Factors for Effective Use of Bonus ... 28
6. Other Factors Required for Development ... 29
6.1 Political Stability ... 30
6.2 Savings... 30
6.3 Investments ... 32
6.4 Knowledge Economy ... 34
7. Sector Composition of GDP and Patterns of Employment Generation ... 35
8. The Demographic Bonus of Asian Tigers: The Case of South Korea ... 41
9. Emerging Population Issues in the New Millennium ... 43
9.1 Recent Increase in Fertility ... 43
9.2 Aging ... 43
9.3 Structural Changes among the Elderly ... 45
9.4 Disability ... 46
9.5 Family Transition ... 47
9.6 Female-Headed Households ... 49
9.7 The Social Security System and Retirement Benefits ... 50
10. Concluding Thoughts ... 52
Appendix I ... 54
References ... 56
iv
Tables
Table 1: Population Growth and Density is Sri Lanka: 1871-2003 ... 2
Table 2: Total Fertility Rate, 1953 to 2003-2006 ... 4
Table 3: Total Fertility Rate (live births per woman) by Country in South Asia ... 6
Table 4: Age-Specific Fertility Rates of Sri Lanka (per 1,000 women) ... 7
Table 5: Adolescent fertility (ASFR 15-19) rate by country in South Asia ... 8
Table 6: Trends in Singulate Mean Age at Marriage in Sri Lanka ... 10
Table 7: Trends in Current Contraceptive Use by Modern and Traditional Methods Among Currently Married Women aged 15-49 ... 11
Table 8: Current Contraceptive Use by Method among Currently Married Women aged 15-49 12 Table 9: Life Expectancy at Birth (in years) ... 14
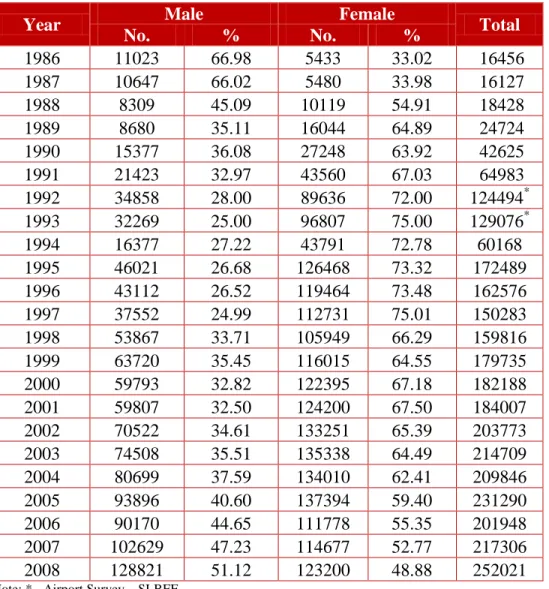
Table 10: Departures for Foreign Employment, 1986-2008 ... 16
Table 11: Departure for Foreign Employment by Age Group and Sex ... 17
Table 12: Arrivals and Departures and Net Gain/Loss ... 18
Table 13: Projected Population, 2001 to 2081 (Standard Projection) ... 20
Table 14: Projected Population by Sex, 2001 to 2081 (Standard Projection) ... 21
Table 15: Number and Percentage Distribution of Population by Three Broad Age Groups, ... 25
Table 16: Projected Dependency Ratio, 2001 to 2101 (standard projection) ... 27
Table 17: Number of Pensioners in Sri Lanka ... 33
Table 18: Contribution to GDP from Different Sectors as a Percentage (%) ... 36
Table 19: Absolute Number of Labor Employed in Different Sectors (‘000) ... 37
Table 20: Sector Shares of Employed as a Percentage of Total Employed and GDP as a Percentage of total GDP ... 37
Table 21: Age Composition and Growth of the Elderly Population, 1971-2071 ... 44
Table 22: Sex Ratio of the Elderly Population, 1971 – 2071 ... 45
Table 23: Average Household Size in South Asian Countries ... 48
Table 24: Percentage of Single Person Households and Households Headed by Women in South Asian Countries ... 50
Figures Figure 1: Change of TFR in Sri Lanka and Republic of Korea ... 5
Figure 2: Age specific fertility rates, Sri Lanka ... 8
Figure 3: Projected Change in Age-Sex Structure of the Population, 2001, 2026, 2051 ... 22
Figure 4: Relative Size of Child (<15 yrs.) and elderly (60+ yrs.) Population (standard projection) ... 26
Figure 5: Demographic Bonus of Sri Lanka ... 29
Figure 6: Life Cycle Hypothesis ... 33
Figure 7: Change in Contribution to GDP from Different Sectors ... 36
Figure 8: Change in Employment in different sectors ... 39
Figure 9: Components within the Service Sector ... 40
v
Authors
W. Indralal De Silva,
Senior Professor of Demography (Chair) and Dean, Faculty of Arts, University of Colombo, Sri Lanka
vi
Acknowledgements
The author W. Indralal De Silva, Senior Professor of Demography (Chair) and Dean, Faculty of Arts, University of Colombo, Sri Lanka acknowledges the comments and suggestions by Cem Mete (Lead Economist, World Bank) and Denis Nikitin (Consultant, World Bank).
vii
Executive Summary
This paper documents the growth and composition of the population of Sri Lanka. Demographic, economic and social consequences of age structural changes are examined, with special emphasis on the transitional age segments. Emerging population issues in the new millennium, such as ageing, disability and family transition, together with the disintegration of the traditional family system, the dependency burden, and female headed households in Sri Lanka are highlighted. The paper also discusses the policy implications of the findings.
Population growth in Sri Lanka is primarily due to the changes that occur in fertility, mortality and international migration levels. During the past decades, the total size, as well as the age and sex structure of the population has been exposed to irreversible changes. The Sri Lankan population has grown almost eight times since the first national census of 1871. The population increased from 2.4 million persons in 1871 to 20 million in 2010. The growth rate of the population currently is low, yet Sri Lanka adds around 250,000 persons annually to the total population. The current population spread shows a skewed distribution favoring the Western Province and the Wet Zone. The census of 2001 showed that a little less than 60 % of the population is located in the Wet Zone, which constitutes around 21 % of the total land area of the country.
Fertility began declining in Sri Lanka during the 1960s, largely due to the population planning drives of the Government of Sri Lanka, and to other socioeconomic transitions. By 1994, the Total Fertility Rate (TFR) of the country reached the replacement level of 2.1 live births on average for every woman (15-49 years) in the country. Nevertheless, the latest SLDHS Survey of 2006-07 shows that the fertility level is increasing and is currently at par with the fertility level of 1991. A slight decline in the age at marriage, marked declines in the use of terminal contraception, and a decreased trend in reliance on abortion as a family planning method, especially by married women, may be the key causes of recent increases in the levels of fertility.
Dramatic declines in mortality are another important issue in the demographic transition process, which was experienced by Sri Lanka in the post-World War II period. The longevity of males and particularly females has increased. The estimated life expectancy of males and females, using 2000-2002 data, show that life expectancy of males is around 68 years and that of females is around 77 years. Virtual eradication of malaria, expansion of health services and education, better distribution of food supplies and general improvements of the colonial economy of the country have caused a steady decline in the levels of mortality. The elderly population of 1.7 million enumerated in 2001 is expected to increase to 3.6 million by 2021, a doubling of the elderly population during the twenty-year period. The share of elderly will increase from 9.2 % in 2001 to 16.7 % in 2021, and to 25 % by 2041. Consequent to the declining trend in fertility and mortality in the coming years, the projected number of elderly will be 4.5 million in 2031, increasing to 6.3 million elderly in 2061.
In countries with smaller populations, migration may also emerge as an important determinant of population size. Hence, in such countries, migration may be an important factor to manipulate the desired population change. At present, over 250,000 persons leave Sri Lanka annually for
viii
foreign employment, mainly as contract employees in Middle Eastern countries (Foreign Employment Bureau, 2009). Of those, nearly half are females in their prime reproductive age groups. Migration patterns have thus largely affected the size of the working age population and the relative size of the dependent aging population.
Due to the current phase of the demographic transition, which depicts a clear transition in the age structure of the population, the number of persons who can take care of the elderly has declined, while the number of persons who need extra caretaking and support has increased. The most affected by the transition are the ‘old old’ segment of the elderly, who need special care in terms of health care, companionship and psychological support. Consequently, an emerging population issue in the new millennium is the destitution and poverty of the elderly in Sri Lanka. In this regard, the longevity of females makes them the most affected segment of the society. The households will incur extra expenses to maintain the elderly in their homes. Accordingly, on average, every family will have one aged person to care for. (World Bank, 2008; De Silva 2007).
To overcome this situation, elderly support systems have to be established, which will require allocating a large amount of funds to care for the elderly, especially to provide for their health services, pensions and for the needed social security. The security net and the needed institutional set up to cover this segment is either inadequate or still lacking in the government and private sectors of the country.
The growth changes, reflected in the projected population for Sri Lanka, show that the population will also undergo major changes in its gender balance in the coming decades. Since the latter part of the 20th Century, Sri Lankan females have emerged as the superior beneficiaries of socioeconomic progress, causing the sex ratio of the population to be female biased. The standard population projections for Sri Lanka indicate that in the year 2031, the size of the population will reach its peak of 21.9 million persons, and the sex ratio will be 94.4 males per 100 females. By 2071, the sex ratio will be reduced to a level of 92.4 males per 100 females.
There will be an added 2.0 million persons to the present population base of 20 million, which in absolute numbers will be an enormous challenge for planning.
At the beginning of the projection interval in 2001, the total dependency ratio was 55 dependent persons for every 100 working age persons, of whom 41 persons were child dependents and 14 were old age dependents. During the projection horizon, child dependency will decrease to 25 by 2036, while the old age dependency will increase at a faster rate of 36 elderly for every 100 working age persons. The projected changes in these two segments of dependency in Sri Lankan population caused a reduction in the total dependency ratio from 55 in 2001, to its lowest of 53.6 dependent persons in 2006. Thereafter, the overall dependency will increase to 56 dependents by the year 2016, and to 58 by the year 2031. As a result of the rapid increase in old age dependency, which out-paces the decline in young age dependency, the projected overall dependency will increase significantly after 2041.
Thus, the age structure transition has produced a demographic bonus, covering the period of 1991 to 2017, which is conducive for an economic takeoff of the country. The dependency ratios imply that there is likelihood that the future age structure would have a favorable impact on the economy of Sri Lanka. About 2006, the Sri Lankan population had the best demographic environment or the “window of opportunity” conducive for rapid economic development.
ix
However, by 2011, the dependency ratio will increase to the level that prevailed in 2001 (55 %).
The low dependency ratio observed in contemporary Sri Lanka is a result of the past demographic trends. This opportunity needs to be used immediately. If this opportunity is missed, planners will have to address the consequences of an increasing dependency burden, which would further depress the efforts for required economic development.
Comparing South Korea’s economic development, one of the Asian Tigers, shows that demographic transitional changes, similar to Sri Lanka’s, have occurred in that country.
Continuous implementation of seven- and five-year economic plans, during three and a half decades, has led South Korea towards an accelerated economic development and a transformation from a developing country to a developed one.
The prevailing political stability in Sri Lanka provides a congenial environment for accelerated economic development and maximization of knowledge economy to suit the current national and international demand for skilled labor. Another important area of human capital development is female technological and academic advancement to increase their competitiveness in the labor force. Women need to participate in policy positions at the managerial level in the public as well as private sectors. Their involvement as executives and managers will lead to accelerating the economic development process of the country.
The current environment is suitable to attracting direct foreign investment for the country to increase domestic savings and promote investment. The government’s goal for the Ten Year Plan is to make Sri Lanka the “Knowledge Hub of Asia.” Planned investment in human capital, set development goals for various sectors, and infusing technology into production should increase the diversified development of the economy, and create productive employment opportunities for the increased working age population. The sector analysis of the GDP and the employed population in agriculture, industry, and the service sectors show that current growth patterns of the economy are inadequate to achieve the necessary accelerated economic growth and foster maximum utilization of the last phase of the demographic bonus, before dependency ratios start to increase gradually.
The female-headed households have increased significantly during the past few decades, due to a variety of reasons; widowhood, migration, non-marital fertility and marriage instability could be some important causes. In recent decades, an increasing number of women, particularly rural women, have become heads of households because men, the traditional heads of households have gone to war or are working distant from their residence. Moreover, due to civil unrest and displacement in a number of countries in the region, large-scale migration of males as refugees, have created a situation where the females have assumed the task of running the household.
An efficient and viable social security system and a retirement benefits facility are important emerging priorities in Sri Lanka. Analysis of the current social protection system shows that the prevailing social security net is inadequate and needs improvement to meet the challenges of the new millennium.
1
1. Introduction
This paper examines the population changes and the related causative factors, namely fertility, mortality and international migration in Sri Lanka. During the past decades, the total size, as well as the age and sex structure of the population, was exposed to irreversible changes. The age structure transition has produced a demographic bonus conducive for an economic takeoff.
During this period, the proportion of people of working age (15-59) is larger than the fraction in the dependent age categories. The paper includes a sector analysis of the employed population in the agriculture, industry and service sectors to identify the growth sectors of the economy and to reveal the potential patterns and levels of utilization of the demographic bonus. Finally, the social safety net implications of the emerging population, such as the dependency burden, aging, disability and the disintegration of traditional family system in Sri Lanka are examined.
2. Population Growth in the Past
The main source of population data for Sri Lankan for the early British period (circa1821 AD) is the Blue Book. It contains annual population estimates of the government agents. A systematic and scientific basis for enumerating the country’s population was established in 1869 with the passing of the Census Ordinance (Ordinance No. 5 of 1869). It legalized a periodic census when the British Governor deemed it necessary. The first national census was made in 1871, and determined the population to be about 2.4 million (United Nations, 1976).
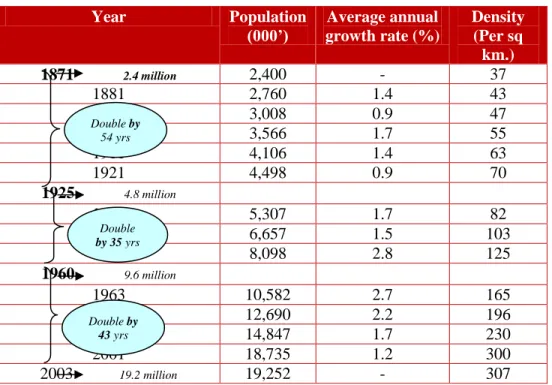
Sri Lanka’s population has grown to 20 million in 2010, an almost eight-fold increase since the census of 1871. The population doubled 54 years after the first census (1925), then again in 35 years (1960), as a result of the relatively high population growth rate. The 2001 census calculated a population 18.7 million. By 2003, the population was estimated to be 19.2 million, a third doubling in 43 years (see Table 1). By 2010, the population of Sri Lanka had passed the 20 million mark.
2
Table 1: Population Growth and Density is Sri Lanka: 1871-2003
Note:Except 1925, 1960 and 2003, the rest are census years.
Source: Department of Census and Statistics, Statistical Abstracts & Census Reports.
The growth of the Sri Lankan population during the present century has not been uniform. Until 1946, the average annual inter-census rate of growth never exceeded 2 % (see Table 1). The post-war years reveal a sudden spurt in the growth rate, which had increased to 2.8 % in the period 1946-53, and remained stable at the higher level during the period 1953-63, while the mortality rate decreased during the period, which in turn caused the population to grow rapidly.
As a reaction to the latent problems caused by such rapid growth, since late 1950, the government has initiated policies and programs to reduce fertility. Consequently, after 1963, a clear decline in the population growth rate was discernible, and at present, it stands at about 1 %.
The effective causes that triggered a decline in the population growth rate are the fertility decline among all fecund age groups of women and an increase in emigration, especially to the Middle Eastern and developed countries.
The present population growth rate is low, but Sri Lanka still adds more than 200,000 people to its population annually. The country covers a land area of 65,610 square kilometers, and ranks as one of the most densely populated in the Asian region. It is estimated that there will be a little more than 300 persons per square kilometer by the turn of the present century (see Table 1).
As in many other countries, the population of Sri Lanka is not evenly distributed. Some parts are very densely populated, while others are less populous. As noted in the last population census of 2001, about 57 % of the population was located in the Wet Zone, which constitutes only about 21 % of the total land area of the country. Colombo, the smallest of the 25 districts in Sri Lanka, has a population density, which is about 11 times the national average. Demographic trends, particularly the growing size of the population, and its uneven distribution, have made a strong
Year Population
(000’)
Average annual growth rate (%)
Density (Per sq
km.)
1871 2.4 million 2,400 - 37
1881 2,760 1.4 43
1891 3,008 0.9 47
1901 3,566 1.7 55
1911 4,106 1.4 63
1921 4,498 0.9 70
1925 4.8 million
1931 5,307 1.7 82
1946 6,657 1.5 103
1953 8,098 2.8 125
1960 9.6 million
1963 10,582 2.7 165
1971 12,690 2.2 196
1981 14,847 1.7 230
2001 18,735 1.2 300
2003 19.2 million 19,252 - 307
Double by 54 yrs
Double by 35 yrs
Double by 43 yrs
3
negative influence on the natural resource base of the country and there have been many efforts to achieve sustainable development and balanced growth.
The current population spread shows a skewed distribution favoring the Western Province and the Wet Zone. The census of 2001 showed that at least one-third of the population, in the 18 districts counted, was concentrated in the Western Province, and at least 80 % in the Wet Zone of the country (Department of Census and Statistics 2001). Urbanization is largely concentrated in these areas. The internal migration pattern of the country indicates that a bulk of the net population addition would be concentrated in and around the Western Province, which has approximately a ten times higher population density, compared to the Sri Lankan average of 307 persons per sq. km. A further increase of population density in the Western Province would aggravate the urban population problems, particularly in the unplanned urban environments.
3. Components of Population Change
3.1 Fertility
The population planning programs and policies from 1960 to 1994, which have been implemented by successive Sri Lankan governments to achieve targeted fertility decline, have been largely responsible for the spectacular decline of the birth rate. Such policy drives were necessary because Sri Lanka had become one of the most densely populated countries in Asia.
Persistent population growth and the consequent pressure on the habitable land have been an increasing concern to the Government. The population growth has been far more rapid than could be sustained by the economy.
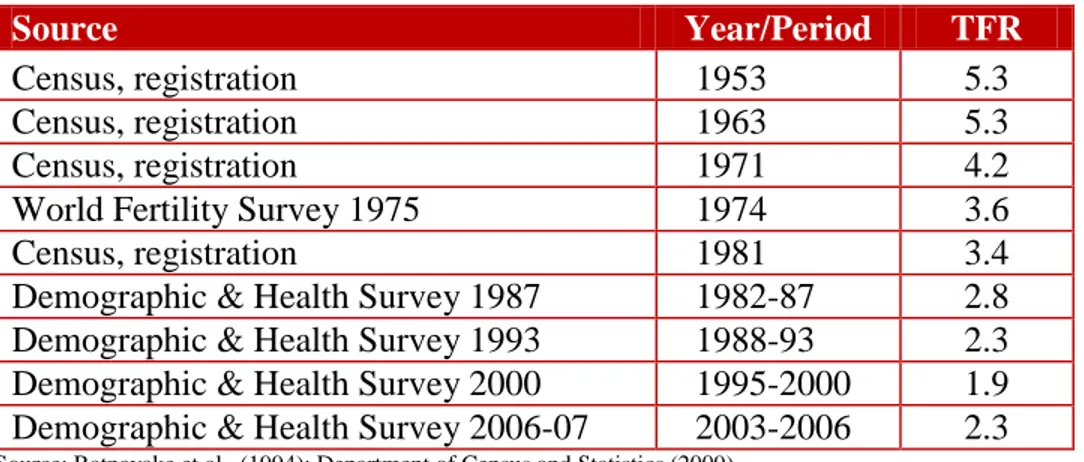
Gradual decline of the TFR from high to low, towards a replacement level is reflected in the rates calculated using data collected from the population censuses, the registration system, and from survey data for more recent levels. The TFR for selected years from 1953 to 2003-2006 are shown in Table 2. The rate decreased from 5.3 in 1953 to 3.4 in 1981, by almost two live births per woman, and dropped to a further 2.8 children per women in 1982-1987, and to 2.3 during 1988-1993 periods. Sri Lanka’s fertility dropped by about 20% during the periods of 1982-1987 and 1988-1993 (Table2).
Since the 1960s, the fertility rate had started to decline, and by 1994, Sri Lanka had experienced several major transitions, reaching the crucial stage of replacement1 level-fertility, and to even below that level. Demographers researching into determinants of population growth predicted that Sri Lanka would reach a TFR of 2.1 by the year 2000. It will be the only country in the South Asian sub-region to achieve that level of fertility before the new century, and ahead of the targeted time frame (De Silva, 1994). A total of 18 countries and areas in the Asian and Pacific region have reached below replacement fertility (Gubhaju, 2008).
1 Replacement-level fertility implies a total fertility rate usually between 2.1 and 2.2 children per woman, depending on a country’s level of mortality. Since the infant mortality rate of Sri Lanka is at a very low level, its replacement fertility is defined as an average of 2.1 children per woman. Usually NRR of 1.0 is considered as the more appropriate measure to represent replacement-level fertility. However, due to unavailability of NRR values for Sri Lanka during the recent past, only TFR values are being used to identify replacement level in this study.
4
Table 2: Total Fertility Rate, 1953 to 2003-2006
Source Year/Period TFR
Census, registration 1953 5.3
Census, registration 1963 5.3
Census, registration 1971 4.2
World Fertility Survey 1975 1974 3.6
Census, registration 1981 3.4
Demographic & Health Survey 1987 1982-87 2.8 Demographic & Health Survey 1993 1988-93 2.3 Demographic & Health Survey 2000 1995-2000 1.9 Demographic & Health Survey 2006-07 2003-2006 2.3
Source: Ratnayake et al., (1994); Department of Census and Statistics (2009).
Below to Above Replacement
The indices related to fertility transition in Sri Lanka, particularly the TFR valued at 1.9 for the period 1995-2000, calculated from the SLDHS 2000, raised the general expectation among researchers that Sri Lankan fertility could remain stable, or even go below the level reported by SLDHS (De Silva, 2007). Nevertheless, at that juncture, needed changes were not imminent in Sri Lanka’s policies and programs to maintain the level of fertility at the replacement or even at a lower plane.
Meanwhile, since the SLDHS 2006-07 indicated an unexpected increase in the TFR, the hypothesis of replacement level fertility, or even below that level in Sri Lanka in the new millennium was unconfirmed. The expectations of the population planners were not fulfilled.
According to SLDHS 2006-07 (Table 2), the TFR calculated to be 1.9 during 1995-2000 had increased to 2.3 during the three years (2003-2006). The already existent below replacement fertility had increased to above replacement level. A reversed trend simply had surfaced in Sri Lankan fertility transition. The current fertility level of the TFR at 2.3 is identical with that observed in 1993 SLDHS for the 1988-93 period. Within the developing region, no single country has shown this kind of fluctuation in the TFR, once it had reached below the
replacement level.
5
Figure 1: Change of TFR in Sri Lanka and Republic of Korea
Sources: Date for Republic of Korea obtained from www.prb.org.
Data for Sri Lanka from various sources of Department of Census and Statistics.
Sri Lankan Fertility Change in the Regional Context
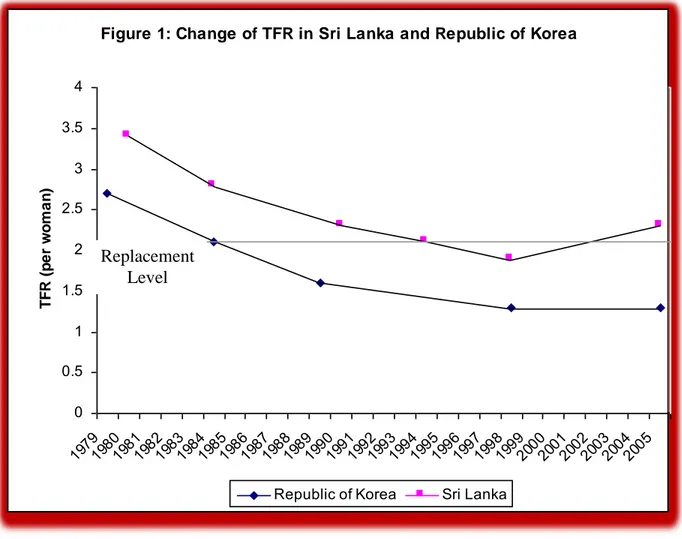
In the context of the economic transition that is taking place in Sri Lanka, it is logical to compare the fertility decline in the country with that of a newly industrialized economy (NIE). Congruent patterns of fertility decline can be observed when Sri Lanka’s declining fertility levels and patterns are compared with that of the Republic of Korea. As shown in (figure1), the similarities are clear. Both Sri Lanka and the Republic of Korea show the same pattern of fertility decline, but Sri Lanka’s fertility levels have always remained higher than those of the Republic of Korea.
The Korean TFR dropped from 2.7 in 1980 to a replacement level in 1985, i.e., within a period of just five years (KIHASA, 1992). Whereas, Sri Lanka took about eight years for the TFR to drop from 2.7 in 1986 to the replacement level in 1994. The Republic of Korea had reduced fertility to below the replacement level (1.7) during the 1990-1995 period (Gubhaju, 2008). By 1998, the Korean TFR subsequently had reached the level of 1.3, which was very much below the level which prevailed in Sri Lanka at that time.
Figure 1: Change of TFR in Sri Lanka and Republic of Korea
0 0.5 1 1.5 2 2.5 3 3.5 4
1979 1980
1981 1982
1983 1984
1985 1986
1987 1988
1989 1990
1991 1992
1993 1994
1995 1996
1997 1998
1999 2000
2001 2002
2003 2004
2005
TFR (per woman)
Republic of Korea Sri Lanka
Replacement Level
6
The reverse fertility trend, observed in Sri Lanka since 2000-2005, brought it closely at par with
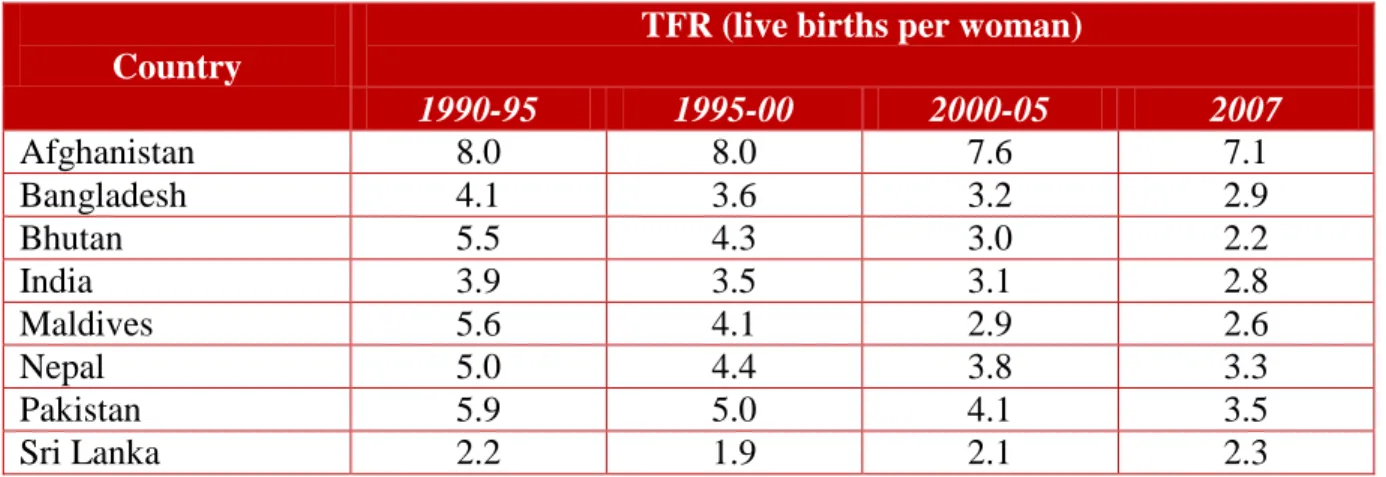
‘not yet replaced’ fertility levels of a number of South Asian countries (Table 3). The exception is the TFR of Bhutan, a land locked country in the South Asian region. Bhutan’s fertility level was 0.1 % less than that of Sri Lanka in 2007. Nevertheless, at that time, the TFR of Sri Lanka was still the second lowest compared with all the other South Asian countries. However, in all the other South Asian countries, the TFR had gradually been declining during the period 2000- 2005 (Table 3). In contrast, Sri Lanka indicated an increasing trend in its TFR level, from 1.9 to 2.1 during the period, and to 2.3 in 2007.
Table 3: Total Fertility Rate (live births per woman) by Country in South Asia
Country
TFR (live births per woman)
1990-95 1995-00 2000-05 2007
Afghanistan 8.0 8.0 7.6 7.1
Bangladesh 4.1 3.6 3.2 2.9
Bhutan 5.5 4.3 3.0 2.2
India 3.9 3.5 3.1 2.8
Maldives 5.6 4.1 2.9 2.6
Nepal 5.0 4.4 3.8 3.3
Pakistan 5.9 5.0 4.1 3.5
Sri Lanka 2.2 1.9 2.1 2.3
Source: UNESCAP (2008); Sri Lankan data derived from Table 2.
Age Pattern of Fertility
The broader picture of fertility behavior can be comprehended through an analysis of age specific fertility rates. The age patterns of fertility indicate the tempo of childbearing, i.e., the age at which women begin to reproduce, when they cease childbearing, and any change in the pattern of childbearing over time. For example in Taiwan, where below replacement fertility has been achieved, fertility decline towards the replacement level occurred among all women of reproductive years (Lee, 2009).
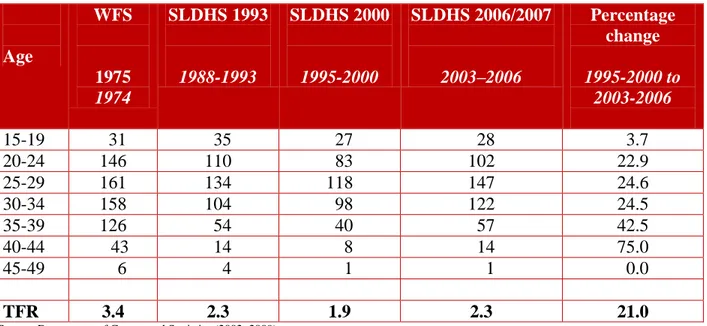
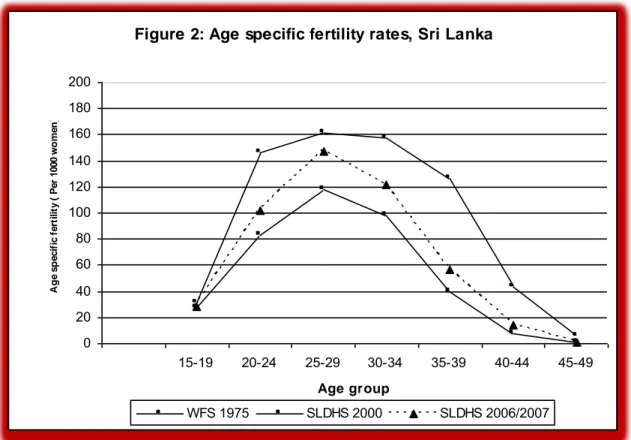
Recent changes in the age specific fertility rates in Sri Lanka further support the contention that fertility levels had been increasing during the period 2003-2006 (Table 4). As shown in Figure 2 and Table 4, the age-specific fertility rates in the country increased in the early twenties, peaking in the age group 25-29 years, a slightly uneven plateau formation in the consequent years, and a gradual decline with declining fecundity of women. Over many decades, there had been no change in this age pattern of fertility. Between 1975 and 1993, large fertility reductions had occurred among all the age groups, except for teenage fertility (Table 4). Age specific fertility of all age groups had further declined significantly between 1993 and 2000. Thus, as depicted in Figure 2, between 1975 and 2000, older women and younger ones experienced a remarkable decline in fertility in this 25-year period.
7
Table 4: Age-Specific Fertility Rates of Sri Lanka (per 1,000 women)
Age
WFS
1975 1974
SLDHS 1993
1988-1993
SLDHS 2000
1995-2000
SLDHS 2006/2007
2003–2006
Percentage change 1995-2000 to
2003-2006
15-19 31 35 27 28 3.7
20-24 146 110 83 102 22.9
25-29 161 134 118 147 24.6
30-34 158 104 98 122 24.5
35-39 126 54 40 57 42.5
40-44 43 14 8 14 75.0
45-49 6 4 1 1 0.0
TFR 3.4 2.3 1.9 2.3 21.0
Source: Department of Census and Statistics (2002; 2009).
De Silva, (1991) examining the prevailing declining pattern of ASFR concluded that ‘women in Sri Lanka are inclined to limit the number of children at a relatively early age.’ In Sri Lanka, until the year 2000, no change in the declining pattern of fertility had been observed in women from all socioeconomic strata. With the dawn of the new century, the age pattern of fertility for all ages, except the 45-49 age group, changed significantly by demonstrating a sudden unexpected increase. The ASFR’s for the 25-39 age group in the 2006-07 SLDHS were even higher than the corresponding values reported in the 1993 SLDHS (Table 4).
The percentage change in ASFRs of the 2000 and 2006-07 SLDHS show that the largest increase was among the 35-44 age group. Although fertility had increased, the relative fertility change of the age group in which peak fertility occurred was slight, and the age pattern of fertility had remained unchanged (Figure 2). The latest SLDHS data show that the peak ASFR of 25-29 age group women, calculated as 147 per thousand women of that age group, is only 14 points less than the peak value of 161 per thousand women reported in the 1975 WFS (Table 4).
8
Figure 2: Age specific fertility rates, Sri Lanka
Source: Data based on - Department of Census and Statistics, 2002; 2009.
The adolescent fertility rate (15-19 age group) of Sri Lanka had increased by only 1% during the period 1995 to 2005. It remained constant thereon, even though the fertility rate of this age group had declined in most of the other developing countries except Pakistan, where a 14 point increase is indicated during the period 2005 to 2010 (Table 5). Substantial declines in the adolescent fertility rate have occurred in Afghanistan, Bhutan and Nepal, countries that had relatively higher teenage TFRs throughout the period (Table 5).
Table 5: Adolescent fertility (ASFR 15-19) rate by country in South Asia
Country
ASFR 15-19 (live birth per 1000 females aged 15-19)
1995-00 2000-05 2005-10
Afghanistan 166 131 113
Bangladesh 151 149 124
Bhutan 73 50 37
India 99 69 62
Maldives 45 26 23
Nepal 127 122 115
Pakistan 68 22 36
Sri Lanka 27 28 28
Source : UNESCAP (2008).
Figure 2: Age specific fertility rates, Sri Lanka
0 20 40 60 80 100 120 140 160 180 200
15-19 20-24 25-29 30-34 35-39 40-44 45-49 Age group
Age specific fertility ( Per 1000 women)
WFS 1975 SLDHS 2000 SLDHS 2006/2007
9
Determinants of Decline and Subsequent Increase in Fertility
Fecundity, a naturally complex process is also affected by several socioeconomic and biological variables. Additionally, the decrease or increase of the fertility level in any given country is largely determined by three non-genetic factors, such as changes in the age at marriage, use of contraception, and the practice of induced abortion, with a differential impact of these changing agents on fertility. For instance, an increase in the average age at marriage of females could have a negative impact on fertility, while a decrease in the age at marriage could affect the level of fertility in an opposite way (Jones, 2007).
Trends in Marriage Timing
The postponement of marriage contributes substantially towards a reduction in the level of fertility by limiting the total reproductive lifespan of the female, the cumulative effect of which influences the size of the individual families, and the population growth rate of the country. In Sri Lanka, during the past century, the female age at marriage increased almost by seven years.
The delay in marriage, and its impact on fertility, has led Krik (1969) to refer to Sri Lanka as
“the Ireland of Asia.” Caldwell and others (1989) identified Sri Lanka as the leader in Third World Asia to experience a changing pattern in the age at marriage. By the mid-1970s, Sri Lankan females were marrying not at puberty but a decade later.
Universal marriage of females at an early age is common in a large number of South Asian countries. Sri Lanka, where marriage occurs very late and may no longer be considered as universal, is an exception to this regional convention. About 9% of females in the age group 40- 44 and 5% in the 45-49 age group were never married and an upward movement of these never- married proportions had been a conspicuous general trend until recent times.
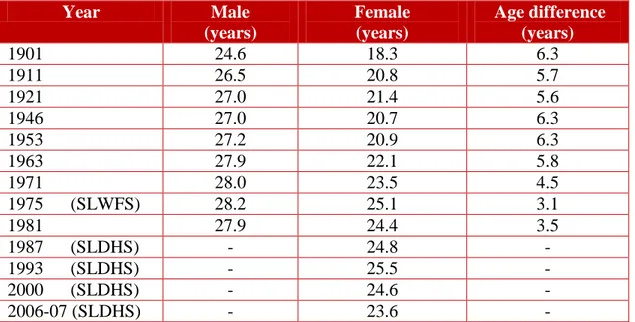
Postponement of the formal family formation in Sri Lanka is reflected in the behavior of the rate of marriage measure, the singulate mean age at marriage (SMAM) of females, which had increased by almost five years, from 18.3 years in 1901 to 23.5 in 1971 (Table 6). There was a slight decline of SMAM during the period 1975 to 1981, and since then, the average age at marriage of Sri Lanka has increased. On average, by 1993, females were marrying at the age of 25.5 years. Much research has indicated that up to 1970, marriage postponement in Sri Lanka was responsible for about 60 % of the fertility decline. Nevertheless, from the middle of the last decade of the twentieth millennium, the average age at marriage of females in Sri Lanka displayed a gradual decline. A noteworthy occurrence is that the latest SMAM of females (23.6 years), reported in 2006-07 SLDHS, is very much comparable with the corresponding figure of 1971.
10
Table 6: Trends in Singulate Mean Age at Marriage in Sri Lanka
Year Male
(years)
Female (years)
Age difference (years)
1901 24.6 18.3 6.3
1911 26.5 20.8 5.7
1921 27.0 21.4 5.6
1946 27.0 20.7 6.3
1953 27.2 20.9 6.3
1963 27.9 22.1 5.8
1971 28.0 23.5 4.5
1975 (SLWFS) 28.2 25.1 3.1
1981 27.9 24.4 3.5
1987 (SLDHS) - 24.8 -
1993 (SLDHS) - 25.5 -
2000 (SLDHS) - 24.6 -
2006-07 (SLDHS) - 23.6 -
Sources: Various sources of Department of Census and Statistics.
Data presented in Table 6 indicate that the SMAM of males was around 28 years for some time since 1981. It is to be noted that data is not available to study the recent trends in male age at marriage. Since the increase in the male age at marriage has been less rapid, the sex differential of the marrying age had dropped from over six years in 1901 to just over three years in 1981.
In Sri Lanka, the exposure to conception is closely related with the marital union. Therefore, it is logical to assume that increasing average age at marriage, particularly of females, is negatively related with fertility. The decreasing trend of female SMAM during the recent past would have at least partially contributed to the recent increase in fertility in Sri Lanka.
Trends in Contraceptive Use
High and effective prevalence of contraceptive methods is an important non-genetic determinant of the declining fertility level in a community. It is useful to examine the trends in the use of contraception in Sri Lanka and the recent changes in the prevalence rates if any, to elucidate the causes of recent fertility increase in the country. After 1970, the key determinant in the fertility decline was the control of fertility within marriage, and the decline in consequent martial fertility (Trussell, 1980; McCarthy, 1982). As suggested by the available evidence, the decline in marital fertility in Sri Lanka began before the national family planning program could have had much impact on the fertility decline (Alam and Cleland, 1981; Langford, 1982). After the inauguration of the national family planning program in 1965, the Government adopted a “cafeteria”
approach, whereby the users could select the contraceptive method of their choice from a wide range available to them through the national program (Dangalle, 1989). In addition to the public sector, a number of nongovernmental organizations (NGOs) provided family planning services.
11
The level of contraceptive use among Sri Lankan women increased rapidly in the period following 1970. There was increasing awareness of contraception, not only for the purpose of cessation of childbearing, but also for the spacing of births. The level of contraceptive use increased from 34 % in 1975 to 62 % in 1987 and further to 70 % in 2000 (Table 7).
Table 7: Trends in Current Contraceptive Use by Modern and Traditional Methods Among Currently Married Women aged 15-49
Type of method
SLWFS 1975
SLCPS 1982
SLDHS 1987
SLDHS 1993
SLDAS 2000
SLDAS 2006-07
Modern 20.2 31.8 40.6 43.7 49.5 53.1
Traditional 14.2 26.0 21.1 22.4 20.5 17.0
All 34.4 57.8 61.7 66.1 70.0 70.2
Source: Various sources of Department of Census and Statistics.
The contraceptive prevalence had hardly changed during the present decade. According to the 2006-07 SLDHS, 70.2 % of the currently married women of reproductive ages were using contraceptives (Department of Census & Statistics, 2009).
The acceptance of modern contraception in Sri Lanka is a relatively recent development.
According to the 1975 WFS Survey, 59 % of the current users of contraception were relying on modern methods, and the SLDHS 1987 (estimated) show that the proportion of modern method users had increased to 66 % (40.6/61.7)*100). This same estimation procedure, using SLDHS 2006-07, indicated that the corresponding proportion had further increased to 76 % (53.1/70.2)*100). Even at present, among current users, about one-quarter rely on traditional methods (Table 8), which implies that a substantial proportion of users in Sri Lanka still rely on the traditional methods.
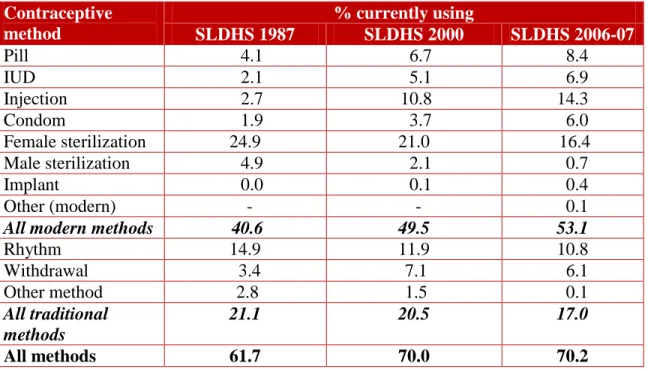
Significant changes have taken place recently, concerning the preferred contraceptive methods, within the category of modern methods. Although modern temporary methods show a continuous increase, the same is not observed with regard to permanent methods. The latest SLDHS show that the proportions that use terminal methods, identified as male and female sterilization, had declined remarkably. For instance, of the currently married women in 1987, one-quarter relied on female sterilization, but by 2006-07 the corresponding figure had dropped to 16.4 % (Table 8). The same pattern of preference was observed regarding the male sterilization.
12
Table 8: Current Contraceptive Use by Method among Currently Married Women aged 15-49
Contraceptive method
% currently using
SLDHS 1987 SLDHS 2000 SLDHS 2006-07
Pill 4.1 6.7 8.4
IUD 2.1 5.1 6.9
Injection 2.7 10.8 14.3
Condom 1.9 3.7 6.0
Female sterilization 24.9 21.0 16.4
Male sterilization 4.9 2.1 0.7
Implant 0.0 0.1 0.4
Other (modern) - - 0.1
All modern methods 40.6 49.5 53.1
Rhythm 14.9 11.9 10.8
Withdrawal 3.4 7.1 6.1
Other method 2.8 1.5 0.1
All traditional methods
21.1 20.5 17.0
All methods 61.7 70.0 70.2
Sources: Department of Census and Statistics (2002; 2009).
Comparison of the two analytical periods also confirms that a remarkable decline in the proportion of women relying on the use of terminal methods had taken place. When the latest period 2000 to 2006-07 is compared to the previous periods 1987 and 2000, the proportions which used such methods, especially male and female sterilization, was higher during the previous phase than the proportion of the users of such methods in the latest period. This trend raises a pertinent question, whether there is an unmet demand for sterilization among Sri Lankan women, and whether the imbalance in the service delivery of permanent methods of family planning is caused by any unrevealed socio-cultural and religious issues, which have an effect on the fertility level of married women. Or, it may be a question of choice where women have diverted their reliance from contraception to induced abortion.
Practice of Induced Abortion
Despite the highly restrictive abortion law in Sri Lanka, indictments for criminal abortion hardly ever occur and offenders were rarely persecuted for abortion. In the past, the several attempts made by the Sri Lankan Government to liberalize the country’s harsh abortion law were negated on moral grounds by the anti-abortion social leadership. Thus, abortion remains illegal in Sri Lanka under Article 303 of the Penal Code2 of 1883.
Researchers tend to believe that prevalence of abortion in Sri Lanka is a legally unrecognized fertility control method (Langford, 1982: Caldwell and others, 1987: De Silva, 1991). A survey
2 Section 303 of the Penal Code provides that anyone voluntarily causing a woman with child to miscarry is subject to up to three years imprisonment and/or payment of a fine, unless the miscarriage was caused in good faith in order to save the life of the mother. A woman who induces her own miscarriage is subject to the same penalties.
13
conducted as early as 1984 using in-depth interviewing methods (Caldwell and others, 1987) showed that most couples in Sri Lanka believed that induced abortion occurred to a limited extent, while approximately one-fourth of respondents felt that it was common. The majority of those against induced abortion held adverse views on the practice of induced abortion, because of the danger rather than the associated immorality. However, during last two to three decades, the abortion services have become increasingly therapeutic. Thus, serious post abortion complications and deaths rarely have been reported.
There is concurrence among researchers engaged in abortion related research that evidence suggest there are about 125,000 to 225,000 induced abortions performed annually in Sri Lanka (De Silva & others, 2006). A community survey with a total population of over 100,000 gathered abortion experiences during the preceding three years. The study adopting the Randomized Response Technique (RRT), reported that on the average, the induced abortion rate of married women of reproductive ages amounted to 10.89 per 1,000 married women.
Although national surveys such as SLDHS had attempted to collect information on the incidence of induced abortion in Sri Lanka, the incidents were grossly under-reported. According to SLDHS 2000, among 6,385 ever married women of reproductive ages, 76 had induced abortions during their lifetime, which is even lower than the number of induced abortions amounting to 152 reported in the SLDHS 1993. The above pattern of reporting of the incidence of abortions may be due to the labeled criminality of the issue, while it also confirms the difficulty of collecting reliable data on induced abortions through official national surveys.
Undoubtedly the abortion services provided by NGOs and other service deliverers might have contributed significantly to the achievement of below replacement fertility in Sri Lanka. The general agreement among the researchers on marital status of the abortion seekers were that about 90-95 % of clients were married women.
A number of studies have shown that even though a small proportion of abortion seekers were not relying on any form of contraception, among those who used contraception, over two-thirds relied on traditional methods that had significantly higher failure rates when compared to the modern methods. Those who relied on traditional methods to prevent conception would have done so with the knowledge and assurance that other methods such as the induced abortion services for termination were available and could be used in case of unexpected pregnancy. Even though induced abortion is illegal, abortion services are available in many parts of the country at an affordable price.
3.2 Mortality
An accurate analysis of mortality trends using time series data is handicapped by the non- availability of reliable data for the earlier phase of past years, though a definite downward trend in the death rate is noticeable since 1921. The period 1921-1945 was generally a period of general decline in mortality (United Nations, 1976). Nevertheless, there were occasional bad years in which a heavy toll on deaths had occurred. The rapid mortality decline, observed during the post-World War II period in Sri Lanka, contributed towards achieving a phenomenal increase in the life expectancy of the Sri Lankan population. A parallel pattern of mortality decline during
14
the same period was observed in a number of other developing countries, including Mauritius, Cuba, and Mexico.
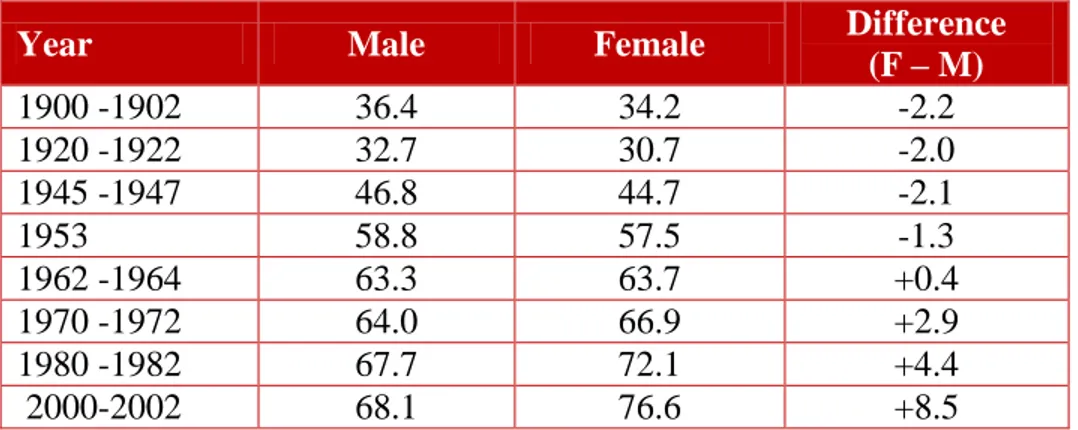
Sri Lanka has progressed substantially in reducing the mortality level of its population during a period covering more than seven decades, particularly between 1946 and 1981. The crude death rate declined from 30 deaths per 1,000 population in 1920 to six deaths by 2003. During this period, the life expectancy at birth increased by 21 years for men and 27 years for women. In 1952, female life expectancy was 2.1 years lower than that of males; however, the estimated life expectancy for the period 1980-1982 showed that the sex differential of life expectancy was 4.4 years higher for females. The estimated longevity of life for males during this period was 67.7 years and for females 72.1 years (Table 9).
Table 9: Life Expectancy at Birth (in years)
Year Male Female Difference
(F – M)
1900 -1902 36.4 34.2 -2.2
1920 -1922 32.7 30.7 -2.0
1945 -1947 46.8 44.7 -2.1
1953 58.8 57.5 -1.3
1962 -1964 63.3 63.7 +0.4
1970 -1972 64.0 66.9 +2.9
1980 -1982 67.7 72.1 +4.4
2000-2002 68.1 76.6 +8.5
Source: Department of Census & Statistics (1991); De Silva (2008).
The sharp decline in mortality in the post-World War II period was largely due to the eradication of malaria, expansion of health and education services, and better distribution of food supplies due to the general improvements in the country’s economy (United Nations, 1976). The social infrastructure that was developed before Independence and the improvements in the economic well-being, together with an increase in the average level of consumption (Ministry of Health &
Women’s Affairs, 1992), rapidly yielded positive results in terms of an increase in the life expectancy among the Sri Lankan population. The health related indicators for Sri Lanka demonstrate a success story, despite the fact that compared to many countries in the world, the health expenditure in Sri Lanka is significantly low by any standard (WHO, 2002).
The efficient performance of the health system is mainly linked to the socioeconomic and political status of a given country. The life expectancy, derived from the life tables for Sri Lanka, using the latest available data, indicate an expected longevity of 68.1 years at birth for males in 2000-2002, a marginal increase of only 0.4 years higher than the figure reported (67.7 years) for 1980-1982. In contrast to males, the expectancy of life for females had increased from 72.1 to 76.6 years during these two periods, showing an increase of almost five years (Table 9). This trend shows that unlike in the past, large sex differences in life expectancy continue at present in Sri Lanka. In the 1980-1982 period, the gender difference of longevity was only 4.4 years, while in the 2000-2002 period it had increased to 8.5 years.