Low Tube Voltage Liver MDCT
with Sinogram-Affirmed Iterative Reconstructions for the Detection of Hepatocellular Carcinoma
B. Pregler1, L. P. Beyer1, A. Teufel3, C. Niessen1, C. Stroszczynski1, H. Brodoefel2 &
P. Wiggermann 1
Aim of this study was to compare low tube voltage computed tomography (80 kV) of the liver using iterative image reconstruction (SAFIRE) with standard computed tomography (120 kV) using filtered back-projection (FBP) for the detection of hepatocellular carcinoma (HCC). 46 patients (43 men) with 93 HCC confirmed by 3 T MRI with Gd-EOB-DPTA, in inconclusive cases combined with contrast-enhanced ultrasound, underwent dual-energy CT. The raw data of the 80 kV tube was reconstructed using the iterative reconstruction algorithm SAFIRE with two strengths (I3 and I5). The virtual 120 kV image data set was reconstructed using FBP. The CT images were reviewed to determine the lesion-to-liver contrast (LLC), the lesion contrast-to-noise ratio (CNR) and the sensitivity. The LLC (57.1/54.3 [I3/I5] vs. 34.9 [FBP]; p ≤ 0.01), CNR (3.67/4.45 [I3/I5] vs. 2.48 [FBP]; p < 0.01) and sensitivity (91.4%/88.2% [I3/I5] vs.
72.0% [FBP]; p ≤ 0.01) were significantly higher in the low-voltage protocol using SAFIRE. Therefore, low tube voltage CT using SAFIRE results in an increased lesion-to-liver contrast as well as an improved lesion contrast-to-noise ratio compared to FBP at 120 kV which results in a higher sensitivity for the detection of HCC.
Contrast-enhanced imaging plays a central role in the diagnosis of hepatocellular carcinoma (HCC) and is used both for follow-up and for early detection in high-risk patients. Arterial hypervascularization with character- istic contrast agent washout is considered to be sufficient evidence of an HCC1–3. If a definite diagnosis cannot be made in contrast-enhanced CT or MRI, a second dynamic study is recommended4. 3-Tesla (3T) MRI with liver-specific contrast agent (Gd-EOB-DPTA) is currently considered the imaging modality with the highest sensitivity (86%) and PPV (94%) in clinical routine for detection and characterization of HCC5.
To diagnose HCC on computed tomography, the maximum possible contrast difference between the HCC lesion and the surrounding liver parenchyma (lesion-to-liver contrast (LLC)) should be targeted. A promising approach to improved detection of HCC in computed tomography is the use of low tube voltage (80 kV) since the mean photon energy of 47 keV to 56 keV is close to the absorption maximum of iodine (33.2 keV)6. Therefore, significantly higher levels of contrast can be achieved when using iodine-containing contrast agent at a low tube voltage than at a high tube voltage7, 8.
Although the theoretical advantages of low tube voltage protocols have long been known, they are partially offset by an increased image noise which has prevented the routine use of low tube voltage in clinical imaging.
Two technical innovations have recently allowed to compensate the loss of image quality: the technical ability of modern X-ray tubes to provide a stable high tube current even at low voltage and the use of iterative reconstruc- tion algorithms, such as SAFIRE9, 10.
We postulated that a combination of a low tube voltage protocol and an iterative reconstruction algorithm could result in an increase of LLC of HCC compared to the common 120 kV protocol in combination with filtered back-projection (FBP), the standard reconstruction method. The goal of this study was to compare low tube voltage computed tomography (80 kV) using iterative reconstruction (SAFIRE) to a routine CT protocol with
1Department of Radiology, University Hospital Regensburg, Regensburg, Germany. 2Institute of Radiology, Hospital Ortenau Lahr-Ettenheim, Lahr, Germany. 3Department of Internal Medicine I, University Hospital Regensburg, Regensburg, Germany. B. Pregler and L. P. Beyer contributed equally to this work. Correspondence and requests for materials should be addressed to B.P. (email: benedikt.pregler@ukr.de)
Received: 25 May 2017 Accepted: 2 August 2017 Published: xx xx xxxx
OPEN
120 kV and image data reconstruction via FBP. 3T MRI using Gd-EOB-DPTA, in inconclusive cases combined with contrast-enhanced ultrasound, served as the gold standard11.
Materials and Methods
Study design and patient characteristics. The prospective single-center study was approved by the Ethics Committee of the University Regensburg (approval number 14-101-0325) and carried out in accordance with the relevant guidelines and regulations.
All patients with confirmed HCC who were examined at our institute between March 2015 and April 2016 via computed tomography were included. Written consent for participation in the study as well as publication in anonymized form was obtained from all patients. Exclusion criteria were diffuse HCC and contraindications for MRI examination.
If 3T MRI with the liver-specific contrast agent gadolinium-ethoxybenzyl diethylenetriamine pentaacetic acid (Gd-EOB-DTPA, Primovist®; Bayer Schering Pharma, Berlin, Germany) was not available or older than 14 days at the day of the CT scan, a MRI examination performed as part of the study protocol was added. The 3T MRI were evaluated in consensus by two experienced abdominal radiologists according to LI-RADS criteria12. In the cases with inconclusive image findings additional contrast-enhanced ultrasound or biopsy was performed for lesions having high probability of being HCC (LR-4) as part of our clinical routine. Following our study goal and to avoid any ambiguities regarding our defined gold standard we only included hypervascular HCC lesions.
In total, 46 patients with 93 arterial hyperenhancing HCC lesions were able to be included in the study. See Table 1 for the basic characteristics.
CT acquisition. All patients were examined on a dual-source CT scanner (SOMATOM Definition® Flash,
Siemens Healthcare, Forchheim, Germany). The intravenous injection of 120 ml of contrast agent (Accupaque 350, GE Healthcare Buchler, Braunschweig, Germany) was performed with a flow rate of 4 ml/s followed by an injection of 40 ml of NaCl. Acquisition in the arterial phase was performed via bolus tracking (CARE Bolus, Siemens Healthcare, Forchheim, Germany) in the aorta with a threshold of 100 HU and a delay of 17 seconds.
All CT scans were acquired in dual-energy mode with tube voltages of 80 kV and 140 kV and the settings specified in Table 2. To reduce the radiation dose, the manufacturer’s own automatic tube current modulation (CareDOSE 4D, Siemens Medical Solutions, Forchheim, Germany) was activated.
CT image reconstruction. Iterative reconstruction of the 80 kV raw data was performed using the SAFIRE algorithm (Siemens Healthcare, Forchheim, Germany) at a medium and high setting (I3 and I5) and a soft tissue kernel (I31f). A virtual data set with 120 kV, 70% of which was comprised of the data from the 140 kV tube and 30% of the data from the 80 kV tube, was calculated from the raw data for the two tubes. Virtual 120 kV data was reconstructed using filtered back-projection (FBP) and a soft tissue kernel (B30f). Both image data sets were generated with a slice thickness of 3 mm and an increment of 3 mm.
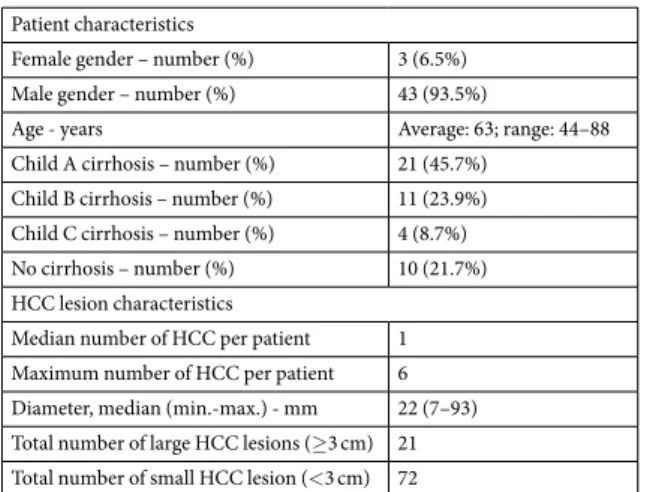
Patient characteristics
Female gender – number (%) 3 (6.5%) Male gender – number (%) 43 (93.5%)
Age - years Average: 63; range: 44–88
Child A cirrhosis – number (%) 21 (45.7%) Child B cirrhosis – number (%) 11 (23.9%) Child C cirrhosis – number (%) 4 (8.7%) No cirrhosis – number (%) 10 (21.7%) HCC lesion characteristics
Median number of HCC per patient 1 Maximum number of HCC per patient 6 Diameter, median (min.-max.) - mm 22 (7–93) Total number of large HCC lesions (≥3 cm) 21 Total number of small HCC lesion (<3 cm) 72
Table 1. Basic characteristics of patients and HCC lesions.
Collimation 14 × 1.2 mm
Rotation time 0.5 s
Pitch 0.6
Tube voltage 80 kV: A tube; 140 kV: B tube Reference current strength 550 mAs: A tube; 213 mAs: B tube
Table 2. Technical settings for acquiring raw CT data.
MRI acquisition. All MRI scans were acquired within a defined time frame (<2 weeks before/after CT exam- ination) on a 3T MRI scanner (Magnetom Skyra, Siemens Healthcare) with a combination of body and spine coil elements for signal reception. T1-weighted VIBE (volumetric interpolated breath-hold examination) sequences with fat suppression (repetition time (TR) 3.09 ms; echo time (TE) 1.16 ms; flip angle 9°; number of excitations 1; slices 64; reconstructed voxel size 1.3 × 1.3 × 3.0 mm; measured voxel size 1.7 × 1.3 × 4.5 mm) over the entire liver were performed prior to contrast administration and up to 20 minutes after contrast administration. Every sequence was generated during breath-hold and without further system adjustment after contrast administration.
Every patient received a quantity of Primovist as a bolus via a peripheral venous access adapted to the patient’s body size and weight (0.025 mmol/kg body weight) at a flow rate of 1 ml/s. The access was purged with 20 ml of NaCl.
CEUS acquisition. In inconclusive cases, additional CEUS was performed according to our clinical rou- tine pattern. All patients were examined by an experienced radiologist with national DEGUM stage III using a multi-frequency probe (1–5 MHz, LOGIQ E9, GE). Dynamic CEUS was performed with a bolus injection of 2.4 ml highly echogenic sulfur hexafluoride microbubbles (SonoVue®, Bracco, Milan, Italy) followed by 10 ml of a 0.9% saline bolus. Continuous scanning was conducted for 3 minutes starting immediately after injection to approve or disconfirm the suspected HCC lesions.
Quantitative image analysis. CT scans were evaluated quantitatively by the study coordinator. To quan- tify the image data, predefined circular regions of interest (ROI) were placed in the following locations: in the subcutaneous fat tissue, in the liver parenchyma, in the aorta at the level of the coeliac trunc, and in the largest HCC lesion at the maximum diameter. The shape and size of the ROI were constant for all measurements.
For the objective evaluation of image quality and visibility of the HCC, the following parameters were recorded:
• The lesion-to-liver contrast (LLC) was defined as the difference between the mean density of the HCC lesion and mean density of the surrounding liver parenchyma (LLC = HULesion − HULiver).
• The lesion contrast-to-noise ratio (CNR) was defined as the quotient of the lesion-to-liver contrast divided by the image noise (determined by the standard deviation of the density values within a ROI in the subcutaneous fat tissue [SDFat tissue]): CNR = LLC/SDFat tissue.
Qualitative image analysis. The CT scans were evaluated subjectively by two radiologists with abdominal imaging experience. The images were analyzed on two high-resolution monitors used in the clinical diagnostic routine (RX 220 EIZO, Ishikawa, Japan) in a defined soft-tissue window (width: 350 HU, center: 50 HU). The dif- ferently reconstructed CT data sets (80 kV IR3, 80 kV IR5, 120 kV FBP) were evaluated in three separate sessions at an interval of at least 4 weeks to minimize a recall bias. All patient-specific data were masked.
The evaluators independently documented the following parameters for all examinations and then came to a consensus decision:
• Location and number of HCC lesions
• Confidence level regarding the maximum number of HCC lesions (1 very confident; 2 somewhat confident;
3 not confident)
• Confidence level that at least one HCC lesion is present in the particular case (1 very confident; 2 somewhat confident; 3 not confident)
• Score to evaluate image quality based on the clinical assessability of the liver artery (1 excellent quality; 2 good quality; 3 moderate quality; 4 non-diagnostic quality)
Statistical analysis. The JMP statistics software package (SAS Institute, Cary, NC, USA) was used for all statistical calculations. A p-value of ≤0.05 was considered statistically significant. McNemar’s test was used to compare sensitivity at different image reconstruction and tube levels. Chi-squared test was employed to compare sensitivity between small and large HCC lesions for each reconstruction. Not normally distributed data were compared using the Mann-Whitney U-test and normally distributed data using the t-test.
Data Availability. The datasets generated during and/or analysed during the current study are available from the corresponding author on reasonable request.
Results
Quantitative image analysis. Table 3 shows the objective image parameters for every reconstruction in the arterial phase. The average image noise (SDFat tissue) is significantly decreased in the iterative reconstruction I5 at 80 kV compared to FBP with 120 kV. In contrast, no significant difference was seen between the iterative reconstruction I3 at 80 kV and FBP with 120 kV (p = 0.17).
The lesion-to-liver contrast (LLC) and the lesion contrast-to-noise ratio (CNR) were significantly higher at 80 kV with iterative reconstructions I3 and I5 than at 120 kV with filtered back-projection (Fig. 1).
Qualitative image analysis. The sensitivity for the detection of HCC lesions was significantly higher at 80 kV with iterative reconstruction using SAFIRE (I3 and I5) than at 120 kV with standard FBP. The highest sen- sitivity (91.4%) was achieved using iterative reconstruction strength 3 (I3) (Table 4).
Two transient hepatic attenuation differences (THAD) and two small arterioportal shunts were falsely classi- fied as HCC using the low tube voltage protocol at both reconstruction strengths (I3 and I5).
The confidence level of the readers in the evaluation of the maximum number of HCC lesions and regarding the presence of at least one HCC lesion was significantly increased at a low tube voltage with iterative image reconstruction compared to 120 kV with FBP.
The sensitivity for large HCC lesions was significantly higher only for 120 kV with standard FBP. A 100% sen- sitivity was reached for large lesions using 80 kV with iterative image reconstruction (I3 and I5) (Table 5).
The subjective image quality based on the clinical assessability of the liver artery was significantly lower using 80 kV with iterative reconstruction for both IR3 (2.26) and IR5 (3.04) compared to 120 kV with FBP (1.37;
p < 0.01).
Discussion
The theoretical advantage of a low tube voltage when acquiring contrast-enhanced CT scans is known and can be attributed to the low absorption maximum of iodine (32 kV).
Due to two technical innovations, a trend toward a low tube voltage has recently been observed: First, modern CT X-ray tubes can now guarantee a stable tube current even at a low voltage9. Second, new iterative reconstruc- tion algorithms (at least partially) offset the negative effect of the increase in noise13.
The goal of our study was therefore to compare a combination of low tube voltage (80 kV) and SAFIRE recon- struction to the conventional CT protocol with 120 kV and FBP for the detection of HCC.
Lowering of the tube voltage in computed tomography while maintaining the same current strength results in a significant increase in image noise. Therefore, it was shown, for example, in an earlier study that the image noise was significantly increased in abdominal CT examinations with a low tube voltage (90 kV) compared to traditional CT examinations with 120 kV. Although the level of contrast measured in the aorta increased sig- nificantly as a result of the lowering of the tube voltage, the image noise also increased significantly so that the contrast-to-noise ratio became less favorable overall8.
The effect of the increase in image noise and the associated decrease in the contrast-to-noise ratio can, at least partially, be minimized or offset by new iterative reconstruction algorithms10. A number of studies were able to show that image noise can be reduced and the contrast-to-noise ratio can be increased in low-dose protocols compared to standard protocols by using SAFIRE14–16. Data reconstruction using SAFIRE is finding greater clini- cal use either to increase image quality at a constant dose or to maintain image quality at a lower dose17, 18.
In our study, the overall image quality was worse-rated in the 80 kV data set compared to the 120 kV images despite the fact that lowering the tube voltage and using SAFIRE maintained a comparable image noise (I3) or led to an even reduced image noise (I5). This could be referred to the cause that iterative reconstruction algorithms lead to an unfamiliar image appearance, in our case to a “smoothed” impression of the liver artery. Earlier studies pointed out the subjectively poorer graded image quality using iterative image reconstruction methods in spite of the lowered image noise19. An increasing implementation of the iterative reconstruction algorithms in the clinical routine should effect a growing familiarization as well as no losses in diagnostic assessability which should be evaluated in future studies.
A study by Schindera et al.10 demonstrated on the basis of a phantom with hypovascularized liver lesions that lowering of the tube voltage to 100 kV combined with iterative image reconstruction results in a reduction in image noise with an improved contrast-to-nose ratio. When using a low tube voltage protocol with iterative reconstruction, the sensitivity with respect to the detection of lesions on the phantom was comparable to that of the standard protocol with FBP.
A significant improvement in contrast due to lowering of the tube voltage was also able to be achieved in our study as shown by the significant increase in the contrast-to-noise ratio of the aorta in the iterative reconstruc- tions at 80 kV.
The clear contrast enhancement achieved by lowering the tube voltage seems to be a promising approach par- ticularly in the diagnosis of hypervascularized tumors such as HCC. This seems to be of enormous importance especially in patients with liver cirrhosis where inhomogeneous liver texture and multiple dysplastic nodules often aggravate diagnostic analysis in all imaging modalities.
120 kV FBP 80 kV I3 80 kV I5 Image noise (SDFat tissue)
Mean value 15.2 16.2 12.6
Standard deviation 4.2 2.8 2.7
p-value 0.17 <0.01
Lesion-to-liver contrast (LLC)
Mean value 34.9 57.1 54.3
Standard deviation 24.0 41.7 41.0
p-value <0.01 <0.01
Lesion contrast-to-noise ratio (CNR)
Mean value 2.48 3.67 4.45
Standard deviation 1.99 2.87 3.53
p-value <0.01 <0.01
Table 3. Objectively determined parameters for evaluating image quality and ability to detect HCC lesions.
The first study examining the effect of the lowering of the tube voltage (from 140 kV to 80 kV) on the detec- tion of hypervascularized liver tumors was published in 2009. Iterative reconstruction algorithms were not yet available at that time and were therefore not used. Despite a significant increase in image noise and a resulting decrease in the subjectively evaluated image quality, lowering of the tube voltage resulted in an increase in the lesion contrast-to-noise ratio and in improved lesion detection20.
In a later study, Marin et al.21 examined the effect of the newly available iterative image reconstruction algorithm ASiR (adaptive statistical iterative reconstruction; GE Healthcare, Milwaukee, USA) in combination with a low tube voltage on the diagnosis of hypervascularized liver tumors (malignant and benign). As in the first study, a signifi- cantly higher lesion contrast-to-noise ratio and improved subjective lesion detection were seen. However, the diag- nostic accuracy and the sensitivity with respect to the detection of lesions could not be improved. At the same time, there was an increase in the number of false-positive results although the difference was not statistically significant.
Both studies include a very heterogeneous patient population. Therefore, not only patients with HCC but also patients with other malignant and benign hypervascularized liver tumors such as metastases of renal cell carcinomas and hemangiomas were included. In contrast, our study was limited to patients with hyperenhancing HCC confirmed by imaging. In addition, our study used the new iterative reconstruction algorithm SAFIRE, which, in contrast to ASiR which has already been available for a while, uses a combination of iterations of raw data (sinogram) and image data22.
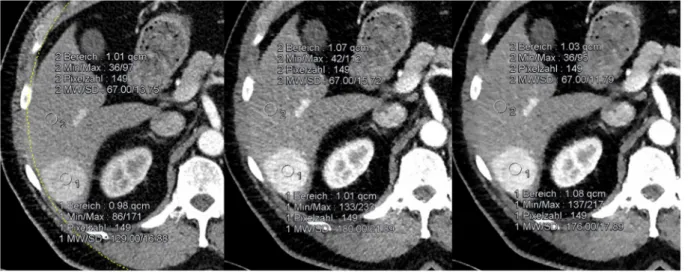
Figure 1. Large HCC in liver segment VI. The lesion contrast-to-noise ratio is significantly higher using SAFIRE than in FBP (4.6 at 120 kV; 7.2 at 80 kV IR3 and 9.2 at 80 kV IR5).
120 kV FBP 80 kV I3 80 kV I5 Confidence max. number of HCC 2.13 1.46 1.46
p-value <0.001 <0.001
Confidence at least one HCC 1.39 1.06 1.11
p-value 0.001 0.004
True positive - number 67 85 82
False positive - number 3 4 4
False negative - number 26 8 11
Sensitivity (%) 72.0% 91.4% 88.2%
p-value <0.01 <0.01
Positive predictive value (%) 95.7% 95.5% 95.3%
Table 4. Key figures regarding the detection of HCC as a function of tube voltage and image reconstruction method.
Sensitivity 120 kV FBP 80 kV I3 80 kV I5 Small lesions (<3 cm) 66.6% 88.9% 84.7%
Large lesions (≥3 cm) 90.4% 100.0% 100.0%
p-value 0.049 0.186 0.100
Table 5. Differences between sensitivity for detection of small and large HCC as a function of tube voltage and image reconstruction method.
The effect of SAFIRE on the detection of HCC in low-voltage computed tomography was examined by Yu et al.23. In contrast to our study, only low-voltage CT scans at a tube voltage of 80 kV were acquired in this study. SAFIRE reconstructions with a half tube current (300 mAs) were compared to FBP reconstructions with a full tube cur- rent (600 mAs). The authors concluded that comparable diagnostic accuracy to that of image reconstruction with FBP at full dose can be achieved with image reconstruction using SAFIRE despite the half dose23.
In the present study, we examined for the first time the effect of a combination of low tube voltage and iterative image reconstruction of the latest generation (SAFIRE) on HCC detection in a homogeneous patient population using a uniform gold standard.
We were able to show that the sensitivity for the detection of HCC was significantly higher with a low tube voltage using SAFIRE at iterative reconstruction settings I3 and I5 than with a high tube voltage using FBP (Fig. 2). The low tube protocol in combination with both iterative reconstruction strengths achieved an excellent sensitivity of 100% in detection of HCC lesions ≥3 cm, which is of high clinical relevance especially regarding potential liver transplantation according to the MILAN-criteria. In addition, the confidence level, i.e. the subjec- tive confidence of the readers regarding the presence of HCC lesions, was significantly higher at a low tube voltage using iterative reconstruction. However, the number of false-positive results was comparable in all examined groups (80 kV IR3, 80 kV IR5 and 120 kV FBP).
The limitations of our study are the low patient number, the lack of histological evidence, albeit with definitive MRI results or in inconclusive cases combined with CEUS, and the unicentric setup.
Despite the limitations, we are convinced that the combination of iterative reconstructions and low tube volt- age is superior to conventional protocols for the detection of HCC. Additional studies with histological examina- tion of all, especially small HCC lesions after liver transplantation or surgical resection should be conducted to prove and emphasize this thesis.
References
1. Forner, A. et al. Diagnosis of hepatic nodules 20 mm or smaller in cirrhosis: Prospective validation of the noninvasive diagnostic criteria for hepatocellular carcinoma. Hepatology 47, 97–104 (2008).
2. Sangiovanni, A. et al. The diagnostic and economic impact of contrast imaging techniques in the diagnosis of small hepatocellular carcinoma in cirrhosis. Gut 59, 638–44 (2010).
3. Khalili, K. et al. Optimization of imaging diagnosis of 1-2 cm hepatocellular carcinoma: an analysis of diagnostic performance and resource utilization. J. Hepatol. 54, 723–8 (2011).
4. Bruix, J. & Sherman, M. Management of hepatocellular carcinoma: an update. Hepatology 53, 1020–2 (2011).
5. Hanna, R. F. et al. Comparative 13-year meta-analysis of the sensitivity and positive predictive value of ultrasound, CT, and MRI for detecting hepatocellular carcinoma. Abdom. Radiol. 41, 71–90 (2016).
6. Huda, W., Scalzetti, E. M. & Levin, G. Technique factors and image quality as functions of patient weight at abdominal CT. Radiology 217, 430–5 (2000).
7. Kalva, S. P., Sahani, D. V., Hahn, P. F. & Saini, S. Using the K-edge to improve contrast conspicuity and to lower radiation dose with a 16-MDCT: a phantom and human study. J. Comput. Assist. Tomogr. 30, 391–7 (2006).
8. Nakayama, Y. et al. Abdominal CT with low tube voltage: preliminary observations about radiation dose, contrast enhancement, image quality, and noise. Radiology 237, 945–51 (2005).
9. Behling, R. In Modern Diagnostic X-Ray Sources: Technology, Manufacturing, Reliability 222 (2016).
10. Schindera, S. T. et al. Iterative reconstruction algorithm for abdominal multidetector CT at different tube voltages: assessment of diagnostic accuracy, image quality, and radiation dose in a phantom study. Radiology 260, 454–462 (2011).
11. Vogl, T. J., Eichler, K., Zangos, S., Mack, M. & Hammerstingl, R. Hepatocellular carcinoma: Role of imaging diagnostics in detection, intervention and follow-up. RöFo Fortschritte auf dem Gebiete der Röntgenstrahlen und der Nukl. 174, 1358–68 (2002).
12. American College of Radiology. Liver Imaging Reporting and Data System version at http://www.acr.org/Quality-Safety/Resources/
LIRADS (2014).
13. Baker, M. E. et al. Contrast-to-noise ratio and low-contrast object resolution on full- and low-dose MDCT: SAFIRE versus filtered back projection in a low-contrast object phantom and in the liver. AJR. Am. J. Roentgenol. 199, 8–18 (2012).
Figure 2. HCC detected on MRI in hepatobiliary phase (c). The arrow shows the HCC. (a) Barely visible at a tube voltage of 120 kV. (b) Effectively visualized at 80 kV with iterative image reconstruction.
14. Schabel, C. et al. Clinical evaluation and potential radiation dose reduction of the novel sinogram-affirmed iterative reconstruction technique (SAFIRE) in abdominal computed tomography angiography. Acad. Radiol. 20, 165–72 (2013).
15. Yang, W. J. et al. Can sinogram-affirmed iterative (SAFIRE) reconstruction improve imaging quality on low-dose lung CT screening compared with traditional filtered back projection (FBP) reconstruction? J. Comput. Assist. Tomogr. 37, 301–5 (2013).
16. Kalra, M. K. et al. Radiation dose reduction with Sinogram Affirmed Iterative Reconstruction technique for abdominal computed tomography. J. Comput. Assist. Tomogr. 36, 339–46 (2012).
17. Gonzalez-Guindalini, F. D. et al. MDCT of chest, abdomen, and pelvis using attenuation-based automated tube voltage selection in combination with iterative reconstruction: an intrapatient study of radiation dose and image quality. AJR. Am. J. Roentgenol. 201, 1075–82 (2013).
18. Vardhanabhuti, V., Loader, R. & Roobottom, C. A. Assessment of image quality on effects of varying tube voltage and automatic tube current modulation with hybrid and pure iterative reconstruction techniques in abdominal/pelvic CT: a phantom study. Invest.
Radiol. 48, 167–74 (2013).
19. Leipsic, J. et al. Adaptive statistical iterative reconstruction: assessment of image noise and image quality in coronary CT angiography. AJR. Am. J. Roentgenol. 195, 649–54 (2010).
20. Marin, D. et al. Hypervascular liver tumors: low tube voltage, high tube current multidetector CT during late hepatic arterial phase for detection–initial clinical experience. Radiology 251, 771–9 (2009).
21. Marin, D. et al. Clinical impact of an adaptive statistical iterative reconstruction algorithm for detection of hypervascular liver tumours using a low tube voltage, high tube current MDCT technique. Eur. Radiol. 23, 3325–3335 (2013).
22. von Falck, C. et al. Influence of sinogram affirmed iterative reconstruction of CT data on image noise characteristics and low- contrast detectability: an objective approach. PLoS One 8, e56875 (2013).
23. Yu, M. H. et al. Low tube voltage intermediate tube current liver MDCT: Sinogram-affirmed iterative reconstruction algorithm for detection of hypervascular hepatocellular carcinoma. Am. J. Roentgenol. 201, 23–32 (2013).
Author Contributions
B.P. and L.P.B. wrote the manuscript. P.W., B.P. and C.N. collected data. C.S. and A.T. performed literature review.
P.W. and H.B. performed the readings of the MRI and CT images. L.P.B. performed the measurements for the objective image analyses. C.N. prepared figures. All authors reviewed the manuscript.
Additional Information
Competing Interests: The authors declare that they have no competing interests.
Publisher's note: Springer Nature remains neutral with regard to jurisdictional claims in published maps and institutional affiliations.
Open Access This article is licensed under a Creative Commons Attribution 4.0 International License, which permits use, sharing, adaptation, distribution and reproduction in any medium or format, as long as you give appropriate credit to the original author(s) and the source, provide a link to the Cre- ative Commons license, and indicate if changes were made. The images or other third party material in this article are included in the article’s Creative Commons license, unless indicated otherwise in a credit line to the material. If material is not included in the article’s Creative Commons license and your intended use is not per- mitted by statutory regulation or exceeds the permitted use, you will need to obtain permission directly from the copyright holder. To view a copy of this license, visit http://creativecommons.org/licenses/by/4.0/.
© The Author(s) 2017