Research Collection
Journal Article
Heat depletion in sedimentary basins and its effect on the design and electric power output of CO2 Plume Geothermal (CPG)
systems
Author(s):
Adams, Benjamin M.; Vogler, Daniel; Kuehn, Thomas H.; Bielicki, Jeffrey M.; Garapati, Nagasree; Saar, Martin O.
Publication Date:
2021-07
Permanent Link:
https://doi.org/10.3929/ethz-b-000471424
Originally published in:
Renewable Energy 172, http://doi.org/10.1016/j.renene.2020.11.145
Rights / License:
Creative Commons Attribution 4.0 International
This page was generated automatically upon download from the ETH Zurich Research Collection. For more information please consult the Terms of use.
ETH Library
Heat depletion in sedimentary basins and its effect on the design and electric power output of CO 2 Plume Geothermal (CPG) systems
Benjamin M. Adams
a,b,*, Daniel Vogler
a, Thomas H. Kuehn
b, Jeffrey M. Bielicki
c,d, Nagasree Garapati
a,e, Martin O. Saar
a,f,**aGeothermal Energy and Geofluids Group, Department of Earth Sciences, ETH Zurich, Sonneggstrasse 5, 8092, Zürich, Switzerland
bDepartment of Mechanical Engineering, University of Minnesota, 111 Church St SE, Minneapolis, MN, 55455, USA
cDepartment of Civil, Environmental, and Geodetic Engineering, The Ohio State University, 2070 Neil Ave, Columbus, OH, 43210, USA
dJohn Glenn College of Public Affairs, The Ohio State University, 1810 College Road, Columbus, OH, 43210, USA
eDepartment of Chemical and Biomedical Engineering, West Virginia University, P.O. Box 6102, Morgantown, WV, 26506, USA
fDepartment of Earth and Environmental Sciences, University of Minnesota, 116 Church St SE, Minneapolis, MN, 55455, USA
a r t i c l e i n f o
Article history:
Received 10 July 2020 Received in revised form 22 November 2020 Accepted 25 November 2020 Available online 2 December 2020
Keywords:
CO₂geothermal Geothermal electricity CCUS
Reservoir heat depletion Sedimentary basin geothermal
a b s t r a c t
CO2Plume Geothermal (CPG) energy systems circulate geologically stored CO2to extract geothermal heat from naturally permeable sedimentary basins. CPG systems can generate more electricity than brine systems in geologic reservoirs with moderate temperature and permeability. Here, we numerically simulate the temperature depletion of a sedimentary basin andfind the corresponding CPG electricity generation variation over time. We find that for a given reservoir depth, temperature, thickness, permeability, and well configuration, an optimal well spacing provides the largest average electric generation over the reservoir lifetime. If wells are spaced closer than optimal, higher peak electricity is generated, but the reservoir heat depletes more quickly. If wells are spaced greater than optimal, res- ervoirs maintain heat longer but have higher resistance to flow and thus lower peak electricity is generated. Additionally, spacing the wells 10% greater than optimal affects electricity generation less than spacing wells 10% closer than optimal. Our simulations also show that for a 300 m thick reservoir, a 707 m well spacing provides consistent electricity over 50 years, whereas a 300 m well spacing yields large heat and electricity reductions over time. Finally, increasing injection or production well pipe di- ameters does not necessarily increase average electric generation.
©2020 The Author(s). Published by Elsevier Ltd. This is an open access article under the CC BY license (http://creativecommons.org/licenses/by/4.0/).
1. Introduction
Global carbon dioxide (CO
2) emissions must be reduced by at least 78%
e118% (when compared to 2010 emission levels) by 2100 in order to keep Earth
’s mean annual surface temperature increase within 2
C of pre-industrial levels and thus avoid substantial negative environmental and economic consequences [1]. Several strategies have been identi
fied to meet the CO
2emissions reduction goal, and most include CO
2capture and geologic storage (CCS) [2,3].
Additionally, CO
2from electricity generation accounted for 40% of
global fuel-combustion CO
2emissions in 2017 [4]. Thus, it is likely that most fossil electricity generation will require CO
2capture and geologic storage in saline and depleted oil and gas reservoirs to meet climate goals [5,6].
Instead of only storing CO
2in sedimentary basins as a part of CCS, the emplaced CO
2can be circulated back to the land surface and used to generate geothermal power in a CO
2Plume Geothermal (CPG) system [7e15]. Importantly, during CPG power generation, all of the CO
2produced from the CO
2storage reservoir is reinjected into the same reservoir, so that 100% of the originally injected CO
2is permanently stored underground in this CO
2capture, utilization, and storage (CCUS) system. The use of CO
2has many advantages over brine, such as a self-convecting thermosiphon and reduced frictional losses through the reservoir due to the decreased CO
2viscosity [7,16]. This low CO
2viscosity enables electric power gen- eration from reservoirs of lower temperature and permeability than those required for traditional brine-based systems [8].
*Corresponding author. Geothermal Energy and Geofluids Group, Department of Earth Sciences, ETH Zurich, Sonneggstrasse 5, 8092, Zürich, Switzerland.
**Corresponding author. Geothermal Energy and Geofluids Group, Department of Earth Sciences, ETH Zurich, Sonneggstrasse 5, 8092, Zürich, Switzerland.
E-mail addresses: adam0068@umn.edu (B.M. Adams), saarm@ethz.ch (M.O. Saar).
Contents lists available atScienceDirect
Renewable Energy
j o u r n a l h o m e p a g e :w w w . e l s e v i e r . c o m / l o c a t e / r e n e n e
https://doi.org/10.1016/j.renene.2020.11.145
0960-1481/©2020 The Author(s). Published by Elsevier Ltd. This is an open access article under the CC BY license (http://creativecommons.org/licenses/by/4.0/).
Renewable Energy 172 (2021) 1393e1403
Additionally, CO
2-based geothermal power generation can leverage the
fluid compressibility to provide grid-scale electricity storage [17e22]. Thus, CPG systems have increased
flexibility and applica- bility over traditional brine-based geothermal systems.
Massive amounts of thermal energy are available in the Earth
’s crust; however technological developments are needed to economically utilize this energy [23]. CPG can increase this geothermal energy utilization as CCS operations increase. Global CO
2emissions exceeded 35 Gt per year in 2011 and have been rising since [1,24]. In a moderately deep (2.5 km) reservoir of moderate temperature (~100
C) and permeability (5 10
14m
2), 3 MW
ecan be repeatedly generated by CPG from 8 Mt of permanently sequestered CO
2[8,11]. Therefore, assuming only 10% of the global annual CO
₂emissions, currently ~35 Gt, were sequestered at com- parable CPG sites, approximately 1.3 GW
eof carbon-free, baseload, and dispatchable renewable electricity could be brought online each year from geothermal resources that are unobtainable by other geothermal energy technologies [25]. This would increase the current ~14 GW
eof installed geothermal power capacity [26,27] by 9% per year.
While research into brine-based geothermal systems is rela- tively extensive, CO
2was only recently proposed as a subsurface working
fluid [28,29]. Initially, CO
2was considered only for Enhanced Geothermal Systems (EGS) [30
e32], where virtuallyimpermeable crystalline rock is hydraulically stimulated (fractured or sheared) to create
flow paths for the injected CO
2[16,33e37].
However, the nature of the fractured EGS reservoir limits its spatial extent and raises concerns such as induced seismicity [38
e40].Unlike EGS, CO
2Plume Geothermal (CPG) utilizes sedimentary rock reservoirs, overlain by an impervious caprock. Sedimentary reservoirs have several advantages over fracture-based formations.
Sedimentary reservoirs are naturally porous and permeable and are found under approximately half of the United States [41e43] and are ubiquitous worldwide [44
e46]. Furthermore, the non-fracture-based
flow
fields that typically develop in naturally permeable sedimentary-basin reservoirs provide large speci
fic surface areas in contact with the
flowing CO
2, enabling effective heat transfer from the rock to the
fluid. Lastly, saline and depleted oil and gas reser- voirs in sedimentary basins are already targeted for geologic CO
2storage [6].
Unlike traditional fracture-based systems, the heat recharge of sedimentary and EGS reservoirs is often conduction-based, rather than advection-based. As heat conduction tends to have substan- tially lower heat
flux rates, the temperature decline of sedimentary reservoirs will be more sensitive to the heat extracted. Thus, care must be taken to select well locations and
flow rates to size reservoir heat extraction sustainably.
For CO
2, thermal depletion of sedimentary basins has seldom been simulated. When heat depletion was considered, simulations included only
fixed and arbitrary heat extraction rates [11,13,47,48].
As the mass
flowrate of a CPG system (or any geothermal power plant) is not
fixed a priori, but rather continually adjusted to generate the maximum power [8], only a simulator with combined reservoir, well, and surface power plant models can accurately predict the time-dependent power generation due to the associ- ated reservoir heat depletion.
Ref. [34] account for thermal depletion in water-EGS reservoirs, employing a
fixed-percentage thermal drawdown model. This is expanded in Ref. [35] by adding additional thermal drawdown models, including TOUGH2 coupling. Similarly, GETEM includes a percentage-based thermal drawdown of conventional and EGS reservoirs [49]. Despite its importance, no prior studies have simulated a complete reservoir-plant direct CO
2-based geothermal system with its varying optimum mass
flowrates and heat deple- tion, as is done here. This has many implications, including equipment sizing, well pipe sizing, and well spacing which directly affect the cost and
financial performance of a geothermal installation.
In this paper, we determine the time-dependent power gener- ation of a direct CPG power system as the production temperature of the sedimentary basin decreases. Our earlier work [7,8] consid- ered the power output only during the
first year of operation. In addition, we calculate the effect on electricity generation by vari- ations in reservoir thickness, permeability, well pipe diameter, and well spacing.
2. Methods
The reservoir is modeled as a truncated cylinder with a caprock above.
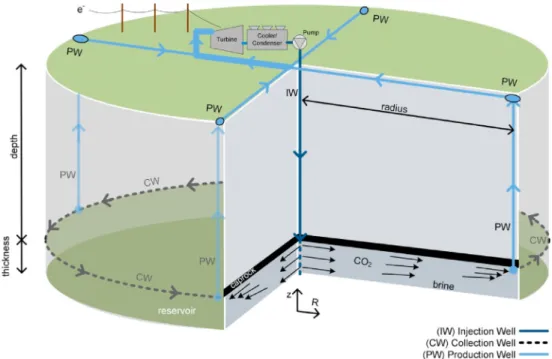
Fig. 1shows the radially symmetric reservoir used herein, similar to the con
figuration used by Ref. [11,48,50,51]. The cylin- drical reservoir has a single, vertical injection well (IW) located at the center, and a continuous, horizontal circular collection well (CW) at the perimeter, directly beneath the caprock. The CO
2is produced to the surface through four equally spaced vertical pro- duction wells (PW) which drain the collection wells. Once at the surface, the CO
2is directly expanded through a turbine, is condensed, and then reinjected through the central injection well back into the formation.
In practice, a circular reservoir with a continuous collection well around the perimeter may not be used. CO
2plumes tend to migrate in a preferred direction (e.g. up-dip of even slightly inclined cap- rocks, or along a path of higher permeability). Thus, fewer, well- placed, linear horizontal or even vertical CO
2collection and pro- duction wells could enable circulation of most of the CO
₂. However, this radially-symmetric model was chosen here as it provides computational simplicity while still allowing for simulation of the thermal depletion of a reservoir volume with buoyancy effects.
Our CPG system simulations employ two software packages:
TOUGH2 [53], for subsurface simulations, and Engineering Equa- tion Solver (EES) [54], a simultaneous equation solver with built-in thermophysical property data, for the surface plant and well piping.
Ref. [51] employed a fully-coupled TOUGH2-EES reservoir and po- wer plant simulator; however, the simulations were time-intensive
NomenclatureD
Well Diameter [m]
m_
Mass Flowrate [kg s
1] P Power [MW
e]
P
netNet Power Generated at any Time, t. [MW
e] P
net,avgAverage Net Power Generated (30 or 50 Years)
[MW
e]
Q Heat Energy Transfer Rate [MW
th] R Reservoir Radius [m]
R
optOptimal Well Radius for Maximum Average Net Power Generation [m]
t Time [s]
T Fluid Temperature Produced from Reservoir [
C]
T
injFluid Temperature Injected into Reservoir [
C]
Z Elevation [m]
G Temperature Fraction [
C/
C]
d Reservoir Thickness [m]
k Reservoir Permeability [m
2]
m
0Average Reservoir Dynamic Fluid Viscosity [N s m
2]
r
0Average Reservoir Fluid Density [kg m
3]
as repeated TOUGH2 simulations with slightly different mass
flowrates were required. Additionally, Ref. [51] did not consider the thermal depletion of a reservoir, which would have made simula- tion time even longer.
To reduce computational time in this study, the TOUGH2 simulator results are characterized by the relevant system param- eters (i.e. depth, temperature gradient, permeability, radius, and CO
2injection
fluid state) into a set of dimensionless curves, which are then integrated into the EES simulator. Thus, we consider the subsurface, wells, and power plant as a single system.
The time-dependent power generation of the CPG system is found for various combinations of the parameters listed in
Table 1.The
‘Varied
’reservoir conditions are the parameters which are modi
fied in the results section of this paper. The
‘Not Varied
’reservoir conditions are the values used in all TOUGH2 reservoir simulations. The reservoir properties are chosen to be consistent with our previous work and models [11,51]. All power plant pa- rameters are identical to Ref. [8]. The well pipe diameters are derived from GETEM [55]. The reservoir parameters were originally chosen to be representative of typical sedimentary basins available for deep geothermal and their associated surface power plants.
Section 2.1 characterizes the TOUGH2 simulator for integration
into the EES simulator. Section 2.2 describes the EES simulator, which calculates power generation, using the characterization of Section 2.1. shows our nomenclature.
2.1. Reservoir modeling and characterization
The reservoir is considered to be homogeneous, horizontal, and radially symmetric; initially at uniform temperature and pressure.
The reservoir is modeled using TOUGH2 [53] with the ECO2N and ECO2H equation of state modules [53,56,57]. The reservoir pa- rameters are described in
Table 1.The initial temperature of the reservoir is the product of the geothermal temperature gradient and reservoir depth plus the average ambient air temperature (15
C). A 15
C average air tem- perature is a cautious assumption, representative of Dallas, TX, U.S [8]. The initial pressure is the hydrostatic elevation potential of pure water at the given depth. The injection well is vertical and centrally located (R
¼0). The grid spacing in the reservoir increases with radial distance, up to the radial extent of the reservoir (100 km) to account for brine displacement, thermal expansion, and over- pressurization, which occur from CO
2injection [11,48,50]. The horizontal and circular collection well (CW) is located directly beneath the impermeable caprock, at a radial distance, R, from the vertical injection well. The radially-symmetric nature of the reser- voir model assumes a uniform pressure in the horizontal collection wells. This is justi
fiable as the
flowrates in the horizontal wells are at most half of the production well
flowrate and at least, zero
flowrate. Similarly, it was found that a single vertical production well substantially limits power generation due to high frictional losses. Thus, four vertical production wells, operating in parallel, are considered (see CW and PW in
Fig. 1).The reservoir initially contains 20 wt% NaCl-brine. Then, pure CO
2is injected,
first without
fluid production, partially displacing the brine over approximately 2 years. Fluid production commences once a minimum CO
2mass-fraction of 94% is achieved into the production well [58], which is consistent with previous publica- tions [11]. However, recent discussions with turbine manufacturers
Fig. 1.Schematic of a CPG System with one central CO2injection well (IW) and four production wells (PW), draining an idealized horizontal, circularfluid collection well (CW) (modified from Ref. [52]. None of the injected and circulated CO2is released to the atmosphere.Table 1 Parameters used.
Well Pipe Diameter 0.14 m, 0.27 m, 0.33 m, and/or 0.41 m Reservoir Parameters: Varied
Depth 1.5 km, 2.5 km, 3.5 km, or 5.0 km
Thickness 50 m or 300 m
Radius 300 m or 707 m
Geothermal Gradient 20C km1, 35C km1, or 50C km1
Permeability 11012m2to 11015m2
Reservoir Parameters: Not Varied
Rock Density 2300 kg m3
Rock Specific Heat 0.92 kJ kg1C1
Rock Thermal Conductivity 2.1 W m1C1
Porosity 0.10
Reservoir Fluid CO2injected into 20 wt% NaCl-brine CO2Injected Initially 2 to 10 Mt CO2(See Ref. [11])
B.M. Adams, D. Vogler, T.H. Kuehn et al. Renewable Energy 172 (2021) 1393e1403
indicate that much lower CO
2mass fractions are permissible within the turbine without damaging it.
The injection temperature of CO
2back into the reservoir, T
inj, is determined by isentropically compressing saturated liquid CO
₂to the hydrostatic pressure at reservoir depth. The saturated liquid CO
₂is at ambient temperature plus a 7
C approach temperature as it leaves the condensing tower (i.e. 22
C). Thus, the reservoir injec- tion temperatures are 35, 46, 58, and 65
C for depths of 1.5, 2.5, 3.5, and 5.0 km, respectively.
The reservoir produced
fluid temperature is simulated for CO
2injection mass
flowrates of 3 (95.1), 4 (126.8), 5 (158.5), and 6 Mt yr
1(190.2 kg s
1), initially ramping linearly from zero to the speci
fied mass
flowrate over the
first two years, and continuing for a minimum of 50 years. To increase the TOUGH2 simulation reli- ability, an increased number of parameters are used: reservoir thicknesses of 50, 100, 200, and 300 m, injection-to-production well radii of 300, 500, 707, 1000, 1200, 1500, 2000, and 2500 m, at reservoir depths of 1.5, 2.5, 3.5, and 5.0 km, and geologic thermal gradients of 35 and 50
C km
1, although not all combinations are simulated. The temperature decay is non-dimensionalized into the temperature fraction, G , where T(t) is the downhole production well temperature at time t (Equation
(1)).G ðtÞ ¼ TðtÞ T
injTð0Þ T
inj(1)
A permeability of 5 10
14m
2is used for all simulations as previous work has shown that reservoir impedances can be reliably adjusted from a base case for any permeability by applying Darcy
’s Law [8]. The reservoir impedance (i.e.
‘reservoir factor, R
’in Ref. [8] is the
fluid pressure difference between reservoir
fluid injection and production pressures divided by the
fluid mass
flowrate. The reser- voir
fluid pressures are non-dimensionally scaled using a correction factor from the analytical Darcy reservoir impedance solution, given in Equation
(2). Ref. [52] provides this correction factor to obtain thetwo-phase, time-dependent value, which is used herein.
P
idealm
’¼ m
’r
’1
2 pkd ln
2R
D
(2)
The resulting 330 TOUGH2 reservoir simulation datasets are analyzed to construct response curves for the investigated system.
This enables estimation of reservoir impedance and thermal decay in the reservoir for a given set of input parameters at a given time step without the need to run further simulations. Speci
fically, the temperature decay pro
file of a sedimentary reservoir is approxi- mated using a two-variable error function and exponential com- bination curve across the parameter space. On average, the combined error function and exponential curve
fit the 330 indi- vidual datasets well (r
2 ¼0.989). The derivation of the response curves for reservoir impedance and thermal decay is detailed in Ref. [52]. The derived response curves are used in the following section of this work to compute the produced heat
flux and electric power generation with time.
2.2. Surface power plant modeling
The surface power plant converts the geothermal heat to electric power. The plant includes production and injection well piping, a direct-CO
2turbine, cooler, condenser, and a surface injection pump, as shown in
Fig. 2. The surface power plant is identical to that usedpreviously [8]. Engineering Equation Solver (EES) is used to solve for CO
2fluid properties, based on Ref. [59].
Saturated liquid CO
2at a temperature equal to ambient plus a 7
C approach temperature (22
C) leaves the surface condenser
(State 7). The CO
2is either throttled or pumped to the requisite pressure at State 1, which will maintain the pressure of State 3 at hydrostatic. The CO
₂is injected at the surface into the injection well, where it self-compresses into supercritical CO
2before entering the reservoir at State 2. The CO
2flows through the reservoir, increasing in temperature and decreasing in pressure to State 3, where the pressure is hydrostatic. The pressure change within the reservoir is the product of the reservoir impedance and
fluid mass
flowrate.
The CO
2then
flows isobarically through the horizontal circular collection well and with decreasing pressure up the production wells to the surface (State 4). Wellbore heat loss is low at high
flowrates and thus neglected [60,61]. At the surface, the CO
2ex- pands through a turbine with an isentropic ef
ficiency of 78% to State 5. It is isobarically de-superheated in a cooler to State 6, and then isobarically condensed to State 7 at a pressure equivalent to the saturation pressure of CO
2at 22
C.
Pure CO
2is assumed within the wellbores and equipment;
however, the power generation would be larger if water-saturated CO
2from the reservoir entered the production well [10]. The effect of multicomponent
fluid (CO
2and water)
flow on power generation and liquid loading potentials in CPG production wells are investi- gated in Ref. [58].
For every combination of well pipe diameter, injection-to- production well radius, reservoir permeability, and reservoir thickness, the net power is found in 5-year increments from Years 0e50. At each time step, the reservoir produced
fluid temperature and pressure differential are recalculated using the
fits described in Section 2.1 (see also [8]). At each time step, the CPG system is operated at the mass
flowrate that provides the largest net power (see Figure 4 in Ref. [8]). Turbine power generated, net power, and parasitic loads are calculated identically to Ref. [8].
3. Results and discussion
The net power generated is found for each of the parameter
combinations (Table 1).
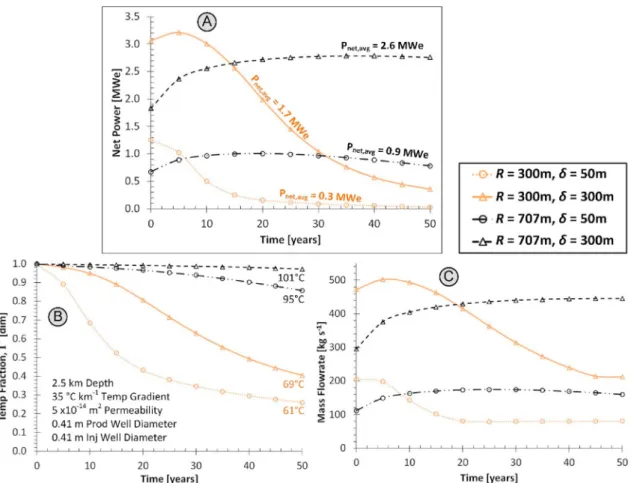
Fig. 3shows the time-series of A) net po-
wer, B) temperature fraction, and C) mass
flowrate for a 2.5 km
deep, 35
C km
1temperature gradient, and 5 10
14m
2reservoir
permeability with 0.41 m pipe diameter injection and production
Fig. 2.Direct CPG system schematic (modified from Ref. [8]. The CPG system mass flowrate is optimized to generate the most power for the specific reservoir charac- teristics. This involves either throttling or pumping the system as the downhole in- jection well pressure requires.wells.
Fig. 3A shows that increasing the reservoir thickness,
d , always increases the maximum net power generation. This is due to the inverse relationship between reservoir thickness and
fluid pressure differential in the Darcy equation (Equation
(2)): increasing thereservoir thickness decreases the reservoir impedance and thus increases the
fluid mass
flowrate and net power. In the same way, decreasing the reservoir radius decreases the reservoir impedance, though this effect is small at large radii. However, a decrease in reservoir impedance, while increasing mass
flowrate and
Fig. 3. The A) net electric power, B) temperature fraction,G, and C) massflowrate versus time for two reservoir radii,R, between the vertical injection and the horizontal collection well, and two reservoir thicknesses,d. These values are shown for a 2.5 km deep reservoir with a 35C km1temperature gradient (plus 15C average ambient air temperature), 51014m2permeability, and 0.41 m pipe diameter injection, collection, and production wells.Fig. 3B shows the equivalent reservoir production temperature after 50 years.Fig. 4. The average net electric power over 50 years as a function of reservoir radius,R, between the vertical injection well and the horizontal, circular collection well, for four reservoir thicknesses at a permeability of A) 51015m2and B) 51014m2. The reservoirs are identical otherwise, with a 2.5 km depth, 35C km1temperature gradient plus 15C ambient air temperature, and 0.41 m well pipe diameters. The red line indicates the trend of optimum radii,Ropt, across reservoir thicknesses,d. The slopes of the power curves, approximated as linear on either side of the maximum, are provided for reservoir thicknesses of 50 and 300 m. The power slopes are given in units of percentage change per 100 m radius change, where the percentage change is the power slope divided by the maximum average power value for that reservoir thickness and permeability. (For inter- pretation of the references to color in thisfigure legend, the reader is referred to the Web version of this article.)
B.M. Adams, D. Vogler, T.H. Kuehn et al. Renewable Energy 172 (2021) 1393e1403
instantaneous net power, also decreases the time to thermal breakthrough at the production well. Thus, while the 300 m radius reservoirs in
Fig. 3A have a larger maximum power than the 707 mreservoirs, they have lower average power values. Therefore, for any given reservoir impedance, there will be a radius, R
opt, which provides the maximum average net power over a given time period, explained further in Section 3.1.
For each reservoir con
figuration, the maximum mass
flowrate (Fig. 3C) occurs at non-zero time. This maximum is caused by the interactions between reservoir impedance and production tem- perature. As the reservoir
“dries out
”with time (larger fractions of the pore space are occupied by CO
2and fewer by brine), its impedance decreases, and the
fluid pressure differential created by the thermosiphon induces a greater mass
flowrate, all else staying constant. In contrast, the reservoir downhole production temper- ature (Fig. 3B) decreases with time, which decreases the density differential between injection and production wells, and would decrease thermosiphon-induced mass
flowrate, all else remaining constant [7]. Thus, for systems with rapid thermal drawdown (e.g.
for a shorter 300 m radius), the decreasing reservoir impedance is quickly counter-acted by the decreasing production temperature, yielding earlier maximum mass
flowrates. Similarly, systems with greater reservoir radii have larger thermal masses, so that pro- duction temperatures decrease more slowly and mass
flowrates peak later.
Lastly,
Fig. 3shows that at large thermal depletion (i.e. small temperature fraction), the optimal mass
flowrate reaches a hori- zontal asymptote. This asymptote is the thermosiphon-driven mass
flowrate that results without pumping. When the production temperature becomes suf
ficiently low, it no longer generates more electricity to augment the system mass
flowrate with pumping.
However, there is also no bene
fit to throttling the system to lower mass
flowrates. Thus, a steady mass
flowrate is obtained.
3.1. Optimal radius, R
opt, for given reservoir thickness
For any given reservoir thickness, the optimal radius, R
opt, be- tween the vertical injection well and the horizontal, circular collection well, is the radius which will produce the greatest average net power over the lifetime of the reservoir. To more clearly de
fine this optimum radius, additional simulations are run for 50 years of operation for a reservoir depth of 2.5 km, a geothermal temperature gradient of 35
C km
1plus 15
C ambient air tem- perature, permeabilities of 5 10
15and 5 10
14m
2, thicknesses, d , of 50, 100, 200, and 300 m, and radii between 200 and 1000 m.
The results are shown in
Fig. 4.In all cases, for a given reservoir radius, increasing the reservoir thickness yields increased power. For each of the thicknesses shown in
Fig. 4, a maximum average net power is obtained withinthe radius range of 200
e1000 m. Described previously, the opti- mum radius occurs due to the interaction between the differential pressure and thermal mass, which affect the average net power generation in opposing ways. For a permeability of 5 10
14m
2(Fig. 4B), the optimum radii are near 550 and 750 m for reservoir thicknesses of 300 and 50 m, respectively.
The red line in
Fig. 4shows the trend of maximum power across reservoir thicknesses. It has a negative slope, indicating a decreased optimum reservoir radius for increasing reservoir thicknesses. The optimum radius is larger for thinner reservoirs to counter the reduction in thermal mass that occurs through decreasing reservoir volume. For a permeability of 5 10
15m
2(Fig. 4A), the red line is nearly vertical, with an optimal radius of ~300 m for all investigated reservoir thicknesses. For low permeabilities, the mass
flowrate is very sensitive to radius so that the penalty incurred for under- sizing or over-sizing the reservoir radius is much larger than for
higher permeabilities.
For a given reservoir thickness, the approximate linearized slopes of the power curves (gray power curves) in
Fig. 4indicate the energy penalty for an incorrect radius choice. The linearized slope is the change in power generation for a 100 m radius change divided by the maximum power generated (% per 100 m) for that reservoir thickness. For example, for a 5 10
15m
2permeability reservoir (Fig. 4A) with a thickness of 300 m, 6% of the maximum power is lost for every 100 m of over-sizing. Thus, placing a pro- duction well at 600 m instead of 300 m will decrease power by approximately 18% of peak power (90 kW
e).
The magnitude of the power slope tends to be larger for un- dersized radii than oversized radii. Thus, an oversized reservoir radius impacts the average power generation less over the lifetime of the system than selecting a radius that is too small. Additionally, as reservoir permeabilities increase (from
Fig. 4A and B), the powerslopes decrease, indicating that the selection of a correctly sized production well radius is more important for low reservoir permeabilities.
The optimum reservoir radius, R
opt, will vary depending on the time period over which the maximum average power is sought. For decreased time periods (e.g. 30 instead of 50 years), the thermal energy required to be extracted decreases, decreasing the required reservoir radius. Thus, for decreasing CPG lifetimes of interest, the optimum radius decreases, causing the average power generation to increase.
3.2. Average net power variability across the parameter space
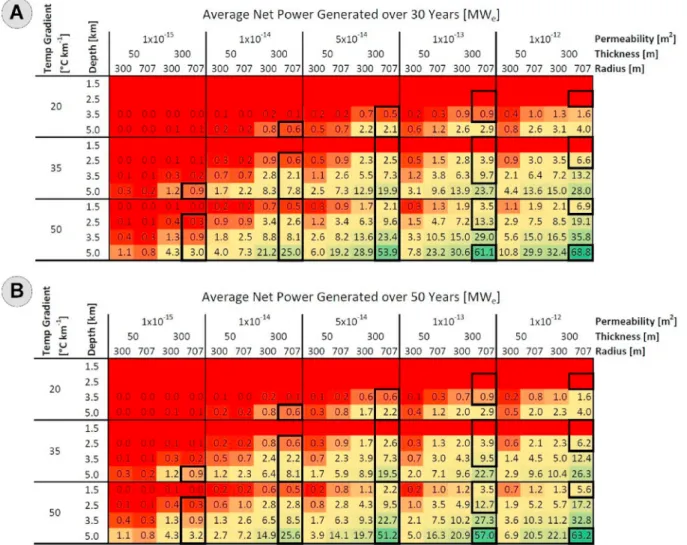
The average net electric power generation values are found for each parameter (Table 1) and a subset are displayed in
Fig. 5with
fixed injection and production well pipe diameters of 0.41 m. The values are colored to indicate low (red), intermediate (yellow), and high (green) values of net power generation. As power output was previously found to be negligible for reservoir depths less than 3.5 km at a temperature gradient of 20
C km
1and less than 2.5 km at a temperature gradient of 35
C km
1[62], those values are not simulated and are represented as blank cells. For compar- ison, the parameter combinations that yield larger CPG power generation values than using brine in Ref. [8] (see their Figure 7) are bordered by a dark black line. This is shown only for the combi- nations with 300 m thickness reservoirs and 707 m reservoir radii, which most closely align with that study.
Consistent with previous
findings, the average power increases with increases in reservoir depth and permeability as well as temperature gradient. For
fixed values of reservoir depth, perme- ability, reservoir radius, and temperature gradient, increasing the reservoir thickness results in an increase in power generated.
These results may be compared to those of the pure-CO
2inverted 5-spot reservoir of Ref. [8] using the 300 m thickness and 707 m radius reservoir values. For injection and production well pipe diameters of 0.41 m, a reservoir permeability of 5 10
14m
2, temperature gradient of 35
C km
1, and depth of 2.5 km, Ref. [8] in their Figure 6A reported a net power of 3.6 MW
e, which can be compared to 2.6 MW
ehere. The difference ( 32%) can be attributed to the higher reservoir impedance of the more realistic multi-phase reservoir considered here, which is initially
filled with brine. Also, the power shown here can be improved upon; it increases slightly from 2.6 MW
eto 2.7 MW
e(or
þ4%) by decreasing the collection well radius from 707 to 600 m (Fig. 4B).
As previously discussed, power does not necessarily increase with reservoir radius, although this tends to occur for the two radii (300 and 707 m) shown in
Fig. 5, especially at high permeabilities.For permeabilities of 5 10
14m
2and larger, a radius of 707 m
results in more average power than using a 300 m radius; however,
Fig. 5.The average net electric power generated over thefirst A) 30 years and B) 50 years for selected values of reservoir permeability, thickness, radius, depth, and temperature gradient with afixed well pipe diameter of 0.41 m. Permeability, depth, and temperature gradient combinations are outlined in bold which were previously shown to yield higher power generation rates than brine-based geothermal systems (see Ref. [8]).
Fig. 6.The percent change in average net electric power generated when a 30-year average is used instead of a 50-year average. Positive changes are indicated by green while negative changes are shown in red. Large positive changes (green) between 50- and 30-year averages indicate a substantially heat-depleted reservoir at the 30-year mark, while negative changes (red) indicate thermal breakthrough has not yet occurred and, in fact, that power generation is still increasing due to continued reductions in reservoir impedance.
(For interpretation of the references to color in thisfigure legend, the reader is referred to the Web version of this article.)
B.M. Adams, D. Vogler, T.H. Kuehn et al. Renewable Energy 172 (2021) 1393e1403
at low permeabilities, especially those at shallow depths and low temperatures, the power output with a radius of 707 m can be lower than that at 300 m.
To determine if the reservoirs examined were sized correctly, the change in power generated between 30-year and 50-year averaging windows is found. The percent change in power, P
net;avg, is the difference between the average net power generated over 30 years, P
net;avg;30y, and 50 years, P
net;avg;50y, divided by the average net power generated over 30 years, given in Equation
(3).D P
net;avg¼ P
net;avg;30yP
net;avg;50yP
net;avg;30y100% (3)
The results are shown in
Fig. 6, where large, positive percentagechanges (green) indicate an undersized reservoir radius, R, with too little reservoir thermal mass, causing thermal breakthrough at the production well between Years 30 and 50. The thermal break- through results in the reservoir operating at a fraction of its peak power generation toward the end of its 50-year lifetime, causing a decrease in average power generated. In the cases with large pos- itive values (e.g. most 300 m radius cases), the production wells should be placed at a larger radius from the injection well, R, to increase the thermal mass through which the heat extraction
fluid
flows.
In contrast, negative changes in power (red) indicate that the net power is continuing to rise beyond 30 years. In these cases, thermal breakthrough has not yet occurred, and continued de- creases in the reservoir impedance with time, due to larger CO
2saturations of the pore space, cause increased mass
flowrate and net power output (e.g. the 707 m radius and 300 m thickness reservoir in
Fig. 3). Thus, reservoir thicknesses and CPG well com-binations shown in
Fig. 6with single-digit change magnitudes are sized appropriately to provide consistent power for a 50 year duration.
From
Fig. 6, we can infer that a 300 m thickness reservoir with a707 m radius well spacing will not substantially deplete in heat for any of the reservoir combinations shown over a 50-year lifetime;
however, improved performance may be found at smaller radii, as previously discussed. Also, at low permeabilities, such as 10
14m
2, a reservoir with a 707 m radius well spacing does not deplete in heat for either a 50 m or 300 m thickness, while none of the reservoir thicknesses and radii considered deplete in heat over 50 years in a 10
15m
2permeability reservoir.
3.3. Average net power sensitivity to well pipe diameter
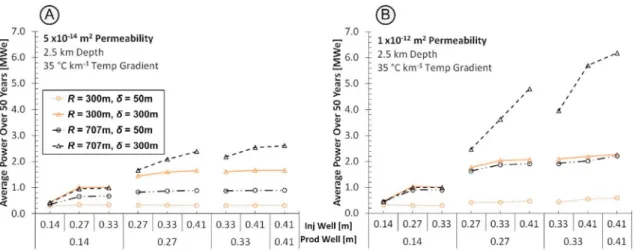
The effect of well pipe diameter on average net power is shown in
Fig. 7for both a 5 10
14m
2and 1 10
12m
2permeability reservoir at a depth of 2.5 km, a 35
C km
1geologic temperature gradient, and a range of well pipe diameters. Well pipe diameter and reservoir permeability govern the system pressure losses, which dictate the mass
flowrate that will generate the most power.
When increasing injection and production well pipe diameter, the average electric net power tends to increase. Likewise, increases in reservoir permeability tend to increase the power generated;
however, this effect is diminished at small pipe diameters. At large reservoir permeabilities (Fig. 7B), the fraction of frictional pressure losses from the reservoir tends to be low; therefore, net power output is substantially increased by increasing well pipe diameter.
Conversely, at low reservoir permeabilities (Fig. 7A) the fraction of frictional pressure losses from the reservoir is large, so the net power output is less sensitive to the pipe diameter.
For each combination of reservoir radius, R, and reservoir thickness, d , there appears to be a combination of injection and production well pipe diameters, where a plateau in net power generation is achieved. The exception to this trend is the 707 m reservoir radius and 300 m reservoir thickness case in
Fig. 7B,where power increases for all increases in pipe diameter. These results notably differ from those previously found (see Figure 10A in Ref. [8], which indicated that power increased for all increases in pipe diameter. Ref. [8] did not consider the temperature depletion that occurs with time and its effect on power generation.
Fig. 7
shows that for all but the largest reservoir (i.e. reservoir radius of 707 m and thickness of 300 m), the average power does not increase appreciably for injection and production well pipe diameters greater than 0.27 m. This is caused by the rapid thermal depletion of the reservoir that larger pipe diameters enable. While the average power generation for different well pipe diameter combinations is roughly equivalent, larger pipe diameters provide variability in power generation with time. Conversely, the 707 m radius and 300 m thickness reservoir does not thermally deplete for large values of pipe diameter, as previously indicated in
Fig. 6. Thus,for a
fixed reservoir volume, the wells need to be sized accordingly to avoid installation of unnecessarily large piping.
Further, the correct sizing of well pipe diameters will decrease
the net power variation with time, decrease the over-sizing of po-
wer plant equipment, increase the capacity factor of that
Fig. 7. The average net electric power generated over 50 years for varying well pipe diameters for A) a 51014m2permeability reservoir and B) a 11012m2permeability reservoir. The reservoirs are 2.5 km deep and have thicknesses,d, of 50 and 300 m. The geologic temperature gradient is 35C km1, while the average ambient air temperature is 15C (resulting in a reservoir temperature of 102.5C). The reservoir radii,R, indicating the distance between the vertical injection well and the horizontal collection well, are 300 and 707 m.equipment, and overall decrease the cost of generating electricity.
This result is consistent with Ref. [58] which similarly shows that the largest well pipe diameters may not be the optimum design choice, but for reasons of wellbore
flooding.
Ultimately, considerations regarding the site-speci
fic reservoir characteristics (permeability, thickness, etc.), the anticipated engineered subsurface features (well and well-
field geometries), and Earth surface conditions (CO
2sources or pipelines, power users or power grid proximity, average air or surface-water temperature for cooling, etc.) all need to be included when implementing CPG power generation and associated permanent geologic CO
2storage.
In practice, a wide range of in-depth simulations of combined reservoir-power-plant processes and their uncertainties (particu- larly regarding the uncertain subsurface parameters, the uncer- tainty of which can be reduced through geological/geophysical exploration) will have to be conducted for each potential CPG site.
Such simulations provide forecasts of CPG system implementations for a site of interest, yielding estimated power output and associ- ated revenue, costs, and mass of permanently stored CO
2for many decades into the future of a potential CPG system
’s operation time.
Nonetheless, we hope that the insights provided here can provide guidance when pre-screening locations for potential CPG system development.
4. Conclusions
In this paper, we use
fluid pressure drop and temperature decay characterizations of sedimentary radial reservoirs from Ref. [52] to
find the time-dependent values of CPG power generation for various well pipe diameters, reservoir radii, thicknesses, and per- meabilities. Our
findings are:
A given reservoir has an optimal reservoir radius, R
opt, that maxi- mizes average power generation over a speci
fied time. The reser- voir radius is determined by the well spacing and placement.
Increasing the reservoir radius increases both the reservoir impedance and the reservoir thermal mass available for heat extraction, as large-radii reservoirs yield lower
flowrates and thus slower heat depletion. Additionally, this optimum radius increases with increasing reservoir permeability.
For 300 m thick reservoirs, the 707 m reservoir radius, R, provides suf
ficient heat to sustain power generation over a 50-year period.
The change in average power generation between 30- and 50- years is almost always less than 10%, indicating consistent po- wer output and low heat depletion. For 50 m thick reservoirs, the change in power generation for this spacing is generally less than 25% for permeabilities of 5 10
14m
2and below.
Over-estimation of the reservoir radius, R, affects the long-term power output less severely than under-estimation. Additionally, power sensitivity to reservoir radius is more pronounced for smaller than for larger permeabilities.
Increasing injection and production well pipe diameter for a
fixed reservoir radius, R, does not necessarily increase average net power generation. While increasing well pipe diameters increases mass
flowrate and therefore net power generation, an increased pipe diameter also increases heat extraction from the reservoir, leading to faster heat depletion. A moderation of the heat extraction rate also decreases the required capacity of the sur- face plant while increasing equipment capacity utilization over time, thus reducing cost of generation.
Larger reservoir thicknesses increase the average power generated.
All else constant, larger reservoir thicknesses increase the
flow- cross-sectional area, decrease the reservoir impedance, and result in higher
flowrates, while the thermal mass of the reservoir is increased.
Data availability
The power generation data for all cases simulated are provided as supplemental data as an EXCEL
file.
CRediT authorship contribution statement
Benjamin M. Adams:
Conceptualization, Methodology, Soft- ware, Data curation, Formal analysis, Writing - original draft.
Daniel Vogler:
Writing - review
&editing.
Thomas H. Kuehn:Conceptualization, Writing - review
&editing, Supervision, Fund- ing acquisition.
Jeffrey M. Bielicki:Conceptualization, Writing - review
&editing, Funding acquisition.
Nagasree Garapati:Data curation, Writing - review
&editing.
Martin O. Saar:Conceptual- ization, Writing - review
&editing, Supervision, Funding acquisition.
Declaration of competing interest
The authors declare that they have no known competing
financial interests or personal relationships that could have appeared to in
fluence the work reported in this paper.
Acknowledgements
The authors gratefully acknowledge funding from a U.S. National Science Foundation (NSF) Sustainable Energy Pathways (SEP) pro- gram grant (1230691). We also thank the Initiative for Renewable Energy (IREE) for initial seed funding. The Werner Siemens Foun- dation (Werner Siemens-Stiftung) is further thanked for its support of the Geothermal Energy and Geo
fluids (GEG.ethz.ch) Group at ETH Zurich. We acknowledge additional funding from: the U.S.
National Science Foundation Innovations at the Nexus of Food, Energy, and Water Systems (INFEWS) program (1739909), the U.S.
National Science Foundation National Research Traineeship Pro- gram (1922666), and the Sloan Foundation. We also thank our two peer reviewers for their thoughtful feedback. Any opinions,
find- ings, conclusions, and/or recommendations expressed in this ma- terial are those of the authors and do not necessarily re
flect the views of the NSF, IREE, UMN, OSU, or ETH.
References
[1] Intergovernmental Panel on Climate Change (IPCC), Climate Change 2014:
Synthesis Report, 2014.http://www.ipcc.ch/report/ar5/syr/.
[2] Intergovernmental Panel on Climate Change (IPCC), IPCC special report on carbon dioxide capture and storage, in: B. Metz, O. Davidson, H.C. de Coninck, M. Loos, L.A. Meyer (Eds.), Prepared by Working Group III of the Intergov- ernmental Panel on Climate Change, Cambridge University Press, 2005.
https://www.ipcc.ch/report/carbon-dioxide-capture-and-storage/.
[3] Intergovernmental Panel on Climate Change (IPCC), Global warming of 1.5C:
an IPCC special report on the impacts of global warming of 1.5C above pre- industrial levels and related global greenhouse gas emission pathways, in:
P. Zhai, H.-O. P€ortner, D. Roberts, J. Skea, P.R. Shukla, A. Pirani, W. Moufouma- Okia, C. Pean, R. Pidcock, S. Connors, J.B.R. Matthews, Y. Chen, X. Zhou, M.I. Gomis, E. Lonnoy, T. Maycock, M. Tignor, T. Waterfield (Eds.), The Context of Strengthening the Global Response to the Threat of Climate Change, Sus- tainable Development, and Efforts to Eradicate Poverty [Masson-Delmotte, 2018.https://www.ipcc.ch/sr15.
[4] International Energy Agency (IEA), CO2 Emissions from Fuel Combustion 2019 Edition. https://www.iea.org/data-and-statistics/?country¼WORLD&
fuel¼CO2þemissions, 2019.
[5] C. Azar, K. Lindgren, E. Larson, K. M€ollersten, Carbon capture and storage from fossil fuels and biomasseCosts and potential role in stabilizing the atmo- sphere, Climatic Change 74 (2006) 47e79.
[6] Global CCS Institute, The Global Status of CCS: 2019dTargeting Climate Change, 2019. http://www.globalccsinstitute.com/resources/global-status- report.
[7] B.M. Adams, T.H. Kuehn, J.M. Bielicki, J.B. Randolph, M.O. Saar, On the importance of the thermosiphon effect in CPG (CO2plume geothermal) power systems, Energy 69 (2014) 409e418, https://doi.org/10.1016/
B.M. Adams, D. Vogler, T.H. Kuehn et al. Renewable Energy 172 (2021) 1393e1403
j.energy.2014.03.032.
[8] B.M. Adams, T.H. Kuehn, J.M. Bielicki, J.B. Randolph, M.O. Saar, A comparison of electric power output of CO2Plume Geothermal (CPG) and brine geothermal systems for varying reservoir conditions, Appl. Energy 140 (2015) 365e377, https://doi.org/10.1016/j.apenergy.2014.11.043.
[9] J. Ezekiel, A. Ebigbo, B.M. Adams, M.O. Saar, Combining natural gas recovery and CO₂-based geothermal energy extraction for electric power generation, Appl. Energy 269 (2020) 115012, https://doi.org/10.1016/
j.apenenergy.2020.115012.
[10] M.R. Fleming, B.M. Adams, T.H. Kuehn, J.M. Bielicki, M.O. Saar, Increased po- wer generation due to exothermic water exsolution in CO2Plume Geothermal (CPG) power plants, Geothermics 88 (2020) 101865,https://doi.org/10.1016/
j.geothermics.2020.101865.
[11] N. Garapati, J.B. Randolph, M.O. Saar, Brine displacement by CO2, energy extraction rates, and lifespan of a CO₂-limited CO₂-Plume Geothermal (CPG) system with a horizontal production well, Geothermics 55 (2015) 182e194, https://doi.org/10.1016/j.geothermics.2015.02.005.
[12] J.B. Randolph, M.O. Saar, Coupling geothermal energy capture with carbon dioxide sequestration in naturally permeable, porous geologic formations: a comparison with enhanced geothermal systems, Trans. Geoth. Resour. Counc.
34 (2010) 433e437.
[13] J.B. Randolph, M.O. Saar, Combining geothermal energy capture with geologic carbon dioxide sequestration, Geophys. Res. Lett. 38 (2011a) L10401,https://
doi.org/10.1029/2011GL047265.
[14] J.B. Randolph, M.O. Saar, Impact of reservoir permeability on the choice of subsurface geothermal heat exchangefluid: CO2 versus water and native brine, Trans. Geoth. Resour. Counc. 35 (2011b) 521e526.
[15] M.O. Saar, J.B. Randolph, T.H. Kuehn, Carbon dioxide-based geothermal energy generation systems and methods related thereto,&The Regents of the Uni- versity of Minnesota, U.S. Patent No. 8 (316) (2012) 955. Canada Patent No.
2.753.393.
[16] A.D. Atrens, H. Gurgenci, V. Rudolph, CO2 thermosiphon for competitive geothermal power generation, Energy Fuels 23 (2009) 553e557.
[17] B.M. Adams, M.R. Fleming, J.M. Bielicki, J. Hansper, S. Glos, M. Langer, M. Wechsung, M.O. Saar, Grid Scale Energy Storage Using CO2in Sedimentary Basins: the Cost of Power Flexibility, European Geothermal Congress, Hague, Netherlands, 2019, pp. 11e14. June.
[18] T. Buscheck, J. Bielicki, T. Edmunds, T. Hao, Y. Sun, J. Randolph, M.O. Saar, Multi-fluid geo-energy systems: using geologic CO₂storage for geothermal energy production and grid-scale energy storage in sedimentary basins, Geosphere 12 (3) (2016) 1e19.
[19] M.R. Fleming, B.M. Adams, J.B. Randolph, J.D. Ogland-Hand, T.H. Kuehn, T.A. Buscheck, J.M. Bielicki, M.O. Saar, High efficiency and large-scale sub- surface energy storage with CO2, in: Proceedings, 43rd Workshop on Geothermal Reservoir Engineering, Stanford University, Stanford, CA, 2018.
February 12-14, 2018.
[20] M.R. Fleming, B.M. Adams, M.O. Saar, Using sequestered CO₂as geothermal workingfluid to generate electricity and store energy, in: World Geothermal Congress, Reykjavik, 21 May to 26 May, 2021, 2021.
[21] J. Ogland-Hand, J.M. Bielicki, Y. Wang, B.M. Adams, T.A. Buscheck, M.O. Saar, The value of bulk energy storage for reducing CO2emissions and water re- quirements from regional electricity systems, Energy Convers. Manag. 181 (2019) 674e685,https://doi.org/10.1016/j.enconman.2018.12.019.
[22] J. Ogland-Hand, J.M. Bielicki, B.M. Adams, E.S. Nelson, T.A. Buscheck, M.O. Saar, R. Sioshansi, The Value of CO₂-bulk Energy Storage with Wind in Transmission Constrained Electric Power Systems, Energy Convers. Manage. (2020),https://
doi.org/10.1016/j.enconman.2020.113548.
[23] Massachusetts Institute of Technology (MIT), The Future of Geothermal En- ergy: Impact of Enhanced Geothermal Systems (EGS) on the United States in the 21st Century, 2006. http://www.eere.energy.gov/geothermal/future_
geothermal.html.
[24] F.V. Bekun, A.A. Alola, S.A. Sarkodie, Toward a sustainable environment: Nexus between CO₂emissions, resource rent, renewable and nonrenewable energy in 16-EU countries, Sci. Total Environ. 657 (2019) 1023e1029,https://doi.org/
10.1016/j.scitotenv.2018.12.104.
[25] Environmental Protection Agency (EPA), Inventory of U.S. Greenhouse Gas Emissions: Sinks and Sources, 2012. EPA 430-R-14-003,http://www.epa.gov/
climatechange/emissions/usinventoryreport.html.
[26] Energy Information Agency (EIA), Electric power monthly. January, Available at:http://www.eia.gov/electricity/monthly/, 2015.
[27] IRENA, Renewable Power Generation Costs in 2018, International Renewable Energy Agency, Abu Dhabi, 2019.
[28] D. Brown, A hot dry rock geothermal energy concept utilizing supercritical CO2 instead of water, in: Proceedings of the Twenty-Fifth Workshop on Geothermal Reservoir Engineering, Stanford University, Stanford, California, 2000. January 24-26, 2000.
[29] K. Pruess, Enhanced geothermal systems (EGS) using CO2as workingfluidda novel approach for generating renewable energy with simultaneous seques- tration of carbon, Geothermics 35 (2006) 351e367.
[30] F. Amann, V. Gischig, K. Evans, J. Doetsch, R. Jalali, B. Valley, H. Krietsch, N. Dutler, L. Villiger, B. Brixel, M. Klepikova, A. Kittil€a, C. Madonna, S. Wiemer, M.O. Saar, S. Loew, T. Driesner, H. Maurer, D. Giardini, The seismo-hydro- mechanical behaviour during deep geothermal reservoir stimulations: open questions tackled in a decameter-scale in-situ stimulation experiment, Solid Earth (2018) 115e137,https://doi.org/10.5194/se-9-115-2018.
[31] V.S. Gischig, D. Giardini, F. Amann, M. Hertrich, H. Krietsch, S. Loew, H. Maurer, L. Villiger, S. Wiemer, F. Bethmann, B. Brixel, J. Doetsch, N. Gholizadeh Doonechaly, T. Driesner, N. Dutler, K.F. Evans, M. Jalali, D. Jordan, A. Kittil€a, X. Ma, P. Meier, M. Nejati, A. Obermann, K. Plenkers, M.O. Saar, A. Shakas, B. Valley, Hydraulic Stimulation and Fluid Circulation Experiments in Underground Laboratories: Stepping up the Scale towards Engineered Geothermal Systems, Geomechanics for Energy and the Envi- ronment, 2019,https://doi.org/10.1016/j.gete.2019.100175.
[32] A. Kittil€a, M.R. Jalali, M. Somogyvari, K.F. Evans, M.O. Saar, X.-Z. Kong, Char- acterization of the effects of hydraulic stimulation with tracer-based temporal moment analysis and tomographic inversion, Geothermics 86 (2020) 101820, https://doi.org/10.1016/j.geothermics.2020.101820.
[33] A.D. Atrens, H. Gurgenci, V. Rudolph, Electricity generation using a carbon- dioxide thermosiphon, Geothermics 39 (2010) 161e169.
[34] K.F. Beckers, M.Z. Lukawski, B.J. Anderson, M.C. Moore, J.W. Tester, Levelized costs of electricity and direct-use heat from enhanced geothermal systems, J. Renew. Sustain. Energy 6 (2014), 013141, https://doi.org/10.1063/
1.4865575.
[35] K.F. Beckers, K. McCabe, GEOPHIRES v2.0: updated geothermal techno- economic simulation tool, Geoth. Energy 7 (2019) 5, https://doi.org/
10.1186/s40517-019-0119-6.
[36] M.G. Grimm Lima, P. Sch€adle, D. Vogler, M.O. Saar, X.Z. Kong, Impact of Effective Normal Stress on Capillary Pressure in a Single Natural Fracture, European Geothermal Congress, Den Haag, The Netherlands, 2019, pp. 11e14.
[37] M.G. Grimm Lima, P. Sch€adle, C.P. Green, D. Vogler, M.O. Saar, X.Z. Kong, Permeability impairment and salt precipitation patterns during CO₂injection into single natural brine-filled fractures, Water Resour. Res. (2020),https://
doi.org/10.1029/2020WR027213.
[38] W.L. Ellsworth, D. Giardini, J. Townend, S. Ge, T. Shimamoto, Triggering of the Pohang, Korea, earthquake (Mw 5.5) by enhanced geothermal system stim- ulation, Seismol Res. Lett. 90 (5) (2019),https://doi.org/10.1785/0220190102.
[39] B.C. Gordalla, U. Ewers, F.H. Frimmel, Hydraulic fracturing: a toxicological threat for groundwater and drinking-water? Environ. Earth Sci. 70 (2013) 3875e3893.
[40] A. Kissinger, R. Helmig, A. Ebigbo, H. Class, T. Lange, M. Sauter, M. Heitfeld, J. Klünker, W. Jahnke, Hydraulic fracturing in unconventional gas reservoirs:
risks in the geological system, part 2, Environ. Earth Sci. 70 (2013) 3855e3873.
[41] J.L. Coleman, S.M. Cahan, Preliminary Catalog of the Sedimentary Basins of the United States: U.S. Geological Survey Open-File Report 2012e1111, 2012.
http://pubs.usgs.gov/of/2012/1111/.
[42] National Energy Technology Laboratory (NETL), Carbon Storage Atlas,fifth ed., 2015. https://www.netl.doe.gov/coal/carbon-storage/strategic-program- support/natcarb-atlas.
[43] United States Geologic Survey (USGS), National Assessment of Geologic Car- bon Dioxide Storage ResourcesdData, 2013. Data series 774, version 1.1, http://pubs.usgs.gov/ds/774/.
[44] P.A. Allen, J.R. Allen, Basin Analysis: Principles and Application to Petroleum Play Assessment, John Wiley&Sons, 2013.
[45] G. Einsele, Sedimentary Basins: Evolution, Facies, and Sediment Budget, Springer Science&Business Media, 2000.
[46] J. Hartmann, N. Moosdorf, The new global lithological map database GLiM: a representation of rock properties at the Earth surface, G-cubed 13 (12) (2012), https://doi.org/10.1029/2012GC004370.
[47] T.R. Elliot, T.A. Buscheck, M. Celia, Active CO2reservoir management for sustainable geothermal energy extraction and reduced leakage, Greenhouse Gases: Sci. Technol. 3 (2013) 50e65.
[48] N. Garapati, J.B. Randolph, J.L. Valencia, M.O. Saar, CO2-Plume Geothermal (CPG) heat extraction in multi-layered geologic reservoirs, Energy Procedia 63 (2014b) 7631e7643.
[49] G.L. Mines, (2016). GETEM User Manual. Idaho National Laboratory, INL/EXT- 16-38751. https://workingincaes.inl.gov/SiteAssets/CAES%20Files/FORGE/inl_
ext-16-38751%20GETEM%20User%20Manual%20Final.pdf.
[50] N. Garapati, J.B. Randolph, M.O. Saar, Total heat energy output from, thermal energy contributions to, and reservoir development of CO2Plume Geothermal (CPG) systems, in: Proceedings, Thirty-Ninth Workshop, Geothermal Reser- voir Engineering Stanford University, Stanford, California, 2014a. February 24- 26, 2014.
[51] N. Garapati, B.M. Adams, M.R. Fleming, T.H. Kuehn, M.O. Saar, Combining brine or CO₂ geothermal preheating with low-temperature waste heat: a higher-efficiency hybrid geothermal power system, Journal of CO₂Utilization 42 (2020) 101323,https://doi.org/10.1016/j.jcou.2020.101323.
[52] B. Adams, On the Power Performance and Integration of Carbon-Dioxide Plume Geothermal (CPG) Electrical Energy Production, PhD Thesis. Univer- sity of Minnesota, 2015.http://hdl.handle.net/11299/175183.
[53] K. Pruess, The TOUGH codesda family of simulation tools for multiphase flow and transport processes in permeable media, Vadose Zone J. 3 (2004) 738e746.
[54] S. Klein, Engineering Equation Solver, F-Chart Software, Madison, WI, 2017.
[55] J.M. Bielicki, B.M. Adams, H. Choi, B. Jamiyansuren, S.J. Taff, T.A. Buscheck, J.D.
Ogland-Hand, J.B. Randolph M.O. Saar, (in review). Cost-competitive Geothermal Electricity for Geologic CO2 Storage, Energy Convers. Manag..
[56] K. Pruess, ECO2N: a TOUGH2fluid property module for mixtures of water, NaCl, and CO2, in: Rep. LBNL-57952, Lawrence Berkeley National Laboratory, Berkeley, 2005.
[57] N. Spycher, K. Pruess, A model for thermophysical properties of CO2-brine mixtures at elevated temperatures and pressures, in: Proceedings Thirty-Sixth Workshop on Geothermal Reservoir Engineering, Stanford University, Stan- ford, CA, 2011. January 31eFebruary 2, SGP-TR-191.
[58] J. Ezekiel, B.M. Adams, M.O. Saar,&A. Ebigbo, (in review). Numerical analysis and optimization of the performance of CO2-Plume Geothermal (CPG) pro- duction wells and implications for electric power generation. Geothermics.
[59] R. Span, W. Wagner, A new equation of state for carbon dioxide covering the
fluid region from the triple-point temperature to 1100 K at pressures up to 800 MPa, J. Phys. Chem. Ref. Data 25 (1996) 1509e1596.
[60] H.J. Ramey Jr., Wellbore heat transmission, Soc. Petrol. Eng. 96 (1962) 427e435.
[61] J.B. Randolph, B. Adams, T.H. Kuehn, M.O. Saar, Wellbore heat transfer in CO2- based geothermal systems, Trans. Geoth. Resour. Counc. 36 (2012) 549e554.
[62] H.C.H. Armstead, J.W. Tester, Heat Mining, University Press, Cambridge, 1987.
B.M. Adams, D. Vogler, T.H. Kuehn et al. Renewable Energy 172 (2021) 1393e1403