Research Collection
Working Paper
Decomposing the Effects of Digitalization on Workers' Job Satisfaction
Author(s):
Bolli, Thomas; Pusterla, Filippo Publication Date:
2021-03
Permanent Link:
https://doi.org/10.3929/ethz-b-000473930
Rights / License:
In Copyright - Non-Commercial Use Permitted
This page was generated automatically upon download from the ETH Zurich Research Collection. For more
information please consult the Terms of use.
Chair of Education Systems
CES Working Paper Series
Decomposing the Effects of Digitalization on
Workers' Job Satisfaction
Thomas Bolli & Filippo Pusterla
CES Working Paper, No. 4, 2021
Decomposing the Eects of Digitalization on Workers' Job Satisfaction *
Thomas Bolli & Filippo Pusterla ‡ This version: March 10, 2021
Abstract
This paper provides a conceptual framework for analyzing the importance of the multiple chan- nels through which digitalization aects job satisfaction. Our framework investigates four distinct groups of channels allowing digitalization to shape job satisfaction: change in time use, creation of new activities, access to information, and adoption of communication tools. Using graduates of professional education and training colleges in Switzerland as a case study, we investigate the relative strength of the channels through which digitalization aects job satisfaction. We nd that digitalization increases job satisfaction mainly through the creation of new activities, specically by increasing productivity and making work more interesting. Our results further suggest that among the channels negatively aecting job satisfaction, increase of time pressure and worsening of work-life balance are much more important than the threat of losing one's job. Furthermore, we present evidence on the heterogeneity of these results across gender, age, management position, and eld of study.
JEL-Classication: J28, O33
Keywords: digitalization, job satisfaction.
*
Acknowledgments: We thank ODEC, Umbrella organization of graduates from professional education and training (PET) colleges in Switzerland, for the opportunity to pose specic questions on the subject of digital transformation in the workplace as experienced by PET graduates in the context of the ODEC Salary Survey 2019. We are grateful for comments from Ursula Renold, Reto Odermatt, Thomas Dohmen, and participants at the CES-Leading House Economics of Education joint Workshop.
‡
ETH Zurich, Chair of Education System, Leonhardstrasse 21, 8092 Zurich, Switzerland. Corresponding
address: lippo.pusterla@mtec.ethz.ch
1 Introduction
Digitalization is the rapidly growing sociotechnical phenomenon of adopting information and communication technologies (ICT) (Legner et al., 2017). Most of the economic literature ana- lyzing the labor market eects of digitalization focuses on the number of jobs that new tech- nologies replace (e.g., Autor, 2015; Frey & Osborne, 2017; Acemoglu & Restrepo, 2018; Graetz
& Michaels, 2018). Yet relatively little attention has been paid to the eects of ICT adoption on jobs not replaced by digitalization, with only limited evidence on the mechanisms through which digitalization aects workers' job satisfaction.
However, rms' ability to assess the way in which digitalization aects job satisfaction is crucial, because understanding through which channels digitalization aects workers' job satis- faction might help them better evaluate the introduction of new technologies. Likewise, workers' knowing how digitalization will aect their job satisfaction might help them to assess the con- sequences of increasingly diuse work practices (e.g., home oces).
Theoretically, digitalization can aect workers' job satisfaction either positively (e.g., by decreasing the percentage of repetitive tasks and increasing that of interesting ones) or negatively (e.g., by increasing the level of stress or decreasing work-life balance). A growing body of literature at the intersection of economics and psychology suggests an overall positive eect of digitalization on workers' job satisfaction and well-being (e.g., McMurtrey et al., 2002; Salanova et al., 2004; Golden & Veiga, 2005; Day et al., 2010; Limbu et al., 2014). However, no study looking at how digitalization might aect job satisfaction has yet examined more than one channel through which that eect might operate. For example, Moqbel et al. (2013) highlight the role of social networks in increasing workers' job satisfaction, while Martin & Omrani (2015) show that information technology use positively aects job satisfaction due to an increase in labor productivity. Thus far, no paper systematically identies and assesses the multiple channels through which digitalization aects job satisfaction.
This paper provides a comprehensive framework of the channels through which digitalization may aect job satisfaction. In all channels, digitalization aects job satisfaction by rst changing some characteristic of the job itself, and then that change impacts the worker's satisfaction.
Therefore, all of the channels through which digitalization might aect job satisfaction are
changes in job characteristics caused by digitalization. Castellacci & Tveito (2018) argue that
digitalization shapes workers' job characteristics in four main ways: change in time use, creation
of new activities, access to information, and use of communication tools. We further subdivide these broad dimensions into 10 specic ways that digitalization aects job characteristics. Based on the existing evidence, we formulate hypotheses on how the 10 channels aect job satisfaction.
Specically, we hypothesize that digitalization decreases job satisfaction by increasing time pressure at work, by increasing the fear of losing one's job, by deteriorating work-life balance, and by smoothing the transition between working hours and leisure time. Conversely, we hypothesize that digitalization increases job satisfaction by making work more interesting, by reducing the proportion of repetitive tasks, by increasing productivity, and by increasing autonomy at work.
Furthermore, we hypothesize that digitalization also increases job satisfaction by making forms of working more exible and by simplifying interactions with colleagues and superiors.
We empirically test our hypotheses by using a survey conducted among students and grad- uates of professional education and training (PET) colleges in Switzerland in 2019. Beyond general information on workers, our survey contains specic questions on digital transformation in the workplace, including asking respondents to evaluate statements about the eects of digi- talization on dierent job characteristics and to self-assess the eect of digitalization on their job satisfaction. Having information on both the total eect of digitalization on job satisfaction and the eect of digitalization on single job characteristics allows us to assess the relative importance of the channels through which digitalization aects job satisfaction.
Our results suggest that digitalization increases job satisfaction among PET graduates by in- creasing work productivity, making work more interesting, fostering interactions with coworkers and supervisors, increasing workers' autonomy, and allowing exible forms of work. Further- more, our results suggest only a moderate negative eect of digitalization on job satisfaction through an increase in time pressure. However, we nd that digitalization negatively aects job satisfaction by worsening work-life balance but not by smoothing the transition between working hours and leisure time. Finally, our estimates provide no evidence that digitalization positively aects job satisfaction by reducing repetitive tasks. Although the widespread notions that the fear of losing one's job to digitalization negatively aects job satisfaction is conrmed, it remains small in magnitude in our sample.
Furthermore, heterogeneity analyses on subset of workers suggest that the worsening of the
work-life balance is more relevant for men, for workers aged more than 35 years (roughly the
average age in our sample), for workers with an executive position, and for workers whose eld
of study is technology-related. For the interestingness of work, we nd a larger eect for males
and for workers er than 35. In contrast, the eect that digitalization has on job satisfaction through an increase in autonomy is lower for women, for young workers, and for workers who did not study in technology-related elds. In terms of productivity, we nd that digitalization is more benecial for women, for older workers, for workers without an executive position, and for workers who did not study in technology-related elds. Finally, the positive eect that digitalization has on job satisfaction by simplifying interactions with colleagues and superiors is larger for non-executive workers than for executives.
This paper contributes both theoretically and empirically to the current debate on the impact of digitalization on job satisfaction. We rst build a comprehensive framework of the channels identied in the literature and formulate hypotheses for each of these channels. Second, we provide empirical evidence on the relative importance that these channels have in explaining the eect of digitalization on workers' job satisfaction.
The rest of the paper is organized as follows. Section 2 presents the conceptual framework of the study and derives the hypotheses. Section 3 explains the estimation strategy, and Section 4 describes the data set. Section 5 presents the results and discusses the heterogeneity across workers. Section 6 concludes and discusses implications for future research.
2 Theoretical Framework and Hypotheses
A growing body of literature at the intersection of economics and psychology suggests a positive relationship between digitalization and workers' job satisfaction (e.g., McMurtrey et al., 2002;
Salanova et al., 2004; Golden & Veiga, 2005; Day et al., 2010; Limbu et al., 2014; Martin &
Omrani, 2015). However, no study in this literature has yet analyzed the channels through which digitalization aects job satisfaction in a comprehensive framework. To ll this gap, this paper decomposes the eects of digitalization on workers' job satisfaction into dierent channels and assesses their importance relative to one another.
To identify the channels through which digitalization aects job satisfaction, we use Castel-
lacci & Tveito's (2018) theoretical model, which groups these channels into four distinct dimen-
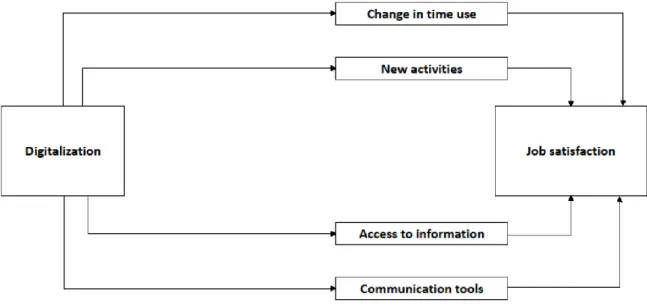
sions, which Figure 1 shows. First, while digitalization increases eciency and frees up time,
it can make some occupations obsolete. Thus, digitalization has an eect on job satisfaction
through the "change in time use" dimension. Second, digitalization can create new activities
that provide both security and personal control, in turn leading to a positive eect on job sat-
Figure 1: Dimensions through which digitalization aects job satisfaction
Source: Authors' depiction based on Castellacci & Tveito (2018)
isfaction and well-being. Digitalization has thus an eect on job satisfaction through the "new activities" dimension.
Third, digitalization enables individuals to obtain, access, process, and archive information much more systematically and rapidly than previously possible. Easier information access im- proves quality of work and eventually workers' job satisfaction. Digitalization thus has an eect on job satisfaction through the "access of information" dimension. Fourth, while digitalization increases the opportunities for communication and eventually fosters social capital and knowl- edge sharing, it also distracts workers and reduces their eciency. Digitalization thus has an eect on job satisfaction through the "communication tools" dimension.
To understand the mechanisms through which digitalization aect workers' job satisfaction,
we subdivide Castellacci & Tveito's (2018) four-dimensional theoretical model into 10 specic
channels. Each of these describes one job characteristics aected by digitalization, and the
changes in job characteristics drive changes in workers' job satisfaction. Specically, we con-
sider the following 10 job characteristics aected by digitalization as channels through which
digitalization aects job satisfaction: Time pressure, fear of losing one's job, work-life balance,
smoothness of transition between work and private life, interestingness of tasks, productivity,
autonomy, working time exibility, and the simplicity of interaction with colleagues and supe-
riors. For simplicity, hereafter we refer to the eect that digitalization has on job satisfaction
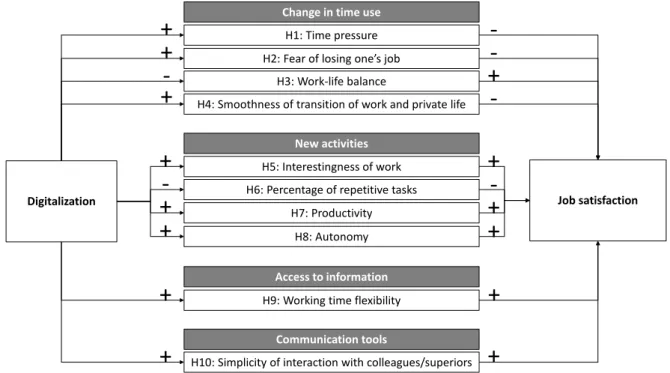
Figure 2: Summary of hypotheses
Digitalization
Change in time use
New activities
Access to information
H10: Simplicity of interaction with colleagues/superiors
Job satisfaction
H9: Working time flexibility Communication tools
H8: Autonomy H5: Interestingness of work H6: Percentage of repetitive tasks
H7: Productivity H1: Time pressure H2: Fear of losing one’s job
H3: Work-life balance
H4: Smoothness of transition of work and private life
+ + + -
+ + +
+ +
+ + + + - + + - - -
-
through a job characteristic as "channels". A channel describes thus digitalization's eect on job satisfaction via a change in a specic job characteristic.
Figure 2 previews the hypotheses that we propose in this paper. The 10 job characteristics are grouped according to the four dimensions developed by Castellacci & Tveito (2018). The left side shows the hypothesized eect of digitalization on the 10 job characteristics (e.g., the eect of digitalization on time pressure at work). The right side displays the hypothesized eect of the 10 job characteristics on job satisfaction (e.g. the eect of time pressure at work on job satisfaction). The combination of these eects yields the eect of digitalization on job satisfaction for each job characteristic and, therefore, each channel.
By formulating our hypotheses, we refer on the entire sample and refrain from rening them according to workers' individual characteristics. Nevertheless, in Section 5.2 we present and discuss the heterogeneity of our results according to gender, age, management position, and eld of study.
Change in Time Use
The dimension change in time use includes four channels (in our model, 1-4): time pressure,
fear of job loss, work-life balance, and transition smoothness between work and private life. The
rst channel, time pressure, captures the possibility that digital technologies at work can expose employees to working under pressure, having frequent tight deadlines resulting from electronic workows, and lacking sucient time for carrying out daily tasks (Agypt & Rubin, 2012). These conditions create "technostress", which Tarafdar et al. (2010) dene as the psychological eects stemming from the inability to cope with computer or software use at work. A large literature shows that technostress negatively aects job satisfaction (e.g., Tarafdar et al., 2007; Ragu- Nathan et al., 2008; Ayyagari et al., 2011). We therefore hypothesize as follows:
H1: Digitalization decreases job satisfaction by increasing time pressure at work.
The second channel, fear of job loss, captures the likelihood that digitalization will make certain jobs obsolete (Rotman, 2013; Autor, 2014 & 2015). Research shows that the perception of job insecurity is an important factor in stress (Hartley et al., 1990), which is negatively related to job satisfaction (Reisel et al., 2010). We therefore hypothesize as follows:
H2: Digitalization decreases job satisfaction by increasing the fear of losing one's job.
The third channel, work-life balance, captures the deterioration of work-life balance created by digitalization (Nam, 2014). The literature suggests that a worse work-life balance negatively aects subjective job satisfaction (Gallie & Russell, 2009; Scandura & Lankau, 1997). We therefore hypothesize as follows:
H3: Digitalization decreases job satisfaction by deteriorating the work-life balance.
The fourth channel, transition smoothness between work and private life, captures digi- talization's allowing a smoother transition between working hours and leisure time (Boswell
& Olson-Buchanan, 2007). A smoother transition between the two can have negative conse- quences for job satisfaction, for example, by exacerbating the work-family conict (Boswell &
Olson-Buchanan, 2007). We therefore hypothesize as follows:
H4: Digitalization decreases job satisfaction by smoothing the transition between working hours and leisure time.
New Activities
The dimension new activities includes four channels (in our model, 5-8): interestingness of tasks,
percentage of repetitive tasks, productivity, and autonomy. The rst of these channels (i.e., the
fth channel), interestingness of tasks, captures the way in which digitalization leads to the creation and development of new working activities and tasks (Carlsson, 2004). These new activities often require specic skills, provide physical security, and increase personal control, all factors that are positive for job satisfaction (Warr, 2003; Castellacci & Viñas-Bardolet, 2019).
We therefore hypothesize as follows:
H5: Digitalization increases job satisfaction by making work more interesting.
The sixth channel, percentage of repetitive tasks, captures the eect of digitalization in reducing the proportion of repetitive tasks and physically straining labor (Acemoglu & Autor, 2011). Such a reduction allows workers to allocate more time to more rewarding activities (Aske- nazy & Caroli, 2010), an outcome that, in turn, has a positive eect on workers' job satisfaction (Melamed et al., 1995; Kristensen & Johansson, 2008). Nevertheless, the introduction of new tasks might also increase the level of job stress, in turn negatively inuencing job satisfaction (Konradt et al., 2003; Morris & Venkatesh, 2010). However, Castellacci & Viñas-Bardolet (2019) suggest that the eect of a reduction in repetitive tasks on job satisfaction is particularly pos- itive for white-collar workers. As the survey sample in this paper consists of tertiary-educated workers, we favor the argument of more rewarding activities. We thus formulate the following hypothesis:
H6: Digitalization increases job satisfaction by reducing the proportion of repetitive tasks.
The seventh channel, productivity, shows that digitalization allows more productive activities (Brynjolfsson & McAfee, 2011). Activities that are more productive imply higher wages (all else being equal), which in turn lead to higher job satisfaction (D'Addio et al., 2007; Castellacci &
Viñas-Bardolet, 2019). We therefore hypothesize as follows:
H7: Digitalization increases job satisfaction by increasing productivity.
The eighth channel, autonomy, captures the eect of digitalization on employees' autonomy
at work. Mazmanian (2013) provides evidence that digital devices do not limit workers' discre-
tion, freedom, or authority but instead enhance their autonomy. Bloom et al. (2014) further
suggest that ICT makes accessing information less expensive, thereby giving workers more au-
tonomy and a wider span of control. ICT thus acts as a decentralizing force that allows workers
to handle situations more autonomously. Furthermore, the literature shows that workers with
a higher degree of autonomy are typically more satised (Golden & Veiga, 2005; Lopes et al., 2014). We therefore hypothesize as follows:
H8: Digitalization increases job satisfaction by increasing autonomy at work.
Access to Information
The dimension access to information has only one channel (in our model, 9). This ninth channel, working time exibility, captures the way digitalization improves employees' access to informa- tion, with an increasing number of tasks no longer requiring a specic workstation (Popma, 2013).
Workplace-independent access to information enables more exible working time (Duxbury et al., 2007), and Raziq & Maulabakhsh (2015) show that exible working hours increase job satisfac- tion. Similarly, Kelliher & Anderson (2010) nd that exible workers report higher levels of job satisfaction than their non-exible counterparts. We therefore hypothesize as follows:
H9: Digitalization increases job satisfaction by making forms of working more exible.
Communication Tools
The dimension communication tools has only one channel (in our model, 10). This tenth channel, simplicity of interaction with colleagues and superiors, captures digitalization's simplifying the interactions between individuals. For example, Koku et al. (2001) highlight the positive eect of the Internet in facilitating and maintaining o-line relationships. Zhao (2006) nds that individuals using the Internet for interpersonal contact usually have more social ties than those who do not. Furthermore, digital technologies also simplify workplace interaction. Moqbel et al.
(2013) focus on the role of social networking sites (SNS), which are web-based services that allow workers to build social networks or relationships with other people. They nd that the use of SNS at work increases organizational commitment and job satisfaction.
In a sample covering 13 countries, Amichai-Hamburger & Hayat (2011) investigate the in-
uence of Internet use on social interactions, nding that Internet usage is positively correlated
with the socially related interactions of people in the same profession. In turn, simplied in-
teractions with colleagues and superiors increase workers' job satisfaction (Pincus, 1986; Warr,
2003). Additionally, Intranet use at work has been found to positively aect the sharing of in-
ternal knowledge within a rm (Hendriks, 1999), and knowledge sharing improves social capital
(Huysman & Wulf, 2006) and increases work quality (Haas & Hansen, 2007), in turn increasing job satisfaction (Requena, 2003).
Nevertheless, some recent studies also show that the use of communication tools at work (e.g., Facebook) can have negative eects on productivity, in turn negatively aecting workers' morale and job satisfaction (Brooks, 2015). However, despite these new contradictory results, we favor the argument of enhanced communication because more largely documented by the literature. We therefore hypothesize as follows:
H10: Digitalization increases job satisfaction by simplifying worker interactions with col- leagues and superiors.
3 Empirical strategy
This section presents the empirical strategy we use to assess the relative importance of the channels through which digitalization aects job satisfaction. To do so, we start by presenting a structural model and discussing the challenges that such an approach could pose. We then apply a reduced form model, which allows us to test our hypotheses and poses fewer challenges to both measuring digitalization intensity and assessing job satisfaction.
3.1 Structural Model
Identifying the inuence of each channel in a structural model requires estimating multiple equations. First, we need to estimate the eect of digitalization on 10 job characteristics for worker i as represented by the following system of equations:
J ob Characteristic c i φ c θ c Digitalization i ϑ c X i τ ci (1) where Digitalization i stands for the digitalization of worker i 's job, X i is a vector of other variables that aect job satisfaction of worker i , and τ is the error term.
Second, the structural model contains an estimation of the relationship between the 10 job characteristics c and the job satisfaction of worker i :
J ob Satisf action i α
¸ 10 c 1
β c J ob Characteristic c i η X i ϑ i (2)
where β c reects the impact of job characteristic c on job satisfaction. The vector X is dened as above, while ϑ is the error term.
However, estimating this structural model faces a number of challenges in terms of measuring the variables in equations 1 and 2. An empirical challenge involves the diculty in measuring digitalization. The literature often measures digitalization by counting the number of computer or digital devices (Caselli & Coleman, 2001). Nevertheless, the stock of computers measures digitalization imperfectly, because it measures only the availability of computers, not their ef- fective use by workers. Therefore, we apply a reduced form model, which allows us to identify the relative importance of each channel.
3.2 Reduced Form Model
Inserting equation 1 into equation 2 and taking the rst derivative with respect to digitalization yields the following reduced form:
ω i BJ ob Satisf action i
B Digitalization i
¸ 10 c 1
β c θ ci i (3)
where ω i is the partial derivative of job satisfaction with respect to digitalization. θ c denotes the eect of digitalization on job characteristic c . β c reects the impact of job characteristic c on job satisfaction.
We operationalize ω i by asking respondents how strongly digitalization aects his or her job satisfaction, measured on a ve-point Likert scale. Similarly, we operationalize θ c by asking respondents to assess the impact of digitalization on the corresponding job characteristic c. We thus estimate via OLS the following equation:
r ω i
¸ 10 c 1
β c θ ci γ X i i (4)
where the superscript r describes parameters that have been self-assessed by respondents.
This equation also account for other workers' characteristics that might aect job satisfaction
but are unrelated to digitalization. Specically, X i is a vector of control variables, a vector with
the following worker characteristics: age , age 2 , gender , a dummy for an executive position, 8
dummies for the eld of study, and 13 dummies for the industry. Finally, the identication of β
assumes that job characteristics c are orthogonal to any other potential characteristics through
which digitalization aects job satisfaction. To account for this potential source of omitted
variable bias, X i further includes a variable that captures how strongly respondents assess the impact of digitalization on their job in the previous year, measured on a ve-point Likert scale.
is the error term that is estimated robust.
Estimating equation 4 via OLS yields estimates for the impact of job characteristic c on job satisfaction. To analyze the eect of digitalization on job satisfaction, we multiply for each worker characteristic c the estimated p β c with the corresponding r θ c . While the calculation of β p c θ r c is straightforward, its interpretation is far from trivial. Indeed, this measure combines the eect of job characteristic c on job satisfaction ( p β c ) and the extent to which workers agree with their survey assessment of the impact of digitalization on this job characteristic ( r θ c ). Therefore, to simplify the interpretation, we decompose the overall goodness of t R 2 into the explanatory power of individual regressors. The decomposition of R 2 translates into the importance of the dierent regressors by giving a measure that is more easily interpreted.
One convenient measure for decomposing the overall goodness of t is the Shapley value (Shapley, 1953), which computes the contribution of a single variable to the goodness-of-t of a statistical model. Assume, for example, a full regression model with k explanatory variables ( x 1 , x 2 , ..., x k ). According to Huettner et al. (2012), to calculate the contribution of each variable, we need to estimate all possible submodels derived by the permutation of the regressors.
Mathematically, to calculate the contribution of a given regressor j we need to estimate the same number of submodels as the number of permutations ( K! ) of k regressors:
R 2 j 1
K! R 2 p f p x µ j , x j qq R 2 p f p x µ j qq (5) where µ maps all K! variable permutations. By subtracting the R 2 of the model not including x j from the R 2 of the model including x j and all regressors preceding x j in that particular order ( x µ j ), we obtain the Shapley value, which measures j 's average marginal contribution to R 2 across all possible permutations.
4 Data and description of variables
The data stems from the ODEC Salary Survey conducted as an online survey among students
and graduates of Swiss professional education and training (PET) colleges in 2019. This formal
vocational tertiary education at level 6 of the ISCED-2011 classication takes from two to four
years, depending on the PET college and on whether the education is full-time or part-time.
While students account for about 10% of the sample and have a response rate of about 20%, graduates account for the remaining 90%, with a response rate of about 11% 1 .
Table 1 shows the summary statistics of variables used in the estimation. The dependent variable measures the inuence of digitalization on job satisfaction on a ve-point Likert scale (1="less satised"; 3="no change"; 5="more satised"). The mean of 3.47 suggests that dig- italization on average increases job satisfaction of workers with a PET college diploma. This persistent positive eect of digitalization on workers' job satisfactionin line with the ndings in literature (e.g., McMurtrey et al., 2002; Salanova et al., 2004; Golden & Veiga, 2005; Day et al., 2010; Limbu et al., 2014; Martin & Omrani, 2015)needs cautious interpretation, because it is specic to the subsample in this paper.
Breakdowns of the dependent variable by gender, age, management position, and eld of study yield values above 3, suggesting an overall positive eect of digitalization on job satis- faction. Nevertheless, some dierences are noteworthy. Men report a larger positive eect of digitalization on job satisfaction than women. Additionally, workers younger than age 35 also report higher levels of job satisfaction than do older workers. We also observe small dierences between workers in executive positions, who report a slightly larger positive eect than non- executive workers. Finally, across elds of study, we nd that workers in the elds of social work and adult education report almost no change in digitalization-induced job satisfaction, whereas workers from the elds of arts and business administration report a relatively large positive eect.
The main explanatory variables capture, on a ve-point Likert scale, to what extent respon- dents agree with statements about the impact of digitalization on the 10 job channels through which we hypothesize that digitalization aects job satisfaction (1="I don't agree at all"; 5="I fully agree"). The results suggest that the strongest eect of digitalization lies in increasing productivity (3.65), followed by simplifying interactions with colleagues and superiors (3.41) and making work more interesting (3.4). Moreover, we nd an average eect in terms of an increase in more exible forms of working time (3.25), a reduction in the proportion of repetitive tasks (3.24), an increase in time pressure (3.23), an increase in autonomy (3.15), and a smooth transition between working hours and leisure time (3.01). The least strong eects appear in terms of worsening work-life balance (2.72) and fear of losing one's job (1.94).
1
Estimations based solely on graduates provides qualitatively similar results as those on the whole sample.
Table 1: Variables description
N Mean SD Min Max
DEPENDENT VARIABLE
Dig. aects my job satisfaction 3089 3.47 0.91 1 5
MAIN EXPLANATORY VARIABLES
Dig. increases the time pressure at work 3089 3.23 1.18 1 5
Dig. puts my job at risk 3089 1.94 1.06 1 5
Dig. worsens the work-life balance 3089 2.72 1.18 1 5
Dig. leads to a smooth transition between working hours and leisure time 3089 3.01 1.2 1 5
Dig. makes my work more interesting 3089 3.4 1.09 1 5
Dig. reduces the proportion of repetitive tasks 3089 3.24 1.16 1 5
Dig. increases my productivity 3089 3.65 1.04 1 5
Dig. increases my autonomy at work 3089 3.15 1.06 1 5
Dig. enables more exible forms of working time 3089 3.25 1.35 1 5 Dig. simplies interactions with colleagues and superiors 3089 3.41 1.11 1 5 CONTROL VARIABLES
How strongly does Dig. aect the work over the last year? 3089 3.44 1.14 1 5
Women 3089 0.19 0.4 0 1
Age 3089 35.7 9.65 20 72
Executive (dummy for being rm's board director 3099 0.29 0.45 0 1 or member of management)
Field of study
Agronomy 3089 0.01 0.1 0 1
Catering 3089 0.05 0.22 0 1
Health 3089 0.06 0.25 0 1
Arts 3089 0.01 0.1 0 1
Social work and adult education 3089 0.04 0.19 0 1
Technology 3089 0.66 0.47 0 1
Business administration 3089 0.17 0.37 0 1
Industry
Manufacturing 3089 0.33 0.47 0 1
Construction 3089 0.12 0.32 0 1
Wholesale and retail trade; repair of motor vehicles and motorcycles 3089 0.03 0.16 0 1
Transportation and storage 3089 0.03 0.17 0 1
Accommodation and food service activities 3089 0.04 0.2 0 1
Information and communication 3089 0.08 0.27 0 1
Financial and insurance activities 3089 0.05 0.21 0 1
Professional, scientic and technical activities 3089 0.06 0.25 0 1 Administrative and support service activities 3089 0.08 0.27 0 1 Public administration and defence; compulsory social security 3089 0.05 0.21 0 1
Education 3089 0.04 0.19 0 1
Human health and social work activities 3089 0.1 0.3 0 1
Other service activities 3089 0 0.06 0 1
If digitalization has only a moderate eect on a given job characteristic, we hardly identify the overall eect of digitalization on job satisfaction through this job characteristic, and thus independently on the eect that this job characteristic has on job satisfaction. Therefore, these results cast doubt on both hypotheses H3 and H5. However, these two low values do not necessarily mean that work-life-balance and the fear of losing one's job have no eect on job satisfaction. Instead, it means that digitalization does not aect them.
The control variables in the bottom part of Table 1 show that most respondents are male
and between ages 20 and 72. The average age of respondents is about 36 years, meaning
that our sample is relatively young. About 30% hold executive positions, either as a member of a rm's board of directors or as part of management. The summary statistics show that about two-thirds of respondents chose technology-related eld of study. About one sixth are in business administration, while the remaining sixth are subdivided among the other ve elds.
Finally, for the industry of activity, Table 1 shows that one third of the respondents are active in manufacturing. Moreover, nancial and insurance activities, as well as human health and social work activities, represent a large portion of the sample.
A comparison between these summary statistics and the values collected by the Swiss Federal Statistical Oce (SFO) through the Survey on Professional Education 2 suggests that our sample is not completely representative of the specic subgroup of workers having a degree from a PET college. Concretely, our sample overrepresents men and graduates in technology-related elds.
Nevertheless, the average age at graduation in our sample is in line with the ones reported by of respondents is close to the one reported by the SFO.
5 Estimation Results
5.1 Main Results
The rst three columns of Table 2 show the estimation results of the reduced form model presented in equation 4. In column (4) we report the average eect of digitalization on job characteristics, while in column (5) we multiply it with the estimated coecients. Finally, in column (6) we show the Shapley values, which describe the contribution of each regressor in the goodness-of-t of the estimation in column (3).
The estimations in the rst three columns dier in terms of control variables, e.g., column (1) contains no control variables. Overall, the 10 characteristics explain about 34.5% of the total variance in the eect of digitalization on job satisfaction. Column (2) controls for individual characteristics, and column (3) further controls for the inuence of digitalization on work in the preceding year. We nd that these control variables have hardly any inuence on the estimated coecients. While the additional control variables increase the percentage of explained variance, they do so only slightly, to 37.9%.
2
https://www.bfs.admin.ch/bfs/en/home/statistics/education-science/diploma/
tertiary-advanced-professional-training.html
Table 2: Estimation results (1) (2) (3) (4) (5) (6) p β
cp β
cp β
cr θ
cp β
c*r θ
cPercen tage of Explained Variation
Dig. increases the time pressure at w ork -0.0741*** -0 .0 683*** -0.0776*** 3.23 -0.21 1.7 (0.014) (0.014) (0.0139) Dig. puts m y job at risk -0.0312** -0.0287** -0.0343*** 1.94 -0 .0 67 0.52 (-0.0147) (-0.015) (-0.0148) Dig. w orsens the w ork-life balance -0.102*** -0.0953* ** -0.102*** 2.72 -0.278 3.45 (-0.0151) (-0.015) (-0.0148) Dig. leads to a smo oth transition bet w een w orking hours and leisure time -0.0056 0.00145 0.00174 3.01 0.5 0.35 (-0.0139) (-0.0139) (-0.0137) Dig. mak es m y w ork more in teresting 0.165*** 0.170*** 0.155 *** 3.4 0.527 6.51 (-0.0169) (-0.0171) (-0.0171) Dig. reduces the prop ortion of rep etitiv e tasks 0.01 38 0.0182 0.0193 3.24 0.06 3 1.22 (-0.0137) (-0.0137) ( -0.0136) Dig. increases m y pro ductivit y 0.281*** 0.271*** 0.255 *** 3.65 0.928 11.01 (-0.0177) (-0.0177) (-0.0179) Dig. increases m y au to no m y at w ork 0.04 05** 0.0403** 0.0380** 3.15 0.119 1.94 (-0.0167) (-0.0167) (-0.0164) Dig. enables more exible forms of w orking time 0.0231** 0.0344*** 0.0269** 3.25 0.087 1.48 (-0.0119) (-0.0122) (-0.0122) Dig. simplies in teractions with colleagues and sup eriors 0.05 95*** 0.0541*** 0.0548*** 3.41 0.187 3.12 (-0.0148) (-0.0148) (-0.0148) Ho w strongly do es Dig. aect the w ork ov er the la st year? 0.112*** 0.386 3.24 (-0.0134) W ork er characteristics Y es Y es 3.37 N 3089 3089 308 9 R
2(%) 34.5 36.2 37.9 Notes: Columns (1) to (3) rep orts the results of the OLS regression ha ving as dep enden t variable the eect of digitalizati on on job satisfaction, whic h is measu red on a v e poin t Lik ert scale (1=less satised, 3=no change, 5=more satised). Robust standard errors in paren theses. * p<0.10, ** p<0.05, *** p<0.01. W ork er charac- teristics is a vector of con trol variables as describ ed in T ab le 1 plus indust ry dummies according to 1-digit NA CE Rev. 2 class ication. Colu m n (4) sho ws r θ
c,the av e- rage eect of digit alization on job characteristics as rep ort ed in T able 1. Column (5) m ultiplies the β
OLSfrom column (3) with the r θ
cfrom column (4). Column (6) rep orts the Shapley values, whic h describ e th e absolute con tribution of eac h regressor in the go odness-of-t of the estimation in column (3).
The coecients of the OLS regression of column (3) test our hypotheses on the eect of each job characteristic on job satisfaction. The value for p β c θ r c reported in column (5) and the Shapley values reported in column (6) allow us to quantify the importance of each channel.
We start by considering the channels of the dimension "time use". The OLS coecient for time pressure at work is negative and statistically signicant, suggesting that the increase in time pressure at work resulting from digitalization decreases job satisfaction. Column (4) reports the corresponding value of r θ c , the impact of digitalization on time pressure, which is average.
Thus, as column (5) shows, p β c θ r c amounts to -0.25. Column (6) shows that the increase in time pressure due to digitalization accounts for about 1.7% of the total variance. This nding support hypothesis H1that digitalization decreases job satisfaction through an increase in time pressure.
The second channel of the "time use" dimension is the fear of job loss. While OLS coecients for the fear of losing one's job are also negative and statistically signicant, they are lower than the coecient for the increase in time pressure. Moreover, r θ c is relatively low. Thus the resulting value of p β c θ r c is particularly low. This channel explains about 0.5% of the overall variance.
Nevertheless, we should not interpret this result as meaning that the fear of losing one's job has no eect on job satisfaction. Instead, in this case it means that digitalization has almost no eect on workers' job satisfaction in terms of that fear. Thus, while we conrm hypothesis H2that digitalization decreases job satisfaction by increasing the fear of losing one's jobwe nd a relatively small eect magnitude for this channel in our sample. This nding, however, should be relativized given the relatively low unemployment probability of the sample consisting of workers with a degree from a PET college 3 .
The third channel of the "time use" dimension is work-life balance. The large and negative OLS coecient suggests that this channel has the strongest negative eect on job satisfaction of all 10 channels. However, as with the previous channel, the relatively low value of r θ c reduces the value of p β c θ r c . Given that this channel explains about 3.4% of the total variance, we nd that the relatively high value of r θ c conrms hypothesis H3that digitalization decreases job satisfaction by deteriorating the work-life balance.
The nal channel in the "time use" dimension is the smoothness of transition between work and private life. The OLS coecient for this channel is not statistically dierent from zero, and θ
3
See the unemployment rate of workers with tertiary professional education https://www.bfs.
admin.ch/bfs/de/home/statistiken/bildung-wissenschaft/bildungsindikatoren/themen/wirkung/
arbeitsmarktstatus.assetdetail.12527130.html
remains relatively low. As the resulting p β c θ r c is also close to zero, this channel explains less than 0.4% of the total variance. Thus, a smoother transition between working hours and leisure due to digitalization does not aect job satisfaction. Our ndings therefore do not support hypothesis H4that digitalization decreases job satisfaction by smoothing the transition between working hours and leisure time.
For the dimension "new activities", the OLS coecient for the interestingness of work is positive and statistically signicant. Given the high value of r θ c , the resulting p β c θ r c is also high.
This channel explains about 6.5% of the total variance. Our estimations thus support hypothesis H5that the interestingness of work as a result of digitalization positively aects job satisfaction.
The second channel of the "new activities" dimension is percentage of repetitive tasks. The OLS coecient for this channel is small and not statistically dierent from zero. Thus the resulting value of p β c θ r c is low, even though r θ c is relatively high. This channel explains about 1.2% of the total variance. Nevertheless, the low value of p β c suggests that the reduction in the proportion of repetitive tasks as a result of digitalization does not markedly aect job satisfac- tion. Hypothesis H6that digitalization increases job satisfaction by reducing the proportion of repetitive tasksis thus not conrmed.
The third channel of the "new activities" dimension is productivity. The large and positive OLS coecient suggests that this channel has the strongest eect on job satisfaction. Fur- thermore, this channel has the largest value of r θ c , meaning that digitalization aects workers' productivity particularly strongly. The combination of these two large values gives a very high value of p β c θ r c , showing the large contribution of this channel to explaining the eect of digi- talization on job satisfaction. Indeed, this channel alone accounts for about 11% of the total variance. This result clearly supports hypothesis H7that the increase in productivity caused by digitalization positively aects job satisfaction.
The fourth channel of the "new activities" dimension is autonomy. The OLS coecient for the increase in autonomy is positive and statistically signicant. However, the relatively low value of p β c multiplied by an average value of r θ c gives a relatively small value of p β c θ r c . This channel explains altogether about 1.9% of the total variance in the model, a nding suggesting that greater autonomy at work due to digitalization positively aects job satisfaction, and thus support hypothesis H8.
As for dimension "access to information", we observe that the OLS coecient for the ex-
ibility of working time is positive and statistically signicant but relatively small. Given the
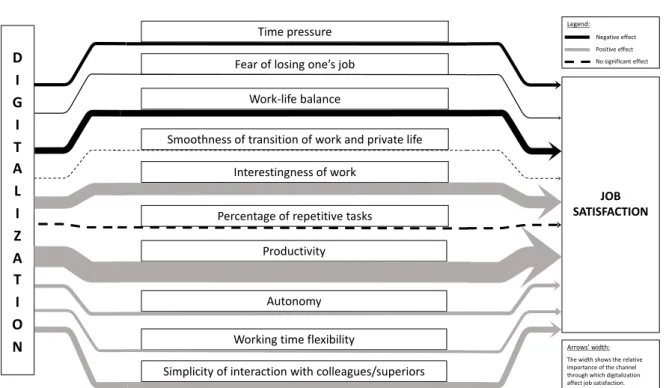
Figure 3: Summary of the results
SATISFACTION JOB
D I G
I T A L I Z A T I O N
Simplicity of interaction with colleagues/superiors Working time flexibility
Autonomy Interestingness of work
Percentage of repetitive tasks Productivity Time pressure Fear of losing one’s job
Work-life balance
Smoothness of transition of work and private life
Legend:
Negative effect Positive effect No significant effect
Arrows’ width:
The width shows the relative importance of the channel through which digitalization affect job satisfaction.
Notes: This gure shows the relative importance of the 10 channels in explaining the impact of digitalization on workers' job satisfaction. The width of the arrows represents the relative importance of the channel. Black stands for channels with negative eects on job satisfaction. Grey represents a positive eect. A dashed arrow indicates that digitalization via this channel has no statistically signicant eect on job satisfaction.
average value of r θ c , the resulting value of p β c θ r c is relatively low. This indicator explains about 1.5% of the total variance. Therefore we nd support for hypothesis H9, suggesting that more exible forms of work stemming from digitalization increase job satisfaction.
For the coecient of the dimension "communication tools", the OLS coecient for the sim- plicity of interaction with colleagues and superiors is positive and statistically signicant. Given the relatively high value of r θ c , the resulting p β c θ r c is also relatively high. This channel explains about 3.1% of the overall variance, meaning that digitalization positively aects job satisfaction by simplifying interactions with colleagues and supervisors, and thus supports hypothesis H10.
Figure 3 summarizes the main ndings discussed thus far.
5.2 Heterogeneity Across Workers
By formulating the hypothesis in Section 2, we refer on the entire sample and refrain from rening them according to workers' individual characteristics. Nevertheless, the data oers information on workers' characteristics, which can be used to explore the heterogeneity of the results.
Figure 4 shows the eect of digitalization on the ten channels by subgroups of workers.
In Sub-gure 4a we report the mean of women compared to men. This gure suggests that
Figure 4: Dierences in the eect of di gi ta liza ti on on the channels across subgroups (a) Gender
1 2 3 4 5
Time pressure Fear of losing one's job Work-life balance Smoothness of transition of work and private life Interestingness of work Percentage of repetivie tasks Productivity Autonomy Working time flexibility Simplicity of interaction with colleagues/superiors
MenWomen
(b) Age
1 2 3 4 5
Time pressure Fear of losing one's job Work-life balance Smoothness of transition of work and private life Interestingness of work Percentage of repetivie tasks Productivity Autonomy Working time flexibility Simplicity of interaction with colleagues/superiors
YoungOld
(c) Executiv e position
1 2 3 4 5
Time pressure Fear of losing one's job Work-life balance Smoothness of transition of work and private life Interestingness of work Percentage of repetivie tasks Productivity Autonomy Working time flexibility Simplicity of interaction with colleagues/superiors
Non-ExecutiveExecutive
(d) Field of study
1 2 3 4 5
Time pressure Fear of losing one's job Work-life balance Smoothness of transition of work and private life Interestingness of work Percentage of repetivie tasks Productivity Autonomy Working time flexibility Simplicity of interaction with colleagues/superiors
Non-technologyTechnology
Notes: This gure sho ws θ
c, the eect of digitalization on the ten channels, across subgou ps of w ork ers. These variables reppresen t on a v e-p oin t Lik ert scale to wh at exten t resp onden ts agree with statemen ts ab out the impact of digitalization on eac h cha nnel. (1 ="I don't agree at all"; 5="I fu lly ag ree")
digitalization aects job characteristics relatively less strongly for women. The only exceptions are the eects of digitalization on increasing the fear of job loss and the simplied interaction with colleagues or superiors. These two channels are equally aected across gender. This gure suggests thus an overall weaker impact of digitalization on women compared to men.
The situation is less clear-cut when subdividing the sample by age. Sub-gure 4b illustrates that digitalization has a relatively less strong eect on time pressure, work-life balance, and transition between work and private life for workers younger than 35 years. In contrast, digital- ization increases the interestingness of work, productivity, and autonomy relatively stronger for young workers than for older ones.
Sub-gure 4c presents the comparison of workers having a managerial position compared to workers without managerial position. Digitalization increases the fear of job loss less strongly by management workers. There is no statistical dierence regarding time pressure, interestingness of work, and autonomy. In contrast, digitalization has a stronger eect on workers with managerial position with regard to the worsening of the work-life balance, the smoothing of the transition between work and private life, as well as in term of reducing repetitive tasks and making work more exible.
Finally, Sub-gure 4d compares the means of workers that graduated in a technology-related eldthe one by far most diused in our samplecompared to other workers. In this case, we observe that digitalization increases the fear of job loss relatively less strong for workers who studied in a technology-related eld. In contrast, the eect of digitalization with regard to the increase in time pressure, the worsening of the work-life balance, smoothing transition between work and private life, the increase in the interestingness of work, the increase in autonomy as well as the increase in working time exibility are relatively stronger aected compared to workers who have not studied in technology-related elds.
Similarly as in the previous subsection, we run the reduced form model described in equa-
tion 4 for sub samples of workers according to their individual characteristics. To ease the
comparisons across subgroups we report in Figure 5 the Shapley values which allow us to quan-
tify the relative importance of each channel. Sub-gure 5a reports the results according to
respondents' gender; Sub-gure 5b according to their age; Sub-gure 5c according to their man-
agement position; and Sub-gure 5d according to their eld of study. Tables A1A4 in the
Appendix reports the OLS estimates by workers' characteristics, which underpin the regressors'
contribution to R 2 .
Figure 5: Con tribution to R 2 across sub-samples (a) Gender
0 5 10
15 Percentage of Explained Variation
Time pressure Fear of losing one's job Work-life balance Smoothness of transition of work and private life Interestingness of work Percentage of repetivie tasks Productivity Autonomy Working time flexibility Simplicity of interaction with colleagues/superiors
MenWomen
(b) Age
0 5 10
15 Percentage of Explained Variation
Time pressure Fear of losing one's job Work-life balance Smoothness of transition of work and private life Interestingness of work Percentage of repetivie tasks Productivity Autonomy Working time flexibility Simplicity of interaction with colleagues/superiors
YoungOld
(c) Executiv e position
0 5 10
15 Percentage of Explained Variation
Time pressure Fear of losing one's job Work-life balance Smoothness of transition of work and private life Interestingness of work Percentage of repetivie tasks Productivity Autonomy Working time flexibility Simplicity of interaction with colleagues/superiors
Non-ExecutiveExecutive
(d) Field of study
0 5 10
15 Percentage of Explained Variation
Time pressure Fear of losing one's job Work-life balance Smoothness of transition of work and private life Interestingness of work Percentage of repetivie tasks Productivity Autonomy Working time flexibility Simplicity of interaction with colleagues/superiors
Non-TechnologyTechnology