Research Collection
Doctoral Thesis
Managing Lake Kivu: moving from a steady-state to a dynamic modelling approach
Author(s):
Bärenbold, Fabian Publication Date:
2021
Permanent Link:
https://doi.org/10.3929/ethz-b-000470628
Rights / License:
In Copyright - Non-Commercial Use Permitted
This page was generated automatically upon download from the ETH Zurich Research Collection. For more information please consult the Terms of use.
ETH Library
DISS. ETH N. 27276
Managing Lake Kivu: moving from a steady-state to a dynamic modelling approach
A thesis submitted to attain the degree of DOCTOR OF SCIENCES of ETH ZURICH
(Dr. sc. ETH Zurich)
presented by
FABIAN BÄRENBOLD
MSc in Environmental Sciences and Engineering, EPFL
born on 02.02.1988 citizen of Roggliswil, LU
accepted on the recommendation of
Prof. Dr. Rolf Kipfer, examiner Dr. Martin Schmid, co-examiner Prof. Dr. Bernhard Wehrli, co-examiner Prof. Dr. Werner Aeschbach, co-examiner
2021
Table of content
Summary 5
Zusammenfassung 7
Chapter 1 General introduction 9
Chapter 2 No increasing risk of a limnic eruption at Lake Kivu: intercomparison 21
study reveals gas concentrations close to steady state
Chapter 3 Missing atmospheric noble gas concentrations in a large, tropical 39
lake: the case of Lake Kivu, East-Africa
Chapter 4 Dynamic modelling provides new insights into development and 59
maintenance of Lake Kivu’s density stratification
Chapter 5 General conclusion 91
Acknowledgment 97
References 99
Appendix A Supporting information to chapter 2 107
Appendix B Supporting information to chapter 4 121
Summary
Lake Kivu is a deep, meromictic lake in the East-African Rift Valley on the border between Rwanda and the Democratic Republic of the Congo (DRC). It is well-known for its huge reservoir of dissolved carbon dioxide and methane in the permanently stratified deep waters.
The reason for this unusual gas reservoir is the intrusion of warm, saline, gas-rich and dense groundwater into the deep water of Lake Kivu. Besides providing carbon dioxide, the deep inflow of dense groundwater also maintains a strong density stratification, which prevents turbulent mixing. Consequently, the diffusive upward transport of carbon dioxide and methane, which is at least partially of biogenic origin, is very weak. For the surrounding population and their countries, the gas reservoir is a potential risk and a natural resource at the same time.
Although the gases in the lake are currently still far away from saturation (below 55 %), an extreme mixing event could potentially bring deep water to the surface, where it would outgas and asphyxiate animals and humans in the surroundings. In contrast to the potential risk, the methane in Lake Kivu also represents a valuable energy resource for both Rwanda and the DRC.
In 2003, gas measurements indicated an increase of methane concentrations in the deep water of Lake Kivu by around 15 % within 30 years. This is a very fast increase for a lake whose deep water has a residence time of 800 – 1000 years, and therefore, these concerning findings greatly influenced the topics of this dissertation. Firstly, in spite of the increase in methane concen- trations, there had been a lack of reliable gas measurements since 2003. Secondly, the one- dimensional lake model, which had previously been used to assess changes in gas concen- trations and stratification, largely relied on a steady-state assumption. The model was therefore not adequate for the long-term transient simulation of scenarios with fast changing methane concentrations due to natural increase or large-scale gas extraction.
In the first part of this dissertation, we developed a measurement system for dissolved gases in
Lake Kivu, involving a mobile mass spectrometer, which is designed to prevent gas loss during
the sampling process. We successfully used the measurement system to assess carbon dioxide
and methane concentrations in Lake Kivu as part of an intercomparison study with two other
research groups. The results of this study indicate that methane concentrations have been close
to a steady-state since at least 1974 and thus suggest that there is no increasing risk of a
spontaneous gas eruption. In addition to measuring carbon dioxide and methane, we adjusted
an existing measurement technique for dissolved noble gases to collect gas samples in the gas-
rich waters of Lake Kivu. The analysis of these measurements shows that atmospheric noble gases neon and krypton, and the light argon isotope 36 Ar are depleted by 50 – 70 % in the stratified deep waters. We argue that this depletion is most probably not caused by ebullition from the lake, but rather by the inflow of noble gas depleted groundwater. Furthermore, elevated noble gas ratios 3 He/ 4 He and 40 Ar/ 36 Ar corroborate the influence of magmatic gases on Lake Kivu.
In the second part of the dissertation, we developed and calibrated a one-dimensional lake
model for Lake Kivu. In contrast to the previous model, the new model dynamically calculates
mixing and the stratification depth of inflowing groundwater. It is therefore appropriate for the
simulation of a changing lake over much longer timescales than before. The main finding of
our simulation results is the fact that the currently observed density stratification and gas
profiles are compatible with a simulation, which is initiated with a completely homogeneous
and gas-free lake around 2000 years ago. This result confirms that the groundwater sources are
the main driver of today’s stratification and gas profiles.
Zusammenfassung
Der Kivusee ist ein tiefer, meromiktischer See im ostafrikanischen Graben, der auf der Grenze zwischen Ruanda und der Demokratischen Republik Kongo (DR Kongo) liegt. Er ist weltweit bekannt für sein enormes Vorkommen an Kohlendioxid und Methan, das gelöst im stabil geschichteten Tiefenwasser lagert. Der Grund für dieses ungewöhnliche Gasvorkommen ist der Zufluss von warmem, salz- und kohlendioxidreichem und daher dichtem Grundwasser direkt ins Tiefenwasser des Kivusees. Dieser Zufluss von dichtem Grundwasser sorgt für eine sehr stabile Dichteschichtung, die turbulente Mischung verhindert und den vertikalen Transport von Kohlendioxid und vornehmlich biologisch produziertem Methan praktisch unterbindet. Für die angrenzenden Länder und deren Bevölkerung ist das Gasvorkommen ein potentielles Risiko.
Auch wenn der Gasdruck im See momentan noch weit von der Sättigung entfernt ist (unterhalb von 55 %), könnte ein ausserordentliches Mischereignis gasreiches Tiefenwasser an die Oberfläche bringen. Durch den fehlenden Wasserdruck an der Oberfläche würde ein grosser Teil der Gase entweichen und könnte für die in der Nähe des Sees lebenden Menschen und Tiere den Erstickungstod bedeuten. Im Gegensatz zur potentiellen Gefahr durch Ausgasen ist das Methanvorkommen aber auch eine wertvolle Energieressource für Ruanda und DR Kongo.
Im Jahr 2003 deuteten Gasmessungen darauf hin, dass die Methankonzentrationen im Tiefenwasser des Kivusees innerhalb von 30 Jahren um ungefähr 15 % angestiegen waren. Da die Aufenthaltszeit des Tiefenwassers im Kivusee bei 800 bis 1000 Jahren liegt, kann ein solcher Anstieg innerhalb eines Jahrhunderts zu gefährlich hohen Gaskonzentrationen führen.
Dieser schnelle Anstieg hat die Themen der vorliegenden Dissertation stark beeinflusst. Erstens gibt es trotz des starken Methananstiegs seit 2003 keine neuen verlässlichen Gasmessungen im Kivusee. Und zweitens geht das eindimensionale Computermodell, das zum Simulieren der Veränderungen der Dichteschichtung und der Gaskonzentrationen im Kivusee angewandt wird, davon aus, dass sich die Gaskonzentrationen im Kivusee nahezu im Gleichgewicht befinden.
Dieses Modell ist darum nicht gut geeignet, um längerfristige Szenarien mit schnell ansteigenden Methankonzentrationen (durch natürliche Produktion oder künstliche Gasextraktion) zu simulieren.
Im ersten Teil dieser Dissertation haben wir ein Messsystem entwickelt, das mittels Massen-
spektrometrie im Wasser gelöste Gase misst, ohne dass die Proben dabei Gas verlieren. Im
Rahmen einer Vergleichsstudie mit zwei anderen Forschungsgruppen haben wir dieses
Messsystem erfolgreich für die Bestimmung der Kohlendioxid- und Methankonzentrationen im
See verwendet. Unsere Resultate legen nahe, dass die Gaskonzentrationen seit mindestens 1974 nicht messbar angestiegen sind und deshalb heute keine erhöhte Gefahr durch Ausgasen besteht. Neben Kohlendioxid und Methan haben wir auch die Konzentrationen von gelösten Edelgasen mittels einer an gasreiches Wasser angepassten Methode zur in-situ Probenahme bestimmt. Unsere Messungen im Tiefenwasser zeigen, dass die atmosphärischen Edelgase Neon und Krypton und das atmosphärische Argon-Isotop 36 Ar im Vergleich zu luftgesättigtem Wasser zu ungefähr 50 – 70 % abgereichert sind. Die wahrscheinlichste Erklärung für diese unübliche Edelgas-Abreicherung ist nicht Ausgasen im See, sondern dass die magmatisch beeinflussten Grundwasserzuflüsse im Tiefenwasser ebenfalls abgereichert sind an Edelgasen.
Der Einfluss von magmatischen Fluiden im Kivusee wird durch die erhöhten Edelgas- Isotopenverhältnisse 3 He/ 4 He and 40 Ar/ 36 Ar erhärtet.
Im zweiten Teil der Dissertation haben wir ein neues eindimensionales Computermodell für
den Kivusee entwickelt und kalibriert. Im Gegensatz zum vorherigen Modell werden
Mischungsprozesse und die Einschichttiefe von Grundwasserquellen dynamisch berechnet. Das
neue Modell ist deshalb gut geeignet, um Simulationen eines sich verändernden Sees über lange
Zeitskalen zu rechnen. Unsere Simulationsresultate zeigen, dass die momentan beobachtete
Dichteschichtung und die Profile der Gaskonzentrationen kompatibel sind mit einer Simulation,
die mit einem komplett homogenen und gasfreien See vor 2000 Jahren beginnt. Dieses Ergebnis
bestätigt, dass die heutige Schichtung und Gasprofile ein Resultat der seit langer Zeit aktiven
Grundwasserquellen im Kivusee sind.
General Introduction
Lake Kivu
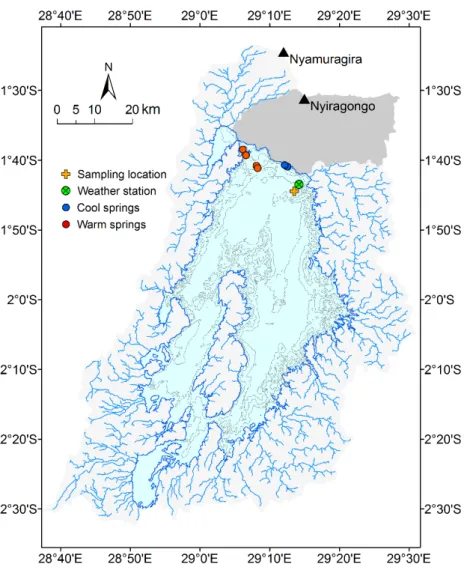
Lake Kivu is a large (2386 km 2 ) and deep (485 m) lake on the border between Rwanda and the Democratic Republic of the Congo (DRC) in Central-East-Africa, right at the feet of the Virunga volcano chain (Figure 1.1). It is famous worldwide for high carbon dioxide (CO 2 ) and methane (CH 4 ) concentrations of up to ~100 and ~20 mmol L -1 in the permanently stratified deep waters (Tietze, 1978; Schmid et al., 2005; Bärenbold et al., 2020a). The high gas concentrations can only be maintained due to the hydrostatic pressure and the strong density stratification, which prevents seasonal mixing in the deep waters.
Figure 1.1. Map of Lake Kivu with contour lines every 100 m and tributaries. The region near to the Nyiragongo
volcano does not have surface tributaries, but instead rainwater infiltrates and feeds groundwater aquifers. The
inflow locations of cool and warm springs are indicated according to Ross et al., 2015a.
Geographically, Lake Kivu is part of the Western Branch of the East-African Rift System (EARS), which started to develop ~12 Mio. years BP (Chorowicz, 2005). After having a much lower lake level (~300 m below current level) and draining to the north into Lake Edward for a long time (Wood and Scholz, 2017), Lake Kivu underwent major changes ~10 - 12 ka BP.
These changes include the blocking of its northern outflow by the Virunga volcano chain, and a lake level rise due to a wetter climate (Wood and Scholz, 2017) with subsequent drainage via the Ruzizi River to the south into Lake Tanganyika (Felton et al., 2007). It is believed that since
~3 ka BP, hydrothermal groundwater is entering the lake (Votava et al., 2017), and providing warm, saline and CO 2 -rich water (Ross et al., 2015a), which subsequently stratifies close to the bottom of the lake. In addition to the hydrothermal groundwater, Ross et al. (2015a) also discovered two cooler, less saline sources in the upper part of the lake at ~100 – 190 and 250 m, respectively. The existence of hydrothermal springs, along with cooler sources at ~180 and
~250 m was already proposed before by Schmid et al., 2005 based on numerical modelling.
Lake Kivu’s enormous gas reservoir is a direct consequence of the inflowing hydrothermal groundwater because the groundwater i) provides CO 2 , and ii) maintains the density stratify- cation, which prevents seasonal mixing below a depth of ~60 m. This situation leads to very long residence times in the deep water (800 – 1000 years according to Schmid et al., 2005).
Because of the long residence time, CO 2 and mainly biologically produced CH 4 can accumulate in the deep water of Lake Kivu either until they reach a steady-state between inflow, production and upward transport, or until an unusually deep mixing takes place and releases the gases to the atmosphere. Such gas eruptions have happened in the past at gas-rich lakes Nyos (Kling et al., 1987) and Monoun (Sigurdsson et al., 1987) with 1746 and 37 casualties due to asphyxiation, respectively. Sediment cores from Lake Kivu show that deep mixing events have happened several times in the last 3 ka, with the latest event around 1000 years ago (Ross et al., 2015b; Votava et al., 2017; Uveges et al., 2020). In addition, up to 9 smaller mixing events are believed to have happened during the last 2000 years (R. Hecky, pers. comm.).
Besides representing a potential risk, the CH 4 reservoir in Lake Kivu is a valuable resource for the neighboring countries Rwanda and DRC. Since 2015, the first large-scale methane extraction plant is in operation. “KivuWatt Limited”, which is a subsidiary of the US-based company ContourGlobal, draws water from 350 m, extracts the CH 4 in a degassing chamber just below the lake surface, and reinjects the almost CH 4 -free water at 240 m. The cleaned CH 4
gas is subsequently used to provide 26 MW of electricity to the Rwandan grid. According to
projections, several hundreds of MW could be installed in the future (Expert Working Group
on Lake Kivu Gas Extraction, 2009) or alternatively extracted gas could be used as cooking
fuel. Such artificial gas extraction is not only beneficial for the surrounding countries, but also reduces the risk of a gas eruption because CH 4 , due to its low solubility, accounts for ~80 % of total gas pressure in Lake Kivu.
Origin, transport and fate of gases in Lake Kivu
In contrast to the mostly geogenic origin of CO 2 in Lake Kivu, the analysis of 14 C-CH 4 by both Schoell et al. (1988) and Pasche et al. (2011) indicates that below 250 m, only ~66 % of the CH 4 is composed of old 14 C-dead carbon. Both authors suggest that the remaining ~33 % are produced by microbial degradation of settled organic matter at the sediment-water interface.
Pasche et al. (2011) further argue that part of the substrate for CO 2 reduction consists of H 2 , which is provided by the degradation of organic matter. As a consequence, the decomposition of organic matter can be indirectly responsible for an additional ~17 % of CH 4 production. So in total, Pasche et al. (2011) attribute ~50 % of CH 4 to the degradation of organic matter. The remaining 50 % could either be due to CO 2 reduction using geogenic CO 2 (and an unknown source of H 2 ), or the input of geogenic CH 4 by the hydrothermal groundwater sources. Above 250 m (i.e. above the main gradient), Pasche et al. (2011) found that the isotopic composition of CH 4 can be well explained by attributing all CH 4 production to the decomposition of organic matter. The different origin of CH 4 below and above 250 m is a result of the major groundwater source at ~250 m, which strongly dilutes the upwelling hydrothermal water
Due to the completely anoxic and sulphate-free deep water, there is no known process which could consume CH 4 below ~60 m. Thus, the only known sink of CH 4 in Lake Kivu is microbial oxidation at the oxycline, the depth of which varies seasonally between 20 and 60 m (Morana et al., 2015). As a result of microbial oxidation, only a small fraction of upward transported CH 4 can reach the atmosphere (Borges et al., 2011). In contrast, CO 2 has a possible deep water sink due to microbial reduction to CH 4 using H 2 . However, this consumption of CO 2 would be small because CO 2 is around five times more abundant than CH 4 and only part of the CH 4 can be produced from geogenic CO 2 (Pasche et al., 2011).
While the origin and fate of CO 2 and CH 4 in Lake Kivu differ, they are affected by the same
diffusive and advective transport processes. Diffusive mixing in Lake Kivu is a strong function
of depth as only the top 30 – 60 m are usually affected by seasonal mixing (Figure 1.2). Below
the seasonally mixed layer, the strong vertical density gradient suppresses wind induced
turbulent mixing. Consequently, vertical mixing is much slower than horizontal mixing, and
Lake Kivu can be assumed to be horizontally mixed, as evidenced by well-matching tempe- rature and salinity profiles in different parts of Lake Kivu (Ross et al., 2015a).
In the near absence of wind-induced mixing below ~60 m, two other mechanisms are mainly responsible for the vertical transport of gases, heat and salts in Lake Kivu. Firstly, there is a slow, depth-dependent upwelling of the whole water column due to the inflow of groundwater.
In total, these groundwater inflows provide around 40 % (41 m 3 s -1 ) of the total inflow into Lake Kivu (Schmid & Wüest, 2012) with the rest stemming from small surface tributaries (Muvundja et al., 2014). Around 90 % of the groundwater enters the lake as cool and fresh water at ~190 and ~250 m, while the hydrothermal groundwater contributes only 10 % to the total ground- water inflow (Schmid et al., 2005). The resulting magnitude of the upwelling is estimated to be between 0.15 and 0.8 m yr -1 , depending on lake depth (Pasche et al., 2009).
Figure 1.2. Schematic overview of advective and diffusive transport processes in Lake Kivu. The temperature and salinity profiles are the background profiles from Lake Kivu measured by Ross et al., 2015a.
Secondly, Lake Kivu exhibits a peculiar feature below 120 m down to its maximum depth of
485 m. More than 300 small mixed layers with an average thickness of ~70 cm and sharp, thin
gradients in between form a staircase-like structure (Newman, 1976; Schmid et al., 2010;
Sommer et al., 2013). This phenomenon is commonly referred to as diffusive-type of double diffusive convection, and it is caused by the concurrent increase with depth of temperature on the one hand, and dissolved substances (salinity and gases) on the other hand. Temperature and dissolved substances have a contrary effect on density and a very different molecular diffusion coefficient, which is a prerequisite for the presence of the diffusive-type of double diffusion (see Kelley et al., 2003 or Wüest et al., 2012 for a review). Vertical transport through double diffusive staircases is governed by molecular diffusion across the thin interfaces (Sommer et al., 2013), and therefore, the transport of heat is much faster than the transport of salinity and gases, whose molecular diffusivities are around two orders of magnitude lower. In order to compare the effect of double diffusion on temperature, salinity and gases, we can introduce the concept of apparent diffusivity, which is the flux of an agent divided by its background gradient (i.e. smoothing out the staircases). For Lake Kivu, Sommer et al., 2019 calculated that the apparent vertical diffusivity of temperature is on average ~30 times larger than the apparent diffusivity of salinity. This results in a situation where the vertical transport of temperature is governed by both double diffusive convection and advection, while the transport of salinity, CO 2 and CH 4 is largely dominated by advection.
Between the seasonally mixed layer above 60 m and the double-diffusive region below 120 m, there is a depth region which is neither affected by seasonal mixing, nor by double-diffusive convection (Figure 1.2). In this depth region, diffusive transport is assumed to be weak as a result of the strong density gradient (Schmid et al. 2005). However, the analysis of stable water isotopes 2 H and 18 O by Ross et al. (2015a) indicated that mixing might be stronger than previously thought. In fact, the latter observed evaporative isotope signals penetrating deep into Lake Kivu, thereby exhibiting a seemingly smooth, mixing-induced decrease with depth. To date, there is no quantitative analysis of turbulent diffusion in this depth region.
Evolution of gas concentrations
The precise quantification of gas concentrations and gas saturation is an important measure to
assess the risk of a potential gas eruption at Lake Kivu. Gas saturation is the ratio between
dissolved gas pressure and local absolute pressure (hydrostatic and atmospheric pressure). It
determines by how much a water parcel can be lifted without creating bubbles and potentially
trigger a gas eruption. However, measuring gas concentrations in Lake Kivu is challenging
because the high dissolved gas pressure leads to the loss of most of the gas content from water samples at atmospheric pressure.
Several researchers have attempted to assess gas concentrations in Lake Kivu in the past with variable success. In 1935, Damas measured CO 2 and H 2 S in samples after they degassed under atmospheric conditions. He therefore lost more than half of the CO 2 originally contained in the sample water (Damas, 1938). Between 1952 and 1954, Schmitz and Kufferath performed the first CH 4 measurements in Lake Kivu. However, they only quantified the fraction of CH 4 and CO 2 , which outgassed under atmospheric conditions. While neglecting the gas fraction remaining in the sample water gave accurate results for the insoluble CH 4 , the more soluble CO 2 was strongly underestimated (Schmitz and Kufferath, 1955). In 1974, K. Tietze used a sophisticated method to measure both CH 4 and CO 2 in the gas and the water phase of water samples and produced reliable and complete gas profiles (Tietze, 1978).
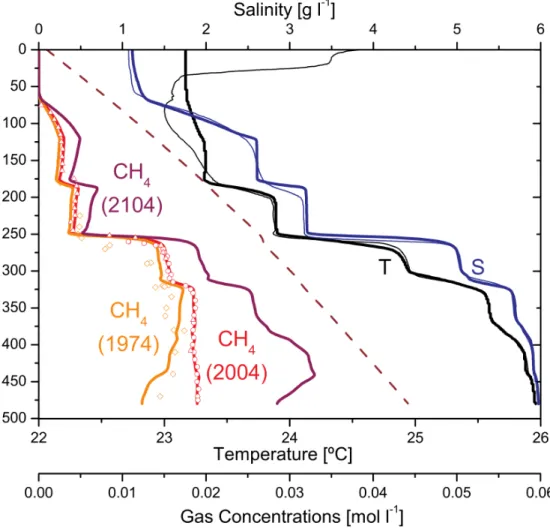
Figure 1.3. This Figure is reproduced from Schmid et al., 2005 and shows modelled CH
4concentrations in 1974, 2004 and 2104 (thick lines) based on the trend calculated from the difference between the measurements by Tietze in 1974 (orange symbols, Tietze, 1978) and Halbwachs & Tochon in 2003/04 (red symbols, Schmid et al., 2005).
Based on these measurements and modelling results, Schmid et al., 2005 suggested that CH
4concentrations are
increasing and that the inflow of hydrothermal groundwater is responsible for the warm and saline water below
250 m. (Schmid et al., 2005, Weak mixing in Lake Kivu: New insights indicate increasing risk of uncontrolled gas
eruption, Geochemistry, Geophysics & Geosystems, Copyright 2005 by the American Geophysical Union).
From the first measurements in 1935 (Damas, 1938) to the data of Tietze in 1974 there was no clear temporal trend in observed gas concentrations. In 2003 however, the measurements of M.
Halbwachs & J.-C. Tochon (published in Schmid et al., 2005) indicated that CH 4 concentrations had increased by ~15 % in the deep water within 30 years (i.e. since the measurements of Tietze in 1974, see Figure 1.3).
Numerical modelling
In view of increasing CH 4 concentrations (Schmid et al., 2005) and increasing temperature (summarized in Sommer et al., 2019), Schmid et al., 2005 developed a one-dimensional lake model for Lake Kivu using the software Aquasim (Reichert et al., 1994) to predict the future evolution of Lake Kivu’s density stratification and gas concentrations. They found that if the observed trend from 1974 (Tietze, 1978) to 2003 continues, gas pressure could approach satu- ration at some depths within the 21 st century (Schmid et al., 2005). The model was later ex- tended and used to assess the future evolution of gas concentrations and nutrient availability as a function of different gas extraction scenarios (Wüest et al., 2009; Schmid et al., 2019).
However, this model has several deficiencies, namely that i) turbulent mixing is fixed to constant values above 120 m and therefore does not adjust as a function of a changing density stratification in the lake, ii) vertical transport across the double diffusive staircases is parameterized based on data which underestimate the heat flux by a factor of 2 – 20 (Sommer et al., 2019), and iii) the groundwater inflows enter the lake at fixed depths instead of stratifying as a function of density.
Because of these simplifying assumptions, the model is not suitable for simulations with poten-
tially large changes in lake stratification and gas concentrations over longer timescales. In view
of a naturally changing lake and large-scale gas extraction projects, the need arises for a model
which is able to simulate the future long-term evolution of Lake Kivu in potentially changing
conditions. The most important requirements for such a model are that i) diffusive mixing is
dynamically calculated over the whole depth range and ii) the stratification depth of inflowing
groundwater is calculated as a function of density.
Outline and objectives of this dissertation
Since the measurements of Halbwachs & Tochon in 2003 (published in Schmid et al., 2005), which suggested a yearly increase of CH 4 concentrations of ~0.5 %, no reliable gas measure- ments have been performed. Therefore, one major objective of this dissertation was to produce a precise and reliable dataset of gas measurements in Lake Kivu (chapter 2). For this goal, we used the mobile mass spectrometer “MiniRuedi”, which was recently developed at Eawag. The
“MiniRuedi” allows the simultaneous quantification of several gases, and therefore, besides CH 4 and CO 2 , we tried to quantify noble gas concentrations in Lake Kivu. Noble gases can shed light on gas and water transport processes, but existing noble gas data in Lake Kivu (Tassi et al., 2009) seems to be affected by sampling artefacts, e.g. the addition of air as indicated by the reported oversaturation of oxygen, nitrogen and argon, which appear highly unlikely for the anoxic deep water of Lake Kivu. To verify the noble gas data from the “MiniRuedi”, we used an established noble gas measurement technique with copper tubes to store sample water for subsequent analysis in the noble gas laboratory at ETH (Beyerle et al. 2000). We adapted this measurement technique to the special, gas-rich conditions in Lake Kivu, where water samples need to be preserved under pressure to avoid gas loss during sampling. The results of this study are presented and discussed in chapter 3.
In the second part of this dissertation, we propose a new modelling approach using the one- dimensional k-ε model Simstrat (Goudsmit et al., 2002). In a k-ε model, the turbulent energy k and its dissipation rate ε are modelled explicitly as state variables, which allows the dynamic calculation of turbulent mixing, based on the current physical lake properties. As a part of this dissertation, Simstrat was coupled to the biogeochemical library AED2 in order to enable the simulation of dissolved gases and nutrients. The Simstrat-AED2 model has the following advantages over the model developed by Schmid et al., 2005: i) turbulent mixing is dynamically calculated above 120 m using meteorological data and Simstrat’s k-ε turbulence closure; ii) vertical transport across the double diffusive staircases is parameterized using updated measurements (Sommer et al., 2013) and iii) the groundwater inflows are allowed to plunge/rise as a function of their density in relation to that of the surrounding lake water. In chapter 4, we present this model and we use it to shed light on the properties and origin of the groundwater sources. In addition, we perform long-term simulations to find out, whether the currently ob- served profiles can be reproduced starting with a completely homogeneous and degassed lake.
This leads to the following structure of the thesis:
Chapter 2: No increasing risk of a limnic eruption at Lake Kivu: intercomparison study reveals gas concentrations close to steady state
In this chapter, we present our CO 2 and CH 4 measurements, along with the measurements of two other research teams (Helmholtz Centre for Environmental Research - UFZ and the Centre national de la recherche scientifique - CNRS). Eawag separated the gas and water phase of continuously flowing sample water in order to analyze the gas content of both phases using a mobile mass spectrometer. UFZ took in-situ water samples using gas-tight bags, filled by a small pump with a remote control. The bags were later analyzed using gas chromatography. In addition, UFZ also recorded in-situ gas pressure measurements. Finally, CNRS used a prototype in-situ laser spectrometer to measure CH 4 partial pressure in the top 150 m. To compare concen- trations to partial pressure, we developed a conversion method, which is suitable to the gas- rich, high-pressure environment in Lake Kivu. Our results show a good agreement between the different measurement techniques (within 5 – 10 %). However, in contrast to the measurements of Halbwachs & Tochon (in Schmid et al., 2005) we did not observe an increase in CH 4
concentrations, and we conclude that the gas concentrations in Lake Kivu are currently close to a steady-state. This chapter has been published in PlosOne (Bärenbold et al., 2020a) and the results of this study have also been published in a technical report to the Rwandan government (Schmid et al., 2019).
Chapter 3: Missing atmospheric noble gases in a large, tropical lake: the case of Lake Kivu, East-Africa
Here, we present depth profiles of noble gases He, Ne, 36 Ar and Kr, as well as isotope ratios
3 He/ 4 He, 20 Ne/ 22 Ne and 40 Ar/ 36 Ar. This dataset was collected by adjusting an existing measure- ment technique to analyze water samples in copper tubes (Beyerle et al., 2000) to work under the challenging conditions in Lake Kivu. Our results show that the atmospheric noble gases Ne,
36 Ar and Kr are depleted by 50 – 70 % in Lake Kivu’s deep water below 250 m. In addition, the elevated noble gas ratios 3 He/ 4 He and 40 Ar/ 36 Ar indicate the presence of magmatic gases.
We developed three scenarios to explain the observed noble gas depletions in the lake. Among
these, significant continuous outgassing is excluded based on the absence of a fractionation
pattern in the 20 Ne/ 22 Ne depth profile. In contrast, the good correlation between the increase of
salinity and He concentration with depth, and the simultaneous decrease of atmospheric noble
gas concentrations suggest that these patterns are caused by the same mechanism. We con-
cluded that noble gas concentrations in the hydrothermal groundwater sources feeding Lake
Kivu are likely depleted. This chapter has been published in Chemical Geology (Bärenbold et al., 2020b).
Chapter 4: Dynamic modelling gives new insights into development and maintenance of Lake Kivu’s density structure
In this chapter, we present results from long-term simulations of Lake Kivu using a newly deve- loped one-dimensional model. The model was calibrated using existing salinity and temperature data, and the vertical diffusive transport across double diffusive staircases was parameterized based on microscale measurements of temperature and salinity from Sommer et al. (2013). The properties (i.e. discharge, inflow depth, temperature, salinity and gas concentrations) of the groundwater inflows were calibrated manually with the goal of deriving a steady-state simulation which reproduces today’s observations. The model was forced by meteorological data from the regional climate model MiroC5, which was adjusted to Lake Kivu using a time series of 7 years from a local weather station. We successfully produced a steady-state model, which agrees very well with currently observed salinity and gas concentrations and fairly well for temperature. Furthermore, using 3 H tracer data, we could show that the cooler groundwater sources, which enter the lake at ~190 and 250 m are probably a mixture of old, hydrothermal groundwater and recently infiltrated rainwater. Finally, our long-term simulations suggest that the current profiles can be reproduced starting from a homogeneous, degassed lake ~1500 – 2000 years ago. This chapter is in preparation for a submission in Journal of Geophysical Research Biogeosciences.
In chapter 5, we provide a short synthesis of the main findings of chapters 2 to 4. In addition,
we suggest future applications of our model and further research directions.
Chapter 2
No increasing risk of a limnic eruption at Lake Kivu: intercomparison study reveals gas concentrations close to steady state
Fabian Bärenbold
1*, Bertram Boehrer
2, Roberto Grilli
3, Ange Mugisha
4, Wolf von Tümpling
2, Augusta Umutoni
4, Martin Schmid
11
Eawag, Swiss Federal Institute of Aquatic Science and Technology, Surface Waters - Research and Management, Kastanienbaum, Switzerland
2
Helmholtz-Centre for Environmental Research – UFZ, Magdeburg, Germany
3
CNRS, Université Grenoble Alpes, IRD, Grenoble INP, Institut des Géosciences de l’environnement, Grenoble, France
4
Lake Kivu Monitoring Programme LKMP, Gisenyi, Rwanda
*Corresponding author:
Email: fabian.baerenbold@eawag.ch
This chapter has been published as:
Bärenbold, F., Boehrer, B., Grilli, R., Mugisha, A., von Tümpling, W., Umutoni, A., & Schmid, M. (2020). No
increasing risk of a limnic eruption at Lake Kivu: Intercomparison study reveals gas concentrations close to
steady state. PloS one, 15(8), e0237836. https://doi.org/10.1371/journal.pone.0237836
Abstract
Lake Kivu, East Africa, is well known for its huge reservoir of dissolved methane (CH 4 ) and carbon dioxide (CO 2 ) in the stratified deep waters (below 250 m). The methane concentrations of up to ~ 20 mmol/l are sufficiently high for commercial gas extraction and power production.
In view of the projected extraction capacity of up to several hundred MW in the next decades,
reliable and accurate gas measurement techniques are required to closely monitor the evolution
of gas concentrations. For this purpose, an intercomparison campaign for dissolved gas
measurements was planned and conducted in March 2018. The applied measurement techniques
included on-site mass spectrometry of continuously pumped sample water, gas chromatography
of in-situ filled gas bags, an in-situ membrane inlet laser spectrometer sensor and a prototype
sensor for total dissolved gas pressure (TDGP). We present the results of three datasets for CH 4 ,
two for CO 2 and one for TDGP. The resulting methane profiles show a good agreement within
a range of around 5 – 10% in the deep water. We also observe that TDGP measurements in the
deep waters are systematically around 5 to 10 % lower than TDGP computed from gas
concentrations. Part of this difference may be attributed to the non-trivial conversion of
concentration to partial pressure in gas-rich Lake Kivu. When comparing our data to past
measurements, we cannot verify the previously suggested increase in methane concentrations
since 1974. We therefore conclude that the methane and carbon dioxide concentrations in Lake
Kivu are currently close to a steady state.
Introduction
Lake Kivu, with a surface area of 2386 km 2 and a maximum depth of 485 m, is situated on the border between Rwanda and the Democratic Republic of the Congo (DRC). Along with other African great lakes Tanganyika and Malawi, Lake Kivu is part of the East African Rift System (EARS). To the north, Lake Kivu borders on the Virunga volcano chain, while to the South it drains into Lake Tanganyika via the Ruzizi River. Lake Kivu is fed by numerous small streams (Muvundja et al., 2014) and by subaquatic groundwater sources (Ross et al., 2015a) with the latter contributing about 45 % of the total inflow. The groundwater sources mainly enter the lake at the northern shore and can be divided into two categories: two cool and fresh sources above a depth of 260 m and several warm, saline and carbon dioxide (CO 2 )-rich sources below 260 m. This has two main consequences, namely a very stable density stratification due to the salinity gradient, which prevents annual mixing below a depth of 50 to 60 m and the accumulation of dissolved CO 2 over long time scales. In addition to CO 2 , biogenic methane (CH 4 ) is present in the deep waters in large amounts due to decomposition of organic matter at the lake bottom and CO 2 reduction (Schoell et al., 1988; Pasche et al., 2011).
Gas concentrations in Lake Kivu were first recorded by Damas in 1935 (Damas, 1938) who measured CO 2 and H 2 S. However, Damas only analyzed the sample water after degassing, thus losing more than half of the CO 2 to the atmosphere. Between 1952 and 1954, Schmitz and Kufferath carried out the first CH 4 measurements and additionally determined CO 2 concen- trations. However, they only analyzed the gas that outgassed under atmospheric conditions, neglecting the gas remaining dissolved in the water (Schmitz & Kufferath, 1955). In 1974, Tietze performed the first comprehensive survey of dissolved gas concentrations, including CH 4 and CO 2 from both the gas exsolved under atmospheric conditions and the remaining part in the sample water (Tietze, 1978). Tietze concluded that about 300 km 3 STP (gas volume at 0°C and 1 atm) of CO 2 and 60 km 3 STP of CH 4 were stored in the permanently stratified deep waters (below ~ 60 m) of Lake Kivu (Tietze, 1978). Subsequently, based on new measurements from M. Halbwachs and J.-C. Tochon in 2003 (published in Schmid et al., 2005), Schmid et al.
(2005) suggested that CH 4 concentrations had increased by 15 % since 1974 and that they could
possibly reach saturation within the 21 st century. With the examples of deadly limnic eruptions
due to high gas loads in Lakes Nyos (Kling et al., 1987) and Monoun (Sigurdsson et al., 1987),
it was clear that the gas concentrations of Lake Kivu needed to be monitored. Besides the threat
to the local population, the gas content in Lake Kivu also represents a valuable resource: In
December 2015, a 26 MW gas power plant was connected to the Rwandan grid and several
hundred MW could follow according to projections (Expert Working Group on Lake Kivu Extraction, 2009).
In 2017, a gas intercomparison campaign was initiated by the Lake Kivu Monitoring Programme (LKMP) with the goal of 1) accurately determining CH 4 and CO 2 concentrations using different methodologies and 2) finding an appropriate technique to regularly monitor the gas concentrations in the future. However, gas sampling in highly outgassing environments is challenging and thus, the measurement methods had to be adapted accordingly. In this work, we describe the methodologies for three research teams involved in the campaign: The Swiss Federal Institute of Aquatic Science and Technology (Eawag), the Helmholtz Centre for Environmental Research (UFZ) and the National Center of Scientific Research in France (CNRS). Subsequently, we present the results of each group and compare them to the previous measurements of Tietze in 1974 (Tietze, 1978) and Halbwachs and Tochon in 2003 and Schmid in 2003 (both published in Schmid et al., 2005). Finally, we reevaluate the gas (CH 4 and CO 2 ) content in Lake Kivu and its potential change in time.
Materials and methods
The intercomparison campaign took place close to Gisenyi/Rubavu, Rwanda (1.74087°S / 29.22602°E) from 9 to 13 March 2018 and involved research teams from Eawag, UFZ, CNRS and from the power plant operator KivuWatt. Eawag prolonged its measurement period until 18 March and UFZ also included earlier measurements from 2017. The campaign was planned and organized by LKMP and therefore, no special permit was necessary to perform measure- ments on the lake. Further details on the results of the campaign can also be found in a report to LKMP (Schmid et al., 2019). Note that while the report includes the measurements of KivuWatt, the latter decided to not be part of this publication.
The measurements taken by each research team are summarized in Table 2.1. In this
publication, only the approach of Eawag is explained more comprehensively, while further
details on the methods of UFZ and CNRS can be found elsewhere (Boehrer et al., 2019; Grilli
et al., 2018). In the following, we will first present the methodology of Eawag and then shortly
summarize the approaches of UFZ and CNRS.
Table 2.1. Summary of gas measurements performed by the different research teams of Eawag, UFZ and CNRS.
CH
40 – 150 m
CH
4150 – 450 m
CO 2 TDGP
Eawag - + + -
UFZ - + + +
CNRS + - - -
The “+” indicates which measurements were performed by which groups.
Measurement method used by Eawag
The measurement setup was built around “MiniRuedi”, a gas-equilibrium portable membrane- inlet mass spectrometric system (GE-MIMS) which allows on-site quantification of different dissolved gases in water (i.e. N 2 , O 2 , CO 2 , CH 4 , He, Ar, see Brennwald et al., 2016). The continuous sampling water flow (~ 1 L/min) required to maintain gas equilibrium at the MS inlet was provided by a submersible pump (0.75 kW, Lechner Pumpen) and 250 m long, 6 mm inner diameter polyamide (PA) tubing. The pump was used only above 250 m and yielded a flow of ~ 1.6 L/min. Below 250 m, TDGP increases drastically and, following initiation of the flow by a suction pump at the surface, the buoyancy due to bubble formation within the tube was sufficient to lift the water to the surface. 10 mm PA tubing was used in this case and the resulting flow was ~ 1 L/min (except between 270 and 310 m where it was ~ 0.5 L/min only).
The water-gas mixture was subsequently dispersed through a nozzle into a custom-made
cylindrical equilibration chamber (12.3 cm diameter, 38 cm height, see Figure A1 in Appendix
A). While the degassed sample water accumulated and discharged at the bottom of the chamber,
the gas phase stayed above and left the chamber through a tube at the top. The gas content in
the gas phase and the water phase (via a headspace created by the membrane contactor Liqui-
Cel G542, 260 cm 3 external volume) was analyzed by the “MiniRuedi”. Finally, gas and water
flow rates were recorded to compute in-situ gas concentrations in the lake as sketched in Figure
A1 in Appendix A. The overall analytical accuracy (i.e. the maximum deviation from the true
value) of the setup was deduced from the accuracies of its individual components and estimated
to around ± 5 % for CO 2 and ± 10% for CH 4 in the deep water (see S1 Appendix for more
details). Measurements were done at a resolution of 20 m starting from 10 m depth down to
450 m (430 m was omitted due to time constraints). Between 90 and 130 m, the gas flow was
too low to be quantified but still substantial enough to have an effect on gas results. Therefore, results for this depth range are not reported.
The mass spectrometer was calibrated using two gas standards (80 % CO 2 + 20 % CH 4 and 60 % CO 2 + 30 % CH 4 + 10 % air) with partial pressures similar to the average gas compo- sition of water gassing out from Lake Kivu deep water. One of the gas standards additionally contained atmospheric air for potential calibration of N 2 and O 2 . However, in the special setting of Lake Kivu, the determination of N 2 at mass/charge = 28 proved to be difficult because of the presence of a large peak of CO from the fragmentation of CO 2 during ionization in the mass spectrometer. The interference of the CO fragment accounted for more than 95 % of the intensity at mass 28. Therefore N 2 could not be determined reliably and hence was not included in this publication.
Measurement method used by UFZ
The measurement method used by UFZ had previously been used in highly gas charged mine pit lakes (for CO 2 see Boehrer et al., 2016, for CH 4 see Horn et al., 2017) and was modified for the conditions of Lake Kivu by Boehrer et al., 2019. Water was sampled using gas-tight bags, which were lowered to the appropriate depth together with a small pump and an automatic pump controller. The pump partially filled the bags while leaving enough space for the gas phase, which forms once the bags are retrieved. At the surface, the water and gas phases in the bags were equilibrated over night and the composition of the gas phase was analyzed using a gas chromatograph. Subsequently, the remaining amount of gas in the water phase was deduced by assuming equilibrium between gas and water phase. In order to compute in-situ gas concentrations, the gas and water volumes in the bag were determined using a syringe and a laboratory scale respectively. Total uncertainties for CH 4 (CO 2 ) concentrations were determined as ± 5 (± 6) % below and ± 7 (± 8) % above 250 m. Note again that these uncertainties should be interpreted as maximum deviation from the true value. The UFZ group also measured total dissolved gas pressure (TDGP) using a prototype probe from Pro Oceanus with an accuracy of ± 0.04 bar according to the manufacturer.
Measurement method used by CNRS
The measurement method applied by CNRS is fully described elsewhere (Grilli et al., 2018).
In short, an in-situ membrane-inlet laser spectrometer (MILS), called SubOcean, was deployed
for continuous dissolved CH 4 measurements. The instrument is based on a patented membrane extraction system (Triest et al., 2017) coupled to an optical spectrometer for trace gas sensing based on an optical feedback cavity enhanced absorption spectroscopy (OFCEAS) technique (Morville et al., 2003; Morville et al., 2014). The extraction system does not rely on gas equilibration across the membrane, but the dry side of the membrane is maintained at low pressure while continuously flushing it with dry zero air. This allows achieving fast response times < 30 sec, making the technique adapted for fast 3D mapping of water masses (Jansson et al., 2019). The accuracy (standard deviation at the three sigma level) of the measurements was quantified to be ± 33 % from repeated measurements at the same depth. Note that the uncertainty is given at the three sigma level, which we judge roughly equivalent to the concept of “maximum deviation from the true value” used for the other two methods. In addition to the CH 4 signal, this method needs external TDGP and dissolved CO 2 measurements in order to compute CH 4 partial pressure in the lake water, which is finally converted to concentrations using the conversion method presented below.
Conversion from concentration to partial pressure
Eawag and UFZ measured gas concentrations while the MILS sensor used by CNRS provided partial gas pressure. In order to compare these results, conversion from concentration to partial pressure and vice-versa is required. However, this conversion is not straightforward as the gas- water partition coefficients (Henry coefficients) depend on temperature, salinity and hydrostatic pressure (Weiss, 1974). In addition, the fugacity effect cannot be calculated separately for each gas since it depends on the relative mixture of the involved gas species (Ziabakhsh-Ganji &
Kooi, 2012). We thus express concentration C i as a function of partial pressure p i by the following equation:
= , , , (1)
with φ i the fugacity coefficient i.e. the ratio between the fugacity of a gas and its partial pressure at temperature T and pressure P, and K i the solubility coefficient, i.e. the ratio between the dissolved concentration of a gas and its fugacity. The solubility coefficient , is computed as a function of temperature and salinity according to Weiss (1974) for CO 2 , Wiesenburg &
Guinasso (1979) for CH 4 and Weiss (1970) for N 2 . The salinity terms of these equations were
originally derived for sea salt and not for Lake Kivu, where salinity is dominated by
bicarbonates. We accounted for this by assuming that the salinity effect mainly depends on the
ionic strength of the solution. More details about the salinity correction are provided in S2 Appendix.
According to Weiss (1974), the dependence of the solubility coefficient K i on local total pressure (hydrostatic plus atmospheric pressure) can be written as
, , = , . (2)
Here, R = 83.1446 cm 3 bar K −1 mol −1 is the gas constant, and v i are the partial molar volumes.
The partial molar volumes of CO 2 and N 2 were assumed constant at 32.3 cm 3 mol -1 (Weiss, 1974) and 35.7 cm 3 mol -1 (Moore et al., 1982) respectively, while for CH 4 it was calculated according to (Rettich et al., 1981).
The resulting pressure correction factors , , / , range between 1.00 at atmospheric pressure and 0.93 (CO 2 ) or 0.94 (CH 4 ) at 50 bar (485 m depth), i.e. the in-situ pressure reduces the solubility coefficient of the gases by 6 to 7 % in the lowest layers of Lake Kivu.
The fugacity coefficients , of CO 2 , CH 4 and N 2 , including the interaction between the gases, are computed according to Ziabakhsh-Ganji & Kooi (2012). (Octave scripts available in S3 Appendix).
Results and discussion
Eawag results
The resulting CH 4 and CO 2 concentrations using the Eawag mass spectrometer setup are depicted in Figure 2.1, along with temperature and salinity profiles. We can identify the well- mixed epilimnion with constant salinity (above ~ 60 m) and the main chemocline at ~ 255 m.
As expected, gas concentrations correlate well with salinity and temperature due to the common hydrothermal origin of CO 2 , dissolved solids and heat (Schmid et al., 2005). The detailed CH 4
and CO 2 results can be found in Table A1 of the supporting information.
Figure 2.1. Dissolved CH
4and CO
2concentrations measured in Lake Kivu by Eawag in 2018; salinity and temperature were determined using a CTD from Sea and Sun in 2017 and 2018 respectively. The conversion from conductivity to salinity was done according to Wüest et al. (1996) using ionic composition. Gas concentrations between 90 and 130 m could not be measured due to too high gas load for using a membrane contactor only, but not high enough for the use of our equilibration chamber.
Contamination with atmospheric air is a major source of measurement errors in gas content analysis. Thus, we use our O 2 results to estimate the maximum atmospheric contamination affecting our measurements in the completely anoxic deep waters of Lake Kivu. We find that the mixing ratio of O 2 in the sampled gas phase is always less than 1 % (maximum between 270 and 310 m due to lower water flow at these depths). Most likely, this O 2 signal indicates a small contamination with atmospheric air. However, it could stem from gas fragmentation during ionization in the mass spectrometer. Independently of its origin, the signal is small enough to not significantly affect the CH 4 and CO 2 results.
Intercomparison of CH 4 and CO 2 using past and new measurements
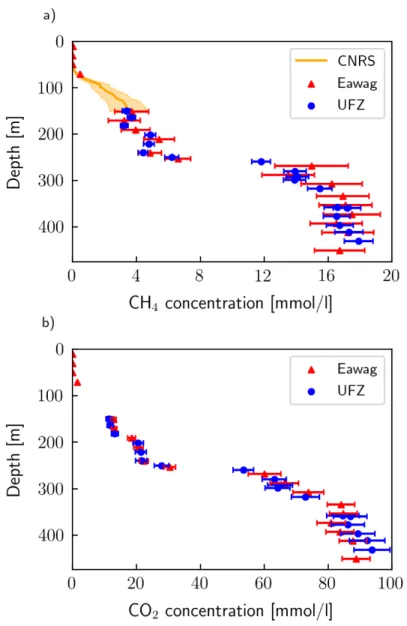
The results of the dissolved gas measurements (CH 4 and CO 2 ) of Eawag, UFZ (Boehrer et al.,
2019) and CNRS (Grilli et al., 2020) are shown in Figure 2.2. For both CH 4 and CO 2 , the
measurements agree well within the uncertainties of the different approaches. The profile from
Eawag shows higher CH 4 concentrations (up to 10 %) than UFZ between 250 and 350 m depth, whereas UFZ measured higher CH 4 and CO 2 concentrations (up to 5 %) below 400 m. In particular, the UFZ profile indicates further increasing CH 4 and CO 2 concentrations with depth below 400 m, while the Eawag profile levels off or even decreases. However, note that the comparison below 400 m is based on very few measurement points. The results of Eawag, UFZ and CNRS show a good agreement at their junction at 150 m, thus validating the conversion method under moderate hydrostatic pressure.
Figure 2.2. Comparison of CH
4and CO
2results from CNRS, Eawag and UFZ in 2018. Eawag and UFZ directly
determined gas concentration while CNRS measured quasi-continuous partial CH
4pressure, which was converted
to concentration using the conversion method presented above.
In order to estimate the total gas content in the lake, we need to derive quasi-continuous depth profiles for CH 4 and CO 2 from the measurements depicted in Figure 2.2. We chose to interpolate the discrete profiles by fitting them to an electric conductivity profile (corrected to 25°C), because i) conductivity is most probably closely related to gas concentrations due to the long residence time in the lake and because similar transport processes affect both dissolved solids and gases (Schmid & Wüest, 2012) and ii) it can be easily measured at a high resolution.
The following procedure was applied to derive high-resolution curves for the CH 4 and CO 2
concentrations measured by UFZ and Eawag: The conductivity profile from Figure 2.1 was extended down to 480 m depth using the background conductivity profile published by Ross et al. (2015a). The latter was corrected with the mean difference between both profiles in their lowest common 20 m. From this profile, we then extracted the conductivity values at the depths of the gas measurements of UFZ and Eawag. Then, a 6 th order polynomial function was fitted (R 2 > 0.995 for all four profiles) with conductivity as the independent and gas concentrations as the dependent variables. The regression was used to compute the gas concentration as a function of conductivity and to relate it to depth. The resulting curves are shown in Figure 2.3 (at 0.5 m resolution), along with previous CH 4 and CO 2 measurements. The uncertainties of the previous measurements were assumed to be ± 5 % for Tietze (Tietze, 1978), ± 4 % for Halbwachs and Tochon (Schmid et al., 2005), and ± 10% for Schmid (Schmid et al., 2005 and pers. comm. M. Schmid).
In general, previous and current measurements are in good agreement. For both CH 4 and CO 2 , the measurements of 1974 are at the lower end of the spectrum, and those of 2003 at the higher end. From this fact, Schmid et al. (2005) concluded that CH 4 concentrations had increased by 15 % from 1974 to 2003 and that they could possibly reach saturation within the 21 st century.
Pasche et al. (2011) later determined an upper bound for the CH 4 increase of around half this value based on carbon cycle analysis. However, our new measurements show no measurable increase of CH 4 (and CO 2 ) concentrations within the last 45 years. This implies that the measured differences were largely due to measurement uncertainty and that the CH 4 and CO 2
concentrations in the lake are currently close to a steady state.
Figure 2.3. Interpolated CH
4and CO
2concentrations from this work compared to previous measurements. CH
4and CO
2concentrations of Eawag and UFZ are interpolated by fitting the profiles to a conductivity profile; shaded areas represent the uncertainties. Selected previous gas measurements are shown for comparison (Tietze, 1978;
Schmid et al., 2005).
Risk assessment using total dissolved gas pressure (TDGP)
In order to assess the danger of a potential gas eruption associated with the high gas concen-
trations in Lake Kivu, it is helpful to look at gas pressure saturation within the lake. CH 4 and
CO 2 concentrations thus need to be converted to partial pressure using the conversion method
presented in the previous section. Besides CH 4 and CO 2 , dissolved nitrogen (N 2 ) is the only gas
present in sufficient amounts to influence gas pressure. As no N 2 data is available for Lake
Kivu, we estimated its contribution assuming that it mimics the profile of atmospheric noble
gases which show concentrations close to air saturated water (ASW) at the lake surface and a
decrease of ~50 % in the deep water (Bärenbold et al., 2020b). The derived N 2 profile was subsequently included in the conversion algorithm, which includes the effect of gas mixture between CH 4 , CO 2 and N 2 on the fugacity coefficients.
The accuracy of the calculated TDGP is estimated from the accuracies of the gas/water flow measurements and the CH 4 concentration in the gas phase. The contributions to the accuracy from CO 2 and N 2 are negligible in comparison to CH 4 because of the high solubility of CO 2 and low concentration of N 2 .
Figure 2.4 shows that calculated TDGP of Eawag and UFZ and direct TDGP measurements using the Pro Oceanus sensor are in good agreement, usually well within the uncertainties of the respective methods. Still, below 250m depth, TDGP calculated from Eawag and UFZ data is slightly higher than the measured TDGP. The mean difference between calculated and measured TDGP is 5.9 % (maximum of 8.7 % at 290 m) and 4.4 % (maximum of 8.8 % at 417 m) for Eawag and UFZ respectively. This discrepancy could be due to a bias in the conversion of concentrations to partial pressures, to an overestimation of concentrations by both Eawag and UFZ or to a problem of calibration of the TDGP sensor at high pressure.
Figure 2.4. Comparison of measured TDGP with TDGP calculated from gas concentrations. TDGP is calculated
from individual gas components (CH
4, CO
2and N
2) using the conversion algorithm presented in this work. The
concentration profile of N
2was derived assuming a similar depth profile as Neon (Bärenbold et al., 2020b) thus
not accounting for possible biological effects on N
2.
Gas concentrations are very high in the deep water of Lake Kivu. If this gas was released to the atmosphere, it would cause a large catastrophe by suffocating humans and animals in the surrounding area, qualitatively similar to the events at Lake Nyos in 1986 (Kling et al., 1987).
Currently, total dissolved gas pressure (TDGP) is well below absolute pressure (hydrostatic plus atmospheric pressure) at all depths in Lake Kivu. The maximum gas saturation in terms of pressure is reached at 320 m and amounts to ~ 50 % (or a maximum of 57 % if we take the upper limit of the uncertainty range of the Eawag data). This means that the gas concentrations are still far away from the point of spontaneous ebullition (i.e. close to 100% saturation).
Nevertheless, volcanic structures on the lake floor indicate frequent volcanic activity within the lake in the geologically recent past (Ross et al., 2015b). We cannot exclude that similar volcanic activity could trigger a gas eruption from the lake in the future, even though TDGP is far away from saturation. Therefore, in spite of no measurable increase of gas concentrations during the last 45 years, artificial degassing is still beneficial to reduce the danger of a potential natural disaster.
Update of Lake Kivu gas reserves
We estimated the gas content of Lake Kivu by multiplying our interpolated gas profiles (Figure
2.3) by the lake area at each depth and subsequent integration over the lake depth at a resolution
of 0.5 m. The lake areas were deduced from the bathymetry of Lake Kivu by K.A. Ross from
the blended bathymethric data of Ross et al. (2015b) and Lahmeyer & Osae (1998). Tables 2.2
and 2.3 show the gas content in different depth ranges for CH 4 and CO 2 respectively. The
average CH 4 estimate from the 2018 campaign shows slightly lower values in the resource zone
(7 %) and in the entire lake (4.5 %) than calculated from the data of Halbwachs and Tochon
2003 (published in Schmid et al., 2005). Similarly, the CO 2 content measured in 2018 is 6.5 %
lower in the resource zone and 3 % lower for the entire lake. We do not think that this apparent
decrease in gas concentrations since 2003 reflects the real gas dynamics in Lake Kivu because
i) the total CH 4 extracted by the existing power plant was less than 0.2 km 3 until March 2018
(Schmid et al., 2019) and therefore not measurable by current methods, ii) the residence time
of gases in the deep water is on the order of 1000 years (Wüest et al., 2012) and iii) to our
knowledge, there is no process that would consume either CO 2 or CH 4 under the conditions
present in the deep water of Lake Kivu (i.e. below 70 m, see Morana et al., 2015).
Table 2.2. CH
4content in Lake Kivu in km
3STP for different depth ranges.
Depth range [m] Eawag 2018 UFZ 2018 CNRS 2018 Average Halbwachs 2003
0 - 70 - - 0.1 ± 0.3 0.1
70 - 150 - - 6.5 ± 2.1 6.5
150 - 200 5.8 ± 1.6 5.7 ± 0.4 - 5.7
200 - 260 8.5 ± 1.3 8.2 ± 0.5 - 8.3 8.5
260 - 300 12.5 ± 1.7 12.1 ± 0.6 - 12.3
300 - 350 14.7 ± 1.6 13.8 ± 0.7 - 14.2
350 - 400 9.5 ± 0.9 9.4 ± 0.5 - 9.5
400 - 480 5.5 ± 0.5 5.7 ± 0.3 - 5.6
Resource zone (260 - 480) 42.2 ± 4.8 40.9 ± 2.0 - 41.5 44.7
Upper resource zone (260 - 310) 15.6 ± 2.1 15.0 ± 0.7 - 15.3
Lower resource zone (310 - 480) 26.6 ± 2.6 26.0 ± 1.3 - 26.3
Entire lake 62.2 65.1
The reference values (Halbwachs 2003) were calculated in Wüest et al. (2012) based on the data of M. Halbwachs and J.-C. Tochon in Schmid et al. (2005). The resource zones are defined as in (Expert Working Group on Lake Kivu Gas Extraction, 2009), but including half of the bordering gradients.
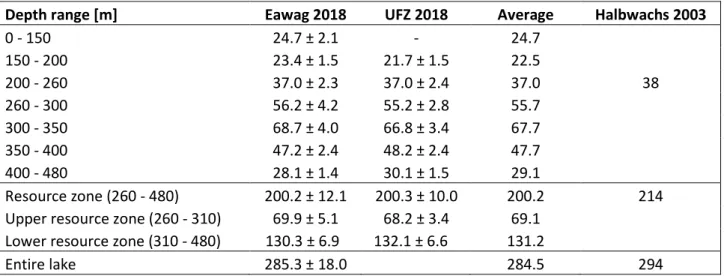
Table 2.3. CO
2content in Lake Kivu in km
3STP for different depth ranges.
Depth range [m] Eawag 2018 UFZ 2018 Average Halbwachs 2003
0 - 150 24.7 ± 2.1 - 24.7
150 - 200 23.4 ± 1.5 21.7 ± 1.5 22.5
200 - 260 37.0 ± 2.3 37.0 ± 2.4 37.0 38
260 - 300 56.2 ± 4.2 55.2 ± 2.8 55.7
300 - 350 68.7 ± 4.0 66.8 ± 3.4 67.7
350 - 400 47.2 ± 2.4 48.2 ± 2.4 47.7
400 - 480 28.1 ± 1.4 30.1 ± 1.5 29.1
Resource zone (260 - 480) 200.2 ± 12.1 200.3 ± 10.0 200.2 214 Upper resource zone (260 - 310) 69.9 ± 5.1 68.2 ± 3.4 69.1
Lower resource zone (310 - 480) 130.3 ± 6.9 132.1 ± 6.6 131.2
Entire lake 285.3 ± 18.0 284.5 294
The reference values (Halbwachs 2003) were calculated in Wüest et al. (2012) based on the data of M. Halbwachs and J.-C. Tochon in Schmid et al. (2005). The resource zones are defined as in (Expert Working Group on Lake Kivu Gas Extraction, 2009), but including half of the bordering gradients.
Schmid et al. (2005) suggested a CH 4 production rate of 120 g C/m 2 /year (grams of carbon in CH 4 per sediment area pear year) in order to explain the difference between the CH 4 profiles of K. Tietze in 1974 and M. Halbwachs and J.-C. Tochon in 2003. This rate would lead to a CH 4
increase of about 5 – 10 % since 2003 (i.e. 3 – 6 km 3 ) and thus can be excluded based on our
data. Similarly, we can rule out a production rate of 93 g C/m 2 /year in the deep water as
proposed by Pasche et al (2011). Based on our data from 2018, we suggest that the actual
production rate of CH 4 is probably close to the steady state rates of 32 and 35 g C/m 2 /year calculated by Schmid et al. (2005) and Pasche et al. (2011), respectively.
We conclude that the variability of gas concentrations measured in the last 45 years is due to the uncertainties of the applied methods. In contrast to previous work (Schmid et al., 2005), our data suggests that the lake gas content is currently close to a steady state with no or small net recharge rate. Consequently, the risk of a gas eruption does not seem to be increasing over time.
Additionally, our findings question whether the methane in Lake Kivu is replenished fast enough to be used as a long-term energy source, once the current methane storage has been exploited.
The CH 4 content amounts to around 41.5 km 3 STP in the resource zone (between 260 and 480 m) and 62.2 km 3 in the whole lake. Furthermore, the results of the two methodologies suitable for deep water gas analysis (Eawag and UFZ) agree within the expected accuracy of 5 – 10 % for both CH 4 and CO 2 . For regular gas monitoring in view of increased industrial gas extraction, the method of UFZ is easier to apply due to the use of relatively simple equipment. The prototype MILS sensor used by CNRS was able to record gas concentrations down to a depth of 150 m and provides the advantage of in-situ, fast and high-resolution data. However, the technique was not yet adapted to the high CH 4 concentration below 150 m in Lake Kivu. In addition, the sensor requires total dissolved gas pressure (TDGP) and dissolved CO 2 profiles to determine CH 4 partial pressure. The direct measurement of TDGP may be the most appropriate measurable quantity to monitor the risk of a spontaneous ebullition in the lake in the future. It also has the advantage of offering simple, reproducible and high-precision measurements for further monitoring purposes (see for example Sànchez-España et al., 2020).
Acknowledgements
Michael Plüss and Reto Britt for help with the development of sampling equipment and
fieldwork. Ivo Beck, Maximilian Schmidt (Heidelberg University) and the team of LKMP
(Lake Kivu Monitoring Programme), especially Epaphrodite Havugimana and Pierre Simbizi
for help with fieldwork. Matthias Brennwald for assistance with the “MiniRuedi” mass
spectrometer. Serge Robert and Patrick Kathriner for helpful discussions about gas
measurements. Nic Spycher (Lawrence Berkeley National Laboratory) for discussing and
reviewing the pressure-concentration conversion method and Zaman Ziabakhsh-Ganji (TU
Delft) for providing maple scripts for computing fugacity coefficients.
Supporting information in Appendix A
Table A1. Detailed results of Eawag measurement method.
Table A2. Temperature data from a Sea and Sun CTD.
Table A3. Salinity data computed using conductivity data.
Appendix A1. Detailed description of Eawag measurement method and calculations.
Appendix A2. Calculation of salinity effect of Lake Kivu dissolved solids.
Appendix A3. Octave scripts for conversion of concentration to partial pressure.
Chapter 3
Missing atmospheric noble gases in a large, tropical lake: The case of Lake Kivu, East Africa
Fabian Bärenbold
1*, Martin Schmid
1, Matthias S. Brennwald
2and Rolf Kipfer
2,31
Eawag, Swiss Federal Institute of Aquatic Science and Technology, Surface Waters - Research and Management, Kastanienbaum, Switzerland
2
Eawag, Swiss Federal Institute of Aquatic Science and Technology, Water Resources and Drinking Water, Dübendorf, Switzerland
3