Development of genetically encoded cell type-specific activity markers for the mouse olfactory system
I n a u g u r a l – D i s s e r t a t i o n
Zur
Erlangung des doktorgrades
Der Mathematisch-Naturwisssenschaftlichen Fakultät Der Universität zu Köln
Vorgelegt von
Sukumaran Sunil Kumar
Aus Cheramangalam Köln
2005
Köln, den 19. Juli, 2005
Keine Teilpublikationen
Berichterstatter Prof. Dr. Sigrun Korsching
Prof. Dr. Mats Paulsson
Tag der Mündlichen prüfung: 6 Juli 2005
This study was performed in the laboratory of Prof. Dr. Sigrun Korsching in the Institüt für Genetik, Universitat zu Köln, Germany and was supported by the Duetsche Forschungsgemeinschaft. I would like to thank her for the wholehearted support and encouragement during the course of my stay in the laboratory.
I would like to thank Prof. Dr. Mats Paulsson, Prof. Dr Peter Kloppenburg and Dr.
Mathias Cramer for being in my thesis committee.
Dr.Neil Smyth was a very competent collaborater who made the generation of the transgenic mice possible.Dr.Anne Plueck was always ready to offer tips and advice on how to generate and breed the mice. Gisela Kuster, Frau Wolf and Gina Piper were very helpful in the general handling and care of the mice and in collecting tail biopsies.
Mehmet Salturk and Christina Sterner offered excellent technical help during my work.
I was in constant interaction with many poeple in the lab during my thesis work. Hans Fried, Aswani Kumar, Yuichiro Oka, Andreas Rummrich, Verena Oelmann, Silke Argo, Stefan Füss, and Dorothea Heimeier all contributed to educating and entertaining moments in the lab. Hans was especially helpful with the imaging work and was a constant source of help throughout. PalaniMurugan Rangaswamy and I interacted productively in both sceince and social life. Sam Mathew and Aswani shared some enjoyable moments with me during our trips to Italy .
I owe a great deal to my family, my amma, achan, and sisters for encouraging me and making me what I am ….
Many thanks to all the many other friends and acquaintments who made lfe in Germany a very educating experience
ABSTRACT... 1
ZUSAMMENFASSUNG... 3
I.INTRODUCTION...5
1. OLFACTION...6
1.1 ORGANIZATION OF THE MAMMALIAN OLFACTORY SYSTEM... 6
1.2 The odorant receptors recognize odorants ... 8
1.3 Odorant induced Signal transduction ...8
1.4 One neuron-one receptor and one receptor-one glomerulus rules ... 10
1.5 Information processing in the olfactory bulb ...12
2. ODOR INDUCED ACTIVITY;SPATIAL AND TEMPORAL PATTERNS...13
2.1 An overview of methods to study odor induced activity patterns ...14
2.2 Optical imaging in different species; spatial patterns... 14
2.3 Temporal activity patterns in olfactory bulb and antennal lobe ...16
3. EXPERIMENTAL STRATEGY... 17
II MATERIALS AND METHODS...19
1. BIOLOGICAL MATERIAL... 20
1.1 Experimental Animals ... 20
1.2 Eukaryotic cell line ...20
1.3 Bacterial strains ... 20
2. CHEMICALS AND SUPPLIES...21
2.1 Enzymes... 21
2.2 Nucleotides...22
2.3 Membranes and Filters ...22
2.4 Films... 22
2.5 Plasticware...23
3. PREPARATION OF SOLUTIONS AND REAGENTS...23
4. PLASMIDS AND VECTORS...24
5. LIBRARIES...26
6. PRIMERS...26
7. ANTIBODIES...28
8. DYES,SUBSTRATES, EMBEDDING MEDIA...28
9. EQUIPMENT...29
10. MOLECULAR BIOLOGICAL METHODS... 30
10.1 Isolation, purification, and quantification of DNA...31
10.1.1 Isolation of plasmid DNA... 31
10.1.2 Preparation of BAC DNA... 31
10.1.3 Preparation of genomic DNA from mouse tail biopsies ... 32
10.1.4 Phenol chloroform extraction of DNA ... 32
10.1.5 Ethanol precipitation of DNA... 32
10.1.6 Quantification of DNA samples... 33
10.2 Agarose gel electrophoresis of DNA...33
10.2.1Routine agarose gel electrophoresis of DNA... ... 33
10.2.2 Pulsed Field Gel Elecctrophoresis ... 33
10.3 Enzymatic manipulation of DNA ... 34
10.3.1Restriction endonuclease digestion of plasmid DNA ... 34
10.3.2Enzymatic Digestion of mouse genomic DNA for southern blotting. ... 34
10.3.3 Dephosphorylation of 5’ terminus of restriction digested DNA... 34
10.3.4 Blunting 5’ and 3’ overhangs... 35
10.3.5 Ligation of vector to insert... 35
10.3.6 Isolation of DNA from agarose gels ... 35
10.4 Electroporation of DNA into bacterial cells ...36
10.4.1 Preparation of electrocompetent E.coli... 36
10.4.2 Electroporation of DNA into bacterial cells ... ... 36
10.5 Identification of recombinant clones ... 37
10.5.1 Preparation of glycerol stocks... ... 37
10.6 Polymerase chain reaction ... 37
10.7 DNA sequencing and sequence analysis... 38
10.7.1 Routine DNA sequencing ... 38
10.7.2 BAC end sequencing... 38
10.7.3 Sequence analysis ... 39
10.8 Radioactive labeling of DNA ...39
10.9 Southern transfer and membrane hybridization ... 39
10.9.1 Southern blotting... ... 40
10.9.2 Pre-hybridization and hybridization ... 40
10.9.3 Post-hybridization washes ... 40
10.9.4 Stripping and re-probing of membrane ... 41
10.10 Colony Hybridization ...41
10.10.1 Transfer of colonies to nylon membrane ... 41
10.10.2 Cell lysis and DNA fixation... 42
11. CELL CULTURE EXPERIMENTS...42
11.1 Maintenance of cells in culture...42
11.2 Lipofectamine mediated transfection of cells in culture ...42
12. TARGETED MODIFICATION OFBACTERIAL ARTIFICIAL CHROMOSOMES IN-VIVO...43
12.1 Modification of BACs by RecA mediated recombination in E.coli (Heintz method) ...43
12.1.1 Cloning of the recombination cassette ... 43
12.1.2 Subcloning of the recombination cassette into pSV.RecA shuttle vector ... 44
12.1.3 Homologous recombination-step 1-identification of cointegrates... 44
12.1.4 Homologous recombination step 2-resolution of co-integrates ... 44
12.2 Modification of BACs by the Red-Gam system (Coupland Method) ...45
12.2.1 Electroporation of BAC into DY380 cells... 45
12.2.2 RED Gam induction and preparation of competent cells ... 46
12.2.3 Designing PCR products for recombination... ... 46
12.2.4 Transformation and selection... 47
12.3 Column chromatography ... 47
13. GENERATION AND BREEDING OF TRANSGENIC MICE...48
13.1 Pro-nuclear micro-injection ... 48
3.2 Breeding and analysis of transgenic mice ...48
14. PROTEIN TECHNIQUES...49
14.1 Western blotting of mouse brain extracts and immunodetection...49
14.1.1 Protein extraction from mouse brain... 49
14.1.2 Protein assay ... ... 49
14.1.3 Poly-acrylamide gel elctrophoresis ... 50
14.1.4 Electro-blotting of protein s from gel to PVDF membrane ... 50
14.1.5 Immunological detection of immobilized antigen... 50
14.1.6 Stripping and re-probing of membrane ... 51
14.2 Immunohistochemistry ...51
14.2.1 Tissue preparation and sectioning... ... 52
14.2.2 Antibody staining of fresh frozen cryostat sections... ... 52
15. OPTICAL IMAGING AND DATA ANALYSIS... 53
III.RESULTS ... 54
1. OUTLINE OF EXPERIMENTS... 55
2. CLONING OF THEC-FOSGENE...57
2.1Cloning of C-fos gene from Mus musculus P1 library ... 58
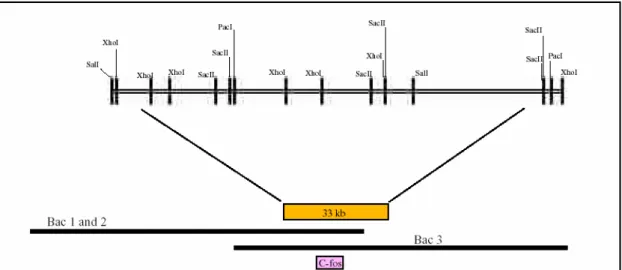
2.2 Identification of C-fos containing Bacterial Artificial Chromosome clones ... 60
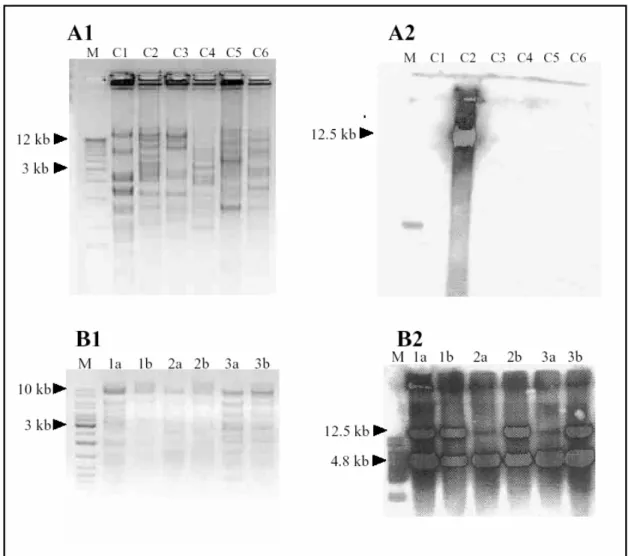
2.2.1 Restriction mapping and southern hybridization is used to identify theC-fosBAC best suited for in-vivo modification ... 60
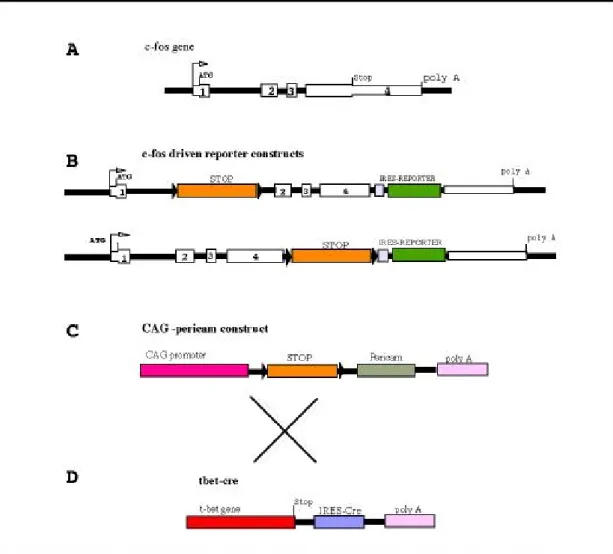
3. CONSTRUCTION OF EXPRESSION VECTORS... 65
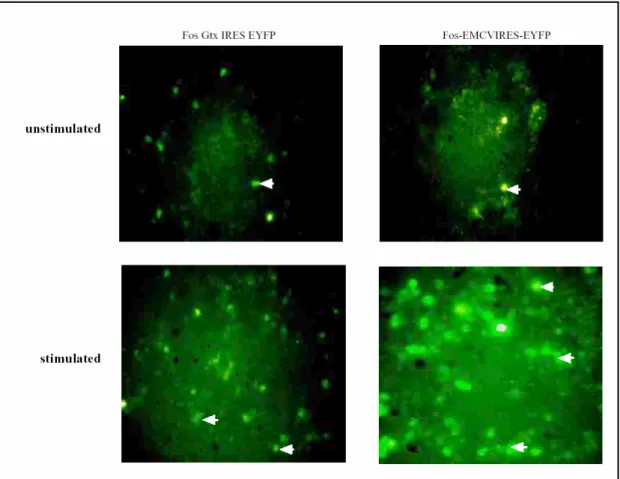
3.1 Construction of C-fos-STOP-EMCV-IRES-EYFP ...65
3.2 Construction of C-fos-STOP-GtxIRES-EYFP...66
3.3 Construction of CAG-STOP-RmPc...66
4 PLASMID CONSTRUCTS WERE TESTED BY TRANSFECTION OF CELLS IN CULTURE... 69
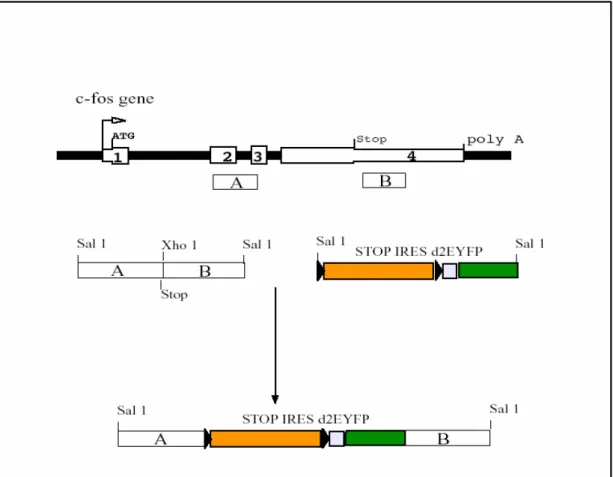
5. CONSTRUCTION OFFOSRECOMBINATION CASSETTE... 69
5.1 Homology regions A and B were amplified by PCR and linked together. ...69
5.2 STOP-IRES-d2EYFP was built piecewise and cloned in between homology A and B...70
6. MODIFICATION OFBACTERIAL ARTIFICIAL CHROMOSOMES IN-VIVO... 73
6.1 Modification of C-fos gene carried in a BAC by RecA mediated recombination in E.coli ...73
6.1.1 pSV.1RecA carrying the recombination cassette integrates into the BAC at theC-foslocus... 73
6.1.2 Incubation in fusaric acid containing medium selects for resolved cointegrates... 74
6.1.3 The fidelity of recombination is assessed by PCR and restriction mapping... 76
B.Restriction mapping also confirmss correct modification. One BstEII and SacI site each are removed from the C-fos locus by modification resulting in larger bands with these enzymes. A new BamHI site is introduced, giving rise to a smaller band. ...78
6.2 Gel permeation chromatography failed to separate backbone from insert... 78
6.3 BAC modification by Red-Gam Mediated recombineering ... 80
6.3.1 Red-Gam system utilizes PCR primers with 40 bp homology regions at the 5’ ends ... 80
6.3.2 The PCR product undergoes recombination with the BAC in heat shocked DY380 cells... 80
6.4 Three rounds of microinjection were carried out for creation of Fos-d2EYFP mice ...82
7. GENERATION AND BREEDING OFRATIOMETRICPERICAM TRANSGENIC MICE...83
7.1 Pericam transgenic mice were generated by two rounds of microinjection ... 84
7.2. Six transgenic lines were derived from the founders ...84
7.3 Breeding to CMV-Cre mice did not delete the stop cassette ... 86
7.4. Breeding of pericam mice with CamKII-iCre mice...87
7.4.1 Ratiometric pericam is expressed in the fore-brain of double transgenics ... 87
... ... 89
7.4.2 Pericam could be detected in olfactory sensory neurons and at a lower level in granule cells ... 89
7.4.3 Pericam activity could not be detected with optical imaging in the olfactory bulb... 90
IV DISCUSSION ...93
1.EXPERIMENTAL STRATEGY...94
1.1 Strategies for cell type-specific gene expression in transgenic mice...94
2.C-FOS,A WIDELY USED NEURONAL ACTIVITY MARKER...95
2.1. Fos.d2EYFP mouse...96
2.2 Early constructs and cell culture experiments... 97
2.3. RecA mediated BAC modification and preparation for microinjection ...98
2.4 Red-Gam mediated recombination ...100
2.5 Microinjection and identification of transgenics ...101
2.6. Future experiments with fos-d2EYFP mice ...102
3.PERICAMS AND OTHERGFPBASED ACTIVITY MARKERS...103
3.1 Other fluorescent activity markers in transgenic animals ... 104
3.2 Generation of Ratiometric Pericam transgenic mice ...105
3.3 Breeding and analysis; crossing to CMV-Cre mice ...105
3.4 Breeding of pericam mice with CamKII-Cre strain ...106
3.5 Future experiments with pericam transgenic mice...107
V. APPENDIX...108
STOP –IRES-D2EYFPCASSETTE...108
FOSHOMOLOGYAANDB ...109
CAG STOP RMPC ...109
VI. REFERENCES...112
VII. ABBREVIATIONS...120
Abstract
The olfactory system consists of the olfactory epithelium in the nasal cavity, the olfactory bulb, the olfactory cortex and higher brain regions. Olfactory information processing begins at the olfactory sensory neurons that express odorant receptors. These proteins bind odors and transduce a biochemical signal that is converted to action potentials by the neuron. In the olfactory bulb, sensory neurons synapse with projection neurons called the mitral/tufted cells in structures called glomeruli and pass on information to the olfactory cortex. The olfactory bulb is not a simple way station for transmission of odorant information; significant processing of information is carried out by the circuitry in the olfactory bulb. The major neuronal components of the bulb that take part in these interactions are the periglomerular cells, short axon cells and the granule cells. Neural information processing is carried out by ensembles of neurons and it is important to study such populations to reach an understanding of nervous system function. Recent developments in identification of cell type specific promoters and construction of GFP based sensors of Ca2+ influx and voltage changes has made it possible to devise genetic strategies to study them. Another strategy that is frequently employed is studying the expression of Immediate Early Genes, especiallyC-fos after stimulation. In this study we developed two mice strains, one that can express the short half-life version of EYFP called d2EYFP under theC-fospromoter and another that codes for the calcium sensitive fluorescent protein ratiometric pericam. The expression of both these reporters can be made cell type specific because they are blocked by a floxed stop cassette and can be activated in specific cell types by crossing to mice strains that express the cre recombinase under specific promoters. A Bacterial Artificial Chromosome that carries the C-fosgene was modified by inserting a STOP-IRES-d2EYFP cassette at the C-fos locus after truncating the C-fos-coding region. The loxP site in the BAC’s back bone was removed by another round of recombination and circular BAC molecules were used of pronuclear microinjection. One positive founder was identified and is being bred for
further analysis. Ratiomeric pericam was cloned under the ubiquitous CAG promoter with a stop cassette in between and transgenic mice were made after testing expression in cell culture. Seven different transgenic lines with different transgene copy numbers were obtained and were subjected to further analysis. No transgene expression could be detected upon breeding to a CMV-Cre mouse strain that should delete in all cells.
Analysis of DNA of double transgenic mice showed no deletion of stop cassette. The mice were further crossed to a CamKII-cre strain. Pericam was detected in fore brain of double transgenics by western blotting with anti-calmodulin and anti-GFP antibodies.
Immunohistochemistry of olfactory bulb and olfactory epithelium revealed high level expression in patches of olfactory epithelium and much lower expression in granule cells of olfactory bulb. Further experiments are under way to characterize both the strains and to start optical imaging in the olfactory bulb and olfactory epithelium.
Zusammenfassung
Das Geruchssystem besteht aus dem Riechepithel in der Nasenhöhle, dem Bulbus olfaktorius, dem olfaktorischen Cortex und weiteren Gehirnregionen. Die Informationsverarbeitung im olfaktorischen System beginnt mit den Geruchsrezeptorneuronen, die die Geruchsrezeptorgene exprimieren. Diese Rezeptoren binden Geruchsstoffe und generieren so ein biochemisches Signal, das zu Aktionspotentialen umgewandelt wird. Im Bulbus olfaktorius bilden die sensorischen Neuronen Synapsen mit den Projektionsneuronen in Neuropilknäueln, den sogenannten Glomeruli. Die Projektionsneuronen, Mitral- und Büschelzellen tragen die Information zum Riechcortex. Der Bulbus olfaktorius ist nicht nur eine einfache Relaisstation, hier findet schon Informationsverarbeitung statt durch periglomeruläre Zellen, Short-Axon- Zellen, und Körnerzellen. In allen diesen Interaktionen sind Zellensembles beteiligt, und es ist daher wichtig, die Antworteigenschaften von Populationen von Neuronen zu untersuchen, um das Geruchssystem zu verstehen.
Seit kurzem sind genetisch kodierte Calcium-Indikatoren verfügbar geworden, die zusammen mit der Entwicklung zelltypspezifischer Promotoren es erlauben sollten, die neuronale Aktivität auf der Populationsebene zu untersuchen. Solche Promotoren sollten es auch ermöglichen, die Aktivierung von Immediate-Early Genen wieC-fos (welche die neuronale Aktivierung wiederspiegelt) zelltypspezifisch zu charakterisieren.
In dieser Dissertation habe ich zwei Mausstämme generiert, in einem wird die destabilisierte Version von EYFP, d2EYFP, unter der Kontrolle des C-fos Promotors exprimiert, im anderen wird der Calciumindikator ratiometrisches Pericam von einem ubiquitären Promotor, CAG, exprimiert. Nichtsdestotrotz kann die Expression in beiden Fällen zelltypspezifisch geführt werden, da eine loxP-STOP-loxP Kassette vorgeschaltet ist, und durch Kreuzung mit einer geeigneten CRE-Rekombinase-exprimierenden Mauslinie entfernt werden kann.
Ein bakterielles artifizielles Chromosom (BAC) mit dem C-fos Gen wurde mittels homologer Rekombination durch Einbringung einer STOP-IRES-d2EYFP Kassette so modifiziert, dass nur ein trunkiertes C-fos entstehen kann. Nach Eliminierung einer loxP Sequenz im BAC-Vektor wurden intakte modifizierte BAC Moleküle mittels pronukleärer Injektion in Mausoozyten engebracht. In drei Injektionsrunden konnte eine Integration in die Keimbahn festgestellt werden, diese Maus wird gegenwärtig für weitere Analysen weitergezüchtet. Das Konstrukt mit dem Calcium-Indikatorgen wurde als klassisches Transgen konzipiert und in Zellkulturexperimenten auf die erwartete Funktionsweise überprüft. Nach pronukleärer Injektion wurden sieben verschiedene Mauslinien erhalten. Die Überprüfung einiger dieser Linien durch Kreuzung mit einer CMV-Cre Mauslinie ergab unerwarteterweise keine Aktivierung des Indikatorgens. In der Kreuzung mit einer CamKIIalpha-Cre Mauslinie konnten in zwei dieser Linien Bestandteile des Calcium-Indikators im Vorderhirn mittels Western Blot nachgewiesen werden; Calmodulin über einen spezifischen Antikörper und Pericam über einen GFP- Antikörper, der auch Pericam erkennt. Präliminäre immunhistochemische Experimente im Bulbus olfaktorius und im Riechepithel zeigten starke, wenngleich inhomogene Expression in Regionen des Riechepithels und möglicherweise eine schwache Expression in der Körnerzellschicht des Bulbus olfaktorius. Experimente zur weiteren Charakterisierung dieser zwei Linien sind begonnen worden.
I.INTRODUCTION
1. Olfaction
Olfaction is an important sense for animals. From an evolutionary standpoint, it is an ancient sense. It is used in finding food and mate, kin recognition and many social behaviors and provides sensual pleasures (flowers, perfumes) and warnings (spoiled food, harmful chemicals). Odor related physiology can cause immediate changes in the affective state and arousal level in humans and evoke recall of emotional valence and personal experiences related to the odor (proustian phenomena). Human beings, considered microsmates, can distinguish about ten thousand odors while macrosmates like mice are thought to be able to distinguish many more. Olfactory research today encompasses many levels from the molecular through the cellular and systemic to the behavioral, and many species (Shipley and Ennis, 1996). This thesis describes research on the mammalian olfactory system, specifically, that of the mouse, using a molecular- systemic approach.
1.1 Organization of the mammalian olfactory system
Fig I.1 Mammalian olfactory system. OSN, olfactory sensory neuron; Glom, glomeruli;
MC, mitral cell; GC, Granule cell; EPL, External plexiform layer; CF, centrifugal fibres.
From: http://neurowww.cwru.edu/faculty/Strowbridge/
A schematic diagram of the human olfactory system is shown in fig I.1. Mammals have a highly developed olfactory system that is distributed among the peripheral and central nervous systems. In the nasal cavity is a special kind of epithelium, the olfactory epithelium, consisting of supporting cells, mature olfactory sensory neurons and neuronal progenitor cells. Of these, the bipolar olfactory sensory neurons are involved in odorant binding and signaling. They consist of a single dendrite terminating in a tuft of cilia, which lines the epithelium, a cell body and a long axon that projects to the olfactory bulb through the cribriform plate. The olfactory bulb is a laminar structure, which is involved in processing olfactory information before it is transmitted to the higher brain regions, among them the olfactory cortex. The superficial layer of the olfactory bulb is called the olfactory nerve layer (ONL). It is made of axons from the olfactory neurons and glial cells. Immediately below the ONL is the glomerular layer. It consists of spherical or ovoid neuropils of about 100 to 150 micrometer diameter of which there are about 2000 per bulb in mouse. In the glomeruli the OSN axons mingle with axons and dendrites of juxtaglomerular cells and mitral cells. The secondary dendrites of mitral cells and granule cells form the external plexiform layer that lies below the glomerular layer. The mitral cell bodies themselves form the next layer, the mitral cell layer. From each mitral cell a primary dendrite penetrates a glomerulus. Each glomerulus is connected to about 25 mitral cells in mouse. Mitral cells along with tufted cells are the primary output or projection neurons, cells that take information to higher brain regions. The innermost is the granule cell layer made up of cell bodies of anaxonal granule cells, which gives way to the sub-ependymal zone made of cells that line the ventricle. Some progenitors of bulbar neurons are found here.
1.2 The odorant receptors recognize odorants
The molecular era in olfaction began with the cloning by RT-PCR of putative odorant receptors that belong to the class of membrane proteins called GPCRs (G-protein coupled receptors)(Buck and Axel, 1991). Information was available that there existed a GTP dependent adenylase cyclase activity in olfactory cilia. This pointed to the possibility that the mechanism of odor recognition could involve GPCRs expressed in the receptor neurons (Reed et al., 1992). Based on this information, Buck and Axel produced degenerate oligonucleotide primers against conserved domains of GPCRs and cloned them from olfactory epithelium mRNA. The full-length products when assembled from these partial cDNAs turned out to be typical GPCRs with seven membrane spanning loops. They are abundantly expressed in the cilia of mature OSNs and have been shown to bind odorants. In mice there are about 1300 odorant receptor genes (about 20% of which are pseudogenes), making them the largest among the gene families (Niimura and Nei, 2005). None of these proteins have been crystallized for X-ray crystallographic structure determination, but molecular modeling studies based on the structure of rhodopsin have been done. From these and other studies, it has been inferred that the odorant-binding pocket reside between transmembrane regions three, four and five(Luu et al., 2004). An active area of research is finding receptor-ligand pairs by functionally expressing the ORs in cell cultures or in the epithelium.
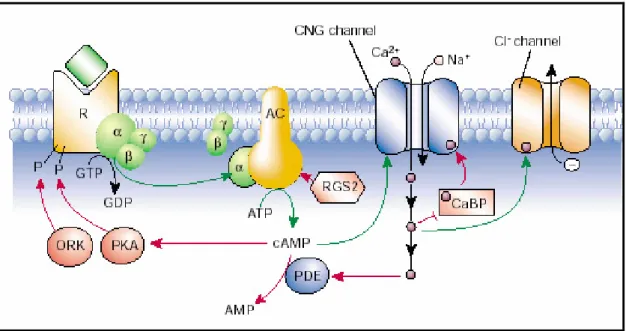
1.3 Odorant induced Signal transduction
The signaling events that occur in the olfactory receptor neurons are topics of intense study (Firestein, 2001). Airborne odorants are swept into the nasal cavity by breathing .The olfactory epithelium is bathed in mucus containing a class of proteins called the odorant binding proteins, which bind and transport odorant molecules to the cilia of the olfactory receptor neurons. The odorant receptors (ORs) non-covalently bind ligands and
initiate signal transduction. As said before, ORs are GPCRs and have trimeric G-proteins (in this case Golf) associated with their cytoplasmic side. Ligand binding results in the exchange of GDP for GTP and dissociation of the subunit from the subunits. The sub-unit then binds and activates the enzyme adenylyl cyclase, which converts ATP to cyclic-AMP. Elevated levels of cAMP results in the opening of the cyclic nucleotide gated channel and a consequent influx of calcium ions, which opens an unidentified chloride channel that leads to chloride efflux and depolarization of the neuron. Calcium ions also activate cAMP phosphodiesterase that breaks down cAMP and terminates the signal. Calcium is also generally involved in adaptation, a phenomenon by which continuous exposure to an odor results in insensitivity to that odor. Other second messengers, Inositol tri-Phosphate (IP3) and cGMP, have also been proposed to be involved in signal transduction. Indeed there is a view that there are two different biochemical pathways, one mediated by cAMP and the other by IP3 operating in the ORNs, which could be true, judging from recent evidence. Either way, receptor activation leads to depolarization of the olfactory sensory neuron (generation of EPSP) which produces a train of action potentials relayed to the olfactory bulb.
Fig I.2 Sensory transduction in the OSN cilia: AC, adenylyl cyclase; CNG channel, cyclic nucleotide-gated channel; PDE, phosphodiesterase; PKA, protein kinase A; ORK, olfactory receptor kinase; RGS, regulator of G proteins (but here acts on the AC); CaBP,
calmodulin-binding protein. Green arrows indicate stimulatory pathways; red indicates inhibitory (feedback). From: Firestein S Nature. 2001 Sep 13;413(6852):211-8.
1.4 One neuron-one receptor and one receptor-one glomerulus rules
How is the activation of receptors by a particular odorant read out by higher brain regions? The mystery is how the system finds out which receptors are activated by an odor. With in-situ hybridization assays, it was found that each receptor is expressed by only about 0.1% of OSNs, implying that each neuron expresses only one receptor gene.
Single cell RT-PCR experiments also suggested the same. Based on these data, Hitoshi Sakano’s group in Tokyo raised mice transgenic for a cluster of OR genes in which the MOR 28 gene was tagged with tau-LacZ using Yeast Artificial Chromosomes (YAC) modified in yeast cells. These mice were crossed to gene targeted mice in which the endogenous MOR 28 locus was marked with GFP. In the progeny, no receptor neurons were found that co-expressed LacZ and GFP. This demonstrated that the expression of ORs is mutually exclusive, even for genes with the same sequences and regulatory elements, but differing in chromosomal locus (Serizawa et al., 2000). Thus, the problem of finding which receptor is activated can be simplified to that of finding which set of neurons are activated (Serizawa et al., 2004). In addition, there is allelic exclusion in the system, providing for expression of only one allele from the two present in the chromosomes in a cell (Chess et al., 1994). This possibly eliminates the problem of having receptor proteins with slightly different specificity in the same cell.
Sensory neurons that express different receptors are intermingled in the epithelium.
Generally, neighbours of an OR express different receptors, implying that odorants map to the sensory surface in a distributed manner. In-situ hybridization experiments with individual ORs have shown the olfactory epithelium to be divided into four zones, each defined by the set of receptors that are expressed in it (Mori et al., 2000). But, within each zone, cells that express a particular receptor are distributed randomly. Thus, the distribution of ORs is neither receptotopic nor chemotopic in the epithelium. But similar experiments in the olfactory bulb indicated that there might be mRNA of only one OR in
each glomeruli. Building on this observation, Mombearts et al generated mice in which the genomic locus of an odorant receptor, P2, was modified by the addition of IRES-tau- lacZ sequences enabling the transcription of P2-IRES-tau-lacZ bicistronic mRNA. IRES (internal ribosomal entry sequence) element helps in translation of the second cistron, the tau-lacZ, which is an axonically transportable reporter. When the distribution of the P2 neurons were studied by X-Gal staining in these gene targeted mice, it was found that their cell bodies are randomly distributed in the epithelium within the defined zone, but their axons converged to two glomeruli, one lateral and the other medial in the olfactory bulb. Thus, the glomerular layer is highly organized into an array of neuropils each receiving input from neurons expressing only one receptor (Mombaerts et al., 1996).
Many studies revealed that each odorant could bind many receptors, thus activating many glomeruli. Thus, each odorant is represented at the level of the olfactory bulb by a unique combination of glomeruli that respond to it. This is called the combinatorial mechanism of odor coding, the central feature of which is that the molecular features of an odorant are converted into a spatial map of neuronal activity. This means that only a few glomeruli are required to code for a particular odorant and that responses overlap. This mechanism has been corroborated by many studies, which are described below.
Combinatorial coding has the advantage that thousands of odorants can be mapped using only a few hundred or so receptors and glomeruli. This is in contrast to monospecific coding, which would require a receptor for each odorant. Monospecific coding, but is thought to be used in the pheromone sensing system.
The presence of two glomeruli receiving inputs from the same receptor means that the olfactory bulb contains two mirror-image maps. Also, the co-ordinates of glomeruli within the bulbar surface are rather stereotyped, although not completely invariant. In addition, ORNs expressing closely related odorant receptors (which binds structurally related odorants) project to neighboring glomeruli in the bulb. This is strong indication that the olfactory bulb has a receptotopic and chemotopic organization, contrary to the epithelium.
1.5 Information processing in the olfactory bulb
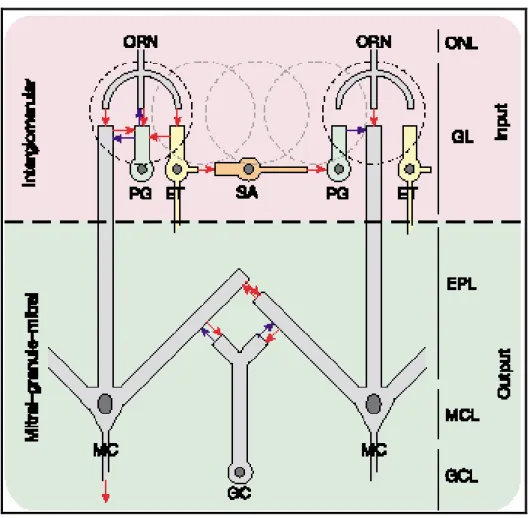
The patterns seen at the glomerular level are not directly relayed to the higher brain regions. As shown in Fig 1.3, there are many neuronal interactions in the bulb that act upon and modify the glomerular code. The most important of these is the reciprocal dendro-dendritic interaction between mitral cells and granule cells (Yokoi et al., 1995).
Activated mitral cells activate granule cells, which in turn repress neighboring mitral cells. This sort of lateral inhibition is thought to sharpen the code by enhancing the contrast between active and inactive regions of the bulb. Another hypothesis is that lateral inhibition serves to synchronize the response patterns of mitral cells and underlie the odor-induced oscillations seen in the olfactory bulb. Mitral cells are also known to be self -inhibitory. In addition, the juxtaglomerular cells, which include the periglomerular cells, external tufted cells and the short axon cells also modify the odor code. Periglomerular cells form dendrodendritic connections between mitral and tufted cells and also axodendritic connections with ORNs which they inhibit. Recently, the short axon cells were shown to mediate center-surround inhibition to create an on center- off surround pattern among neighbouring glomeruli (Aungst et al., 2003). There are also centrifugal feed back projections which arise from virtually all parts of the olfactory nucleus which modify, perhaps by inhibition, the message relayed by the mitral cells. In view of all these, it becomes important to monitor the activity pattern of cells further down stream in the olfactory pathway, namely the mitral and tufted cells and ultimately also the higher brain regions to get a better understanding of the mechanism of olfaction. There are no methods available to monitor the activity of mitral cells at the population level repeatedly, although such methods are available for the OSNs (see below). The only method currently used to study mitral cells is electrophysiology. Although much has been learnt with this method, it is inadequate to see bulb-wide pattern of mitral cell activity.
Fig I.3 Figure showing two serial levels of MOB inhibitory circuits. The upper half shows the on center-off surround inhibitory network of the short axon cells. The lower half shows the mitral cell- granule cell network. ORN, olfactory receptor neuron; ONL, olfactory nerve layer; PG, periglomerular cell; ET, external tufted cell; SA, Short axon cell; GL, Glomeruli; MC, mirtal cell; GC Granule cell; EPL, external plexiform layer;
MCL, Mitral cell layer; GCL, Granule cell layer. Red arrows show excitation, blue arrows inhibition. From:Nature. 2003 Dec 11; 426 (6967):623-9.
2. Odor induced activity; spatial and temporal patterns
2.1 An overview of methods to study odor induced activity patterns
Many methods are available to study the activity patterns of OSNs glomeruli, bulbar neurons and the higher brain regions upon odorant stimulation (Korsching, 2001). There are non-invasive methods like Positron emission tomography (PET), Magnetoencephalography (MEG) and functional magnetic resonance imaging (fMRI).
These methods have very low spatial resolution to allow imaging of individual neurons and even glomeruli. MEG measures tiny magnetic fields generated by current flows in active neurons .It has low spatial resolution, but a high temporal resolution. PET measures blood flow changes regionally via positron emission from injected tracers.
BOLD fMRI measures depletion of blood oxygenation level via the influence of paramagnetic deoxyhemoglobin on proton magnetic resonance. In general, these methods have proved very useful in human studies and in identifying brain regions involved in odor coding. Calcium and voltage sensitive dyes loaded into the neurons at the nasal epithelium have been used to study bulbar activity using novel powerful methods of optical imaging. Optical imaging has also been used to monitor intrinsic signals (which arise from blood flow changes, oxygenation state of hemoglobin etc) on the bulbar surface upon odor stimulation. These methods have good temporal and spatial resolution and have been used extensively in olfaction. Odorant stimulated uptake of radiolabelled 7-deoxyglucose revealed by autoradiography is also useful to monitor odor induced activity. This method and monitoringC-fos expression (see below) are one shot type, in that they allow only one imaging per animal.
2.2 Optical imaging in different species; spatial patterns
Optical imaging merits special mention in this study because it will be used here and it allows repeated imaging with glomerular resolution. Optical imaging studies have been
done in honeybee, Drosophila, zebrafish, turtle and rodents. In mouse, in addition to calcium imaging, imaging of intrinsic signals has also been possible.
Honeybee and Drosophila have that advantage that individual glomeruli have stereotyped positions and can be identified based on this criterion alone. In honeybee calcium imaging experiments have been used to reveal coding at the glomerular level [Galizia, 2000 #21(Galizia and Menzel, 2001)]. In the more genetically tractable Drosophila, a recent publication outlines the construction of a genetically encoded activity marker (cameleon) for the olfactory system (Fiala et al., 2002). Studies in both species support the combinatorial mechanism of odor coding. The one glomerulus –one receptor rule has been shown to be true in Drosophila (Vosshall et al., 2000). The coding has also been shown to be chemotopic, that is, related odorants map to closer regions in the bulb.
Combinatorial and chemotopic coding of odorants have been shown using calcium imaging for zebrafish (Friedrich and Korsching, 1997; Friedrich and Korsching, 1998).
Here also, responses to a particular odorant is restricted to a small proportion of the bulbar region and related odorants elicit similar response patterns. Accordingly, subregions can be recognized in the zebrafish olfactory bulb for amino acids, bile acids and nucleotides. A series of amino acids activated glomeruli in the lateral region while bile acids activated the medial region. In a turtle species that senses airborne odorants, experiments showed that a large number of glomeruli were activated by particular odorants the identitiy of which changed little with concentration. The coding method is combinatorial. In mouse it was found that odorants evoked activity in subregions of the dorsal olfactory bulb based on their structural features, the most important of which is the functional group attached to the carbon chain (Uchida et al., 2000). Aldehydes and acids activated the antero-medial region while alcohols activated a lateral region. Within these subregions, the patterns differed slightly based on differences in carbon chain length and side chains. Thus the mechanism is combinatorial and chemotopic (Wachowiak and Cohen, 2001).
2.3 Temporal activity patterns in olfactory bulb and antennal lobe
In addition to the spatial activity patterns described above, which are a property of mainly the olfactory receptor neurons, there is temporal activity patterning which arise as a result of the network interactions in the olfactory bulb. These have been studied by electrophysiological methods. To begin with, the temporal activity pattern of projection neurons is made up of successive excitatory and inhibitory phases, lasting hundreds of milliseconds. It means that the ensemble of active mitral cells (projection neurons in insects) change over the course of a stimulus. Thus, information is presented not only in the instantaneous firing pattern (‘odor image’), but also in the sequence of patterns (‘odor movie’).
In addition, as the activity patterns evolve with time, the relation between them changes.
In zebra fish, at response onset, closely related molecules evoke similar activity patterns meaning that the follow initially the afferent input. But with continued stimulation, these patterns became decorrelated, and so easier to discriminate (Friedrich and Laurent, 2001).
It has been proposed that these differentially processed neural responses could be used for complimentary tasks; the initial similar response could signify that the odorant(s) belong to the same class (e.g., neutral side chain amino acids) and the later decorrelated activity discriminate between them (e.g,tyrosine vs tryptophan). It is found that with time the response of projection neurons becomes synchronized with time and pharmacological abolition of synchrony affects odor discrimination (Laurent et al., 2001). Also, odor responses change over longer time scale because of a short-term plasticity mechanism. In locusts, at the onset of response to an unfamiliar odor, a projection neuron fires intense bursts of action potentials, but lacks fine temporal precision. The spikes of simultaneously recorded PNs are un-correlated and a LFP (Local Field Potential) oscillation is absent. Over prolonged or repetitive stimulation, firing rates decrease, PNs synchronise and LFP oscillations emerge (Friedrich and Stopfer, 2001). Such a phenomenon is also found in Zebra fish.
3. Experimental strategy
Optical imaging with externally applied dyes like calcium green-dextran can be done only in the first order receptor neurons (Fried et al., 2002). The mitral cells and the bulbar neurons and the neurons higher up in the odor sensing machinery are anatomically inaccessible to labeling with dyes. Further more dye labeling is invasive and may result in the labeling of neuronal and non-neuron cells indiscriminately. Dyes are also cleared from the neurons, making it impossible to carry out chronic imaging Dye labeling by injection works with at the most a few neurons. Advances in genetic modification of animals and identification of cell specific promoters have made it possible to label these cells genetically. Also, many variants of GFP are available, which makes calcium sensing, pH sensing and voltage sensing possible in living animals. These methods alter the physiology of the cell only slightly and can be used in real-time. They work in millisecond range within which odor recognition takes place. Monitoring the expression of the immediate early gene C-fos at the level of mRNA or protein is another popular method of activity mapping. Coupling of reporter genes toC-fosregulatory elements also allows monitoringC-fosexpression.
My work exploits calcium sensing and the properties of C-fos to examine odorant dependent activity in specific cell types. The aim is to construct two different mouse lines, one in which the calcium sensing protein ratiometric pericam is expressed cell type specifically and another in which the fluorescent protein d2EYFP is expressed under the control ofC-fos regulatory elements. Ratiometric pericam belongs to a new generation of GFP derived calcium-sensors that have been successful in cell cultures. It will be expressed under a ubiquitous promoter with a floxed transcriptional stop cassette in between d2EYFP, a short half-life version of EYFP is be hooked to C-fos regulatory element with the stop cassette in between. Crossing to a cre recombinase-expressing line can activate both the reporters. For monitoring the activity of mitral cells, the Tbet cre
line is constructed in the lab by a colleague. I report here the generation and analysis of the ratiometric-pericam strain and generation of thefos-d2EYFP strain.
II MATERIALS AND METHODS
1. Biological material
1.1 Experimental Animals
Mice of the strains C57/BL6 and DBA/BL/6 hybrids were used in the studies reported here. They were either obtained from the mouse breeding facility at the Center for Mouse Genetics, Institute for Genetics, or purchased from Charles River laboratories. The animals were housed in the same facility with 12 hours of light and 12 hours of darkness and dry food pellets and water ad libidum.
1.2 Eukaryotic cell line
Human embryonic kidney (HEK) 293 cells were used in this study
1.3 Bacterial strains
For routine amplification of plasmids, the following bacterial strains were used:
Epicurian coliXLI Blue MRF’ Stratagene (Heidelberg)
Genotype: (mcrA)182, (mcrCB-hsdSMR-mrr)173,endA1,supF44,thi-1,RecA1,gyrA96, relA1, lacF’, proAB,lacIqZ, M15,Tn10(tetr)
DH5: RZPD (Berlin)
Genotype: supE44, (lac, ZYA-argF), U169, (80, lacZDM15), hsdR17 (rk- mk-), RecA1,endA1,gyrA96,(Nalr),thiI,relA1
For PCR based BAC modification, the following strain was used:
DY380(Neil Coupland, Maryland)
Genotype: F-mcrA(mrr-hsdRMS-mcrBC)80dlacZM15lacX74deoRRecAIendAI araD139(ara,leu)7649 galUgalKrspLnupGcl857 (cro-bioA) <>tet
2. Chemicals and supplies
All chemicals used in this study were from Ambion (Austin USA), Amersham Pharmacia biotech (Freiburg), Applichem (Darmstadt), JT Baker supplied by Fischer scientific (Schwertze), Biozym (Hessisch Oldendorf), Calbiochem (Darmstadtt), Difco (Detroit, USA), Fluka (Neu-Ulm), Merck (Darmstadt), Roth (Karlsruhe), Serva (Heidelburg), or Sigma (Diesenhofen) unless stated otherwise in the text.
2.1 Enzymes
Restrictionn enzymes were either from New England Biolabs (Schwalbach Taunus) or Amersham pharmacia Biotech (Freiburg). T4 DNA polymerase, Taq DNA polymerase, Pfu High fidelity polymerase, Klenow enzyme, etc were purchased from Roche
Biochemicals (Mannheim).Shrimp alkaline phosphatase (SAP) was from USB (Cleveland, OH, USA). Rnase A and proteinase K were purchased from Sigma.
2.2 Nucleotides
Nucleotides for PCR were from Sigma. Radio-nucleotides (-32P)dCTP (3000Ci/mmole on the day of delivery)was purchased from Amersham Pharmacia Biotech.
2.3 Membranes and Filters
Nylon, nitrocellulose and PVDF membranes Hybond- N ™and Hybond –P were from Amersham Pharmacia Biotech. GB 003 Gel-Blotting paper and sterile filters were purchased from Schleicher and Schuell supplied by Fischer scientific.
2.4 Films
X-Ray films XLS-1, X-OMAT™AR, and X-OMAT™LS in various sizes were from Kodak (Stuttgart). X-Ray film cassettes IEL6040C with intensifier screens were from Rigo (Augsberg).
2.5 Plastic ware
All disposable plastic ware like 15 ml and 50 ml Falcon tubes, 6, 24, 48 and 96 well plates, and petri-dishes, in various sizes were from TPP or Castor, both purchased through Fisher Scientific.96 well plates Polyfiltronics for colony PCR were from Whatman (supplied by Fisher scientific). 0.2 ml PCR tubes and sterile pipette tips were from MP supplied by Fisher scientific. Non sterile pipette tips were supplied by LaFontaine (Forst/Bruchsal) and Labormedic(Bonn).
3. Preparation of solutions and reagents
Solutions were prepared with water from seralpur machines. When necessary, they were autoclaved for 20 minutes at 121 bar. When sterilization is desired but heat sterilization is not possible, they were filter sterilized (0.22.0.45 microns pore diameter). Glass-ware was baked at 180˚C for 2 hours for sterilization.
Most of the standard solutions like EDTA, Tris, TAE, TBE, TE, PBS, TBS, SDS, SSC, Sodium acetate, and culture media like LB and SOC were prepared according to Sambrooket al (1989). All solutions used are named in text.
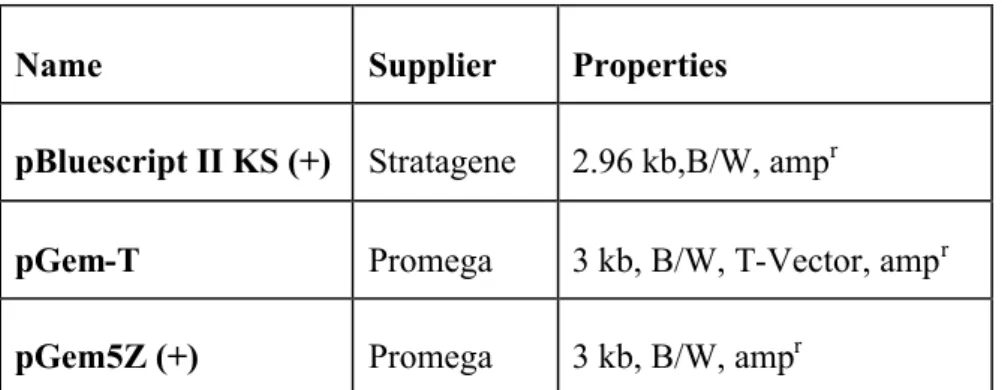
4. Plasmids and vectors
Table III. I: List of cloning vectors
Name Supplier Properties
pBluescript II KS (+) Stratagene 2.96 kb,B/W, ampr
pGem-T Promega 3 kb, B/W, T-Vector, ampr pGem5Z (+) Promega 3 kb, B/W, ampr
B/W: Blue/ White selection with IPTG and X-gal possible
Table III.2: List of Expression vectors
Name Supplier Properties
pEYFP1 Clontech 4.2 kb, promoterless, kanr pd2EYFP- NI Clontech 4.8kb, CMV promoter, kanr Ratiometric Pericam pcDNA3 Miyawaki 6.6 kb CMV promoter, ampr, kanr,
EYFP1: encodes a enhanced yellow fluorescent variant ofAequorea victoriaGFP.
d2EYFP: Encodes a short half-life variant of EYFP Ratiometric pericam: A Calcium sensing variant of EYFP
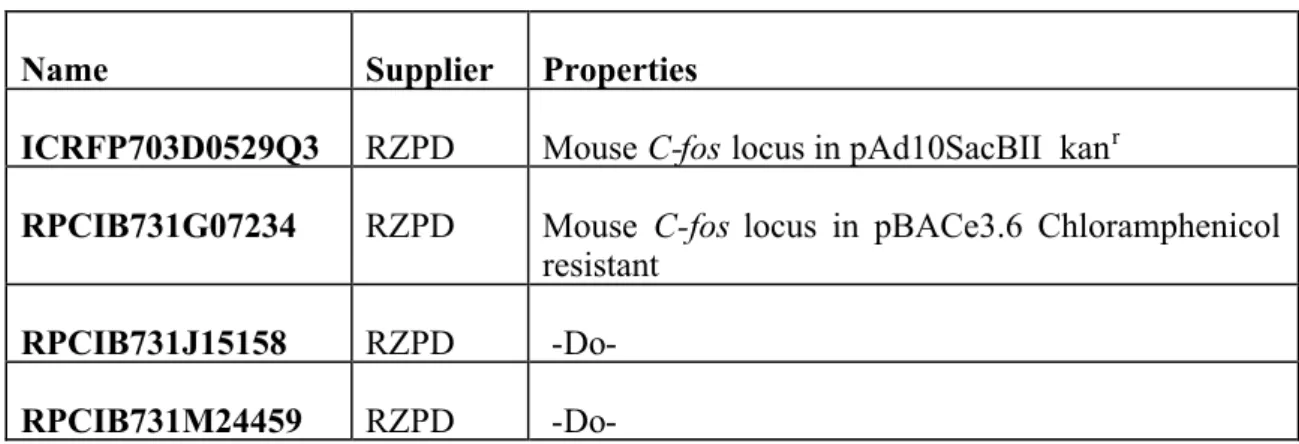
Table III.3: List of Genomic DNA clones
Name Supplier Properties
ICRFP703D0529Q3 RZPD MouseC-foslocus in pAd10SacBII kanr
RPCIB731G07234 RZPD Mouse C-fos locus in pBACe3.6 Chloramphenicol resistant
RPCIB731J15158 RZPD -Do- RPCIB731M24459 RZPD -Do-
Table III.4: List of Plasmids from external sources
Plasmid name Supplier Description
pSPfos 65 Ralf Heumann 1.3 kb mouse v-fos fragment in pSP65 vector
pBS302 Brian Sauer 1.5 kb floxed stop cassette
pSvRecA Nathaniel Heintz Vector for recombineering
PCAGGS Jun-Ichi Miyazaki CAG promoter and Rabbit
Globin PolyA signal
pL451 Neil G Coupland Kanrgene with PGK promoter
GtxBRPh Vincent Mauro Gtx 5X IRES between renilla
and photinus luciferases
Ratiometric-pericam pcDNA3 A Miyawaki 1.2 kb ratiometric-pericam in pcDNA3
5. Libraries
The P1 and BAC genomic libraries of mouse were provided by Human Primate Resource Center (RZPD), Berlin. The P1 library was created by Fiona Francis in the pAd10SacBII vector and electroporated into E.coli NS3145 strain. The BAC library was created by Minako Tateno et al with DNA isolated from brain and kidney and cloned in pBACe3.6 vector. The bacterial strain used wasE.coli DH10B.
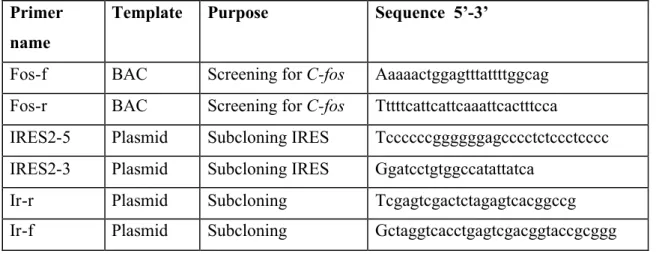
6. Primers
Oligonucleotide primers were by the suppliers Invitrogen or Sigma. The scale of synthesis was 50 nano moles and they were delivered lyophilized and dried. On delivery, they were reconstituted to a concentration of 100 µM with sterile distilled water. Working dilutions of 10µM were made for routine use. Both were stored at -20˚C.
Primers were made for different purposes like subcloning, screening, genotyping, colony PCR, reconstitution of IRES, introduction of restriction sites, Red- Gam recombination etc. All primers used in this study are listed below.
Table III.5: List of oligonucleotide primers
Primer name
Template Purpose Sequence 5’-3’
Fos-f BAC Screening forC-fos Aaaaactggagtttattttggcag Fos-r BAC Screening forC-fos Tttttcattcattcaaattcactttcca
IRES2-5 Plasmid Subcloning IRES Tccccccggggggagcccctctccctcccc IRES2-3 Plasmid Subcloning IRES Ggatcctgtggccatattatca
Ir-r Plasmid Subcloning Tcgagtcgactctagagtcacggccg Ir-f Plasmid Subcloning Gctaggtcacctgagtcgacggtaccgcggg
GIR-S None Construction of Gtx 10X IRES
Ccggcgggtttctgacatccggcgggtttctgaca tccggcgggtttctgacatccggcgggtttctgaca tccggcgggt
GIR-A None Construction of Gtx 10X IRES
Aattcacccgccggatgtcagaaacccgccggat gtcagaaacccgccggatgtcagaaacccgccg gatgtcagaaacccgccgg
Sto-f Plasmid Subcloning Atgcatctagaataacttcgtatagcatacat Sto-r Plasmid Subcloning Atgcatctagaataacttcgtataatgtatgc Giy-r Plasmid Colony PCR Agtctggtcaccctagtggatcccccccggc CAG-F Plasmid Subcloning Atggcggccgcacattgattattgactag CAG-R Plasmid Subcloning Atggcggccgccagctgctttaataagat Fp 1 fin BAC BAC recombination;
subcloning arm A
Atacgtcgacccaaagagtcgctaactag
Fos rev fin BAC BAC recombination;
Subcloning arm A
Atccgattggactcgagtcacagatctgcgcaa Aagtcct
Fosfp2 BAC BAC recombination;
subcloning arm B
Ctcgagtccaatcggatgggaccttacctgt
Fos rp2 BAC BAC recombination;
Subcloning arm B
Atcgtcgaccctcagggtagaaaaaa
Fosfp1 BAC Confirming fidelity of BAC modification
Atacgtcgacggcctgcctgcattcttctct
BacF Plasmid Red–Gam
recombination
Gcgataagttcgacgccaacgatccgatcctgaa agatcagacgcaagaatgggttccgcaagctctag tcg
BacR Plasmid Red-Gam
recombination
Gcaatgtgtcgctgtcgacggtgaccctatagtcg agggacctaataacttcggcctttcgacctgcagcc t
Gcagcctgttg Bace3.6F BAC Confirming fidelity
of BAC modification
Gctgcatccgatgcaagtg
G91 Genomic Genotyping cre Atgcggtgggctctatggcttctg G92 Genomic Genotyping cre Tgcacacctccctctgcatgcacg Rmpc-1 Genomic Genotyping pericam Cttccagtccgccctgagcaaagac Rmpc-2 Genomic Genotyping pericam Gaagcacttcaggccgtagccgaag Stop re Genomic Genotyping stop Aagtccttggggtcttctacctttc Stop fd Genomic Genotyping stop Tcctcttaagtgggaggaacataa
7. Antibodies
The following antibodies were used in this study:
Primary antibodies:
Rabbit anti-GFP polyclonal. antibody from Torrey pines biolabs.
Mouse anti –Calmodulin monoclonal antibody from Zymed.
Secondary antibodies:
Goat anti-rabbit F(ab’)2HRP conjugated, from Dianova.
Goat anti-mouse HRP conjugated, from Bio-rad.
8. Dyes, substrates, Embedding media
Horse radish peroxidase substrate
Diaminobenzidine (DAB) (Vector) Brown-black precipitate.
Embedding media
Mowiol (Polyscience Inc): Embedding medium for chromogenic and flourescent substrates.
DABCO (Sigma): Bleaching retardant (2.5% in Mowiol).
Vectashield (Vector): Mounting medium for fluorescent substrates, with DAPI.
Dyes and counter-stains
DAPI (Sigma): blue fluorescent nuclear counter-stain; 5mg/ml in H2O (stock); working dilution 1:1000.
9. Equipment
Balances Sartorius Laboratory, Sartorius, Heidelberg Sartorius Universal, Sartorius
Sartorius Handy, Sartorius
Centrifuges Biofuge 13, Heraeus Instruments, Hanau
Eppendorf Centrifuge 5415D, Eppendorf, Hamburg Eppendorf Centrifuge 5417R, Eppendorf
Sorvall R5-BB, Dupont Instruments, Bad Homburg Sigma 4K 10 B, Braun, Melsungen
CO2incubator Kendro/Haereus, Hanau Computer G3, G4, Macintosh, Apple Cryostat Cryostat CM 1900, Leica Developing machine Curix 60 Agfa
Electroblotter Semi Dry electroblotter ltf labortechnik Bodensee Electrphoretic equipment Mini-SubCell GT, Biorad
SubCell GT, Biorad Power Pac 300 Biorad
CHEF-DRIII Pulsed field Gel electrophoresis systems Electrporator Gene pulser™, Biorad
Pulse controller (Biorad, Munich) Capacitance extender (Biorad, Munich) Heating Block Thermomixer comfort 1.5 ml, Eppendorf
Hybaid Intelligent heating block, Biometra Dri.Block™DB-3 Techne, Cambridge, UK Hybridization oven Incubator 1000, Heidolph
Techne, Cambridge, UK
Microscopes and Axiophot (Photomicroscope Pol), Zeiss accessories Light source: Atto Arc®2 HBO 100W Zeiss
Objectives: Plan-Neofluar:10X NA0.3,20X NA 0.5 Filter: 485 BP-436/10FT 510 BP 515-565 RT slider SPOT Camera, Diagnostic Instruments Uniblitz® VMM-D1 Shutter driver, Vincent associates Metamorph 4.0, Universal Imaging Corporation MilliQ water Seralpur DELTA, NSF Seral
pH meter pH Meter 766 Calimatic,Knick
Photometer UNICAM 8625 UV/VIS Spectrophotometer
Printer Laser writer,Epson EPL-6200, Epson stylus colour 760
Scanner Agfa SnapScan1236
Shaker IKA-VIBRAX-VXR, Janke and Kunkel
Sterile Hood Heraus Lamin Air LFM2448 S, Heraus, Hanau Transilluminator UV-Transilluminator, Stratagene
Gel Doc System, Biorad Quantity One 4.2.1, Biorad Herolab UVT 2020 The Imager™
High performance CCD-Imager system, Biometra Thermocycler Gene Amp PCR system 2400, Perkin Elmer
T gradient Biometra
UV crosslinker UV stratalinker 1800, Stratagene
Vortex machine Vortex Genie 2™, Bender & Hobein, AG,Melsungen
Waterbath Thermomix, B, Braun
10. Molecular biological methods
Standard molecular biological methods like plasmid DNA preparations, restriction digestions, agarose gel electrophoresis, 5’ and 3’ end modifications, dephosphorylation etc were performed as described in Molecular Cloning (Sambrook et al 1989). When using kits, manufacturer’s instructions were followed.