Validation and Optimization of an Elevator Simulation Model with Modern Search Heuristics
Thomas Bartz–Beielstein, Mike Preuss
∗Universtit¨at Dortmund,
D-44221 Dortmund, Germany.
Sandor Markon
†FUJITEC Co.Ltd. World Headquarters, 28-10, Shoh 1-chome, Osaka, 567-8511 Japan.
Abstract
Elevator supervisory group control (ESGC) is a complex combinato- rial optimization task that can be solved by modern search heuristics.
To reduce its complexity and to enable a theoretical analysis, a simpli- fied ESGC model (S-ring) is proposed. The S-ring has many desirable properties: Fast evaluation, reproducibility, scalability, and extensibility.
It can be described as a Markov decision process and thus be analyzed theoretically and numerically. Algorithm based validation (ABV), as a new methodology for the validation of simulation models, is introduced.
Based on ABV, we show that the S-ring is a valid ESGC model. Finally, the extensibility of the S-ring model is demonstrated.
Introduction
Today’s urban life cannot be imagined without elevators. The central part of an elevator system, the elevator group controller, assigns elevator cars to ser- vice calls in real-time while optimizing the overall service quality, the traffic throughput, and/or the energy consumption. The elevator supervisory group control (ESGC) problem can be classified as a combinatorial optimization prob- lem [1, 2, 3]. It reveals the same complex behavior as many other stochastic traffic control problems, i.e. materials handling systems with automated guided vehicles (AGVs). Due to many difficulties in analysis, design, simulation, and control, the ESGC problem has been studied for a long time. First approaches
∗{tom, preuss}@LS11.cs.uni-dortmund.de
†markon@rd.fujitec.co.jp
were mainly based on analytical methods derived from queuing theory, whereas currently computational intelligence (CI) methods and other heuristics are ac- cepted as state of the art [4, 5].
In this article we propose a simplified ESGC system, the sequential ring (S- ring). The S-ring is constructed as a simplified model of an ESGC system using a neural network (NN) to control the elevators. Some of the NN connection weights can be modified, whereby testing different weight settings and their influence on the ESGC performance is enabled. The performance of one specific NN weight settingxis based on simulations of specific traffic situations, which automatically lead to stochastically disturbed (noisy) objective function values f˜(x). Since it is difficult for an optimization algorithm to judge the fitnessf(x) of one ESGC configuration, the determination of the optimal weight setting
x∗ is not trivial. Direct search methods that rely on the direct comparison of function values face the problem of modifying the weights without generating too many infeasible solutions.
The S-ring was introduced as a benchmark problem to enable a comparison of ESGC algorithms, independently of specific elevator configurations [6, 3]. Re- sults from the S-ring, obtained with low computational costs, should be trans- ferable to more complex ESGC models.
In the following, we will present different techniques to answer the question whether the S-ring is a simplified, but valid ESGC simulation model. We pro- pose a new validation methodology that takes the optimization algorithm for the simulation model into account. Tuning the optimization algorithm on the simplified simulation model results in a good parameter setting for the optimiza- tion algorithm. This setting is also applicable to the complex simulation model.
Thus, improved algorithm parameter settings obtained from simulation results on the S-ring should be transferable to real ESGC problems. S-ring simulations might give valuable hints for the optimization of highly complex elevator group controller optimization tasks.
The remainder of this article is organized as follows: In Sec. 1, we introduce the elevator group control problem. Section 2 discusses S-ring basics, whereas Sec. 3 presents simulation and analysis techniques. Section 4 demonstrates the validity of this model simplification. The extensibility of the S-ring model is demonstrated in Sec. 5. The final section combines a summary with an outlook.
1 The Elevator Supervisory Group Controller Problem
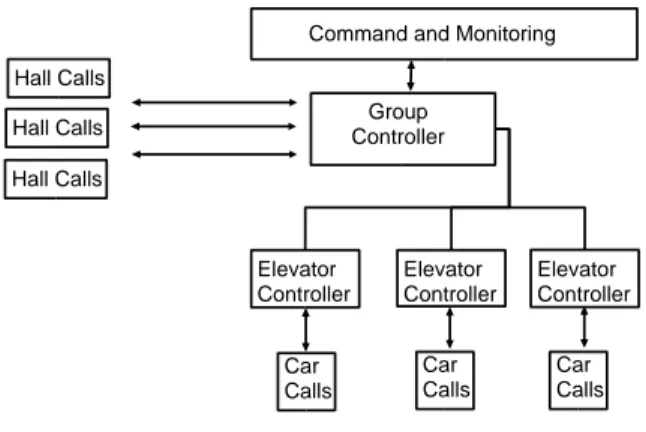
Fig. 1 shows the key role of an elevator group controller: It determines the floors where the cars should go to. The elevator controllers handle the functions inside the car, such as door control, measurement of the car load, and car calls. Since the group controller is responsible for the allocation of elevators to hall calls,
Command and Monitoring
Group Controller Hall Calls
Elevator Controller
Elevator Controller Elevator
Controller
Car Calls Car
Calls
Car Calls Hall Calls
Hall Calls
Figure 1: Elevator group controller architecture. Passengers can give hall calls, the group controller assigns elevators to passengers. From [7]
a control strategy to perform this task in an optimal manner is required. The main goal in designing a better controller is to minimize the time passengers have to wait until they can enter an elevator car after having requested service.
This time-span is called the waiting time. The so-called service time additionally includes the time a passenger stays within the elevator car.
An important aspect is the changing traffic pattern we can observe throughout the day in an office building [8]. There is ‘up-peak’ traffic in the morning when people start to work and symmetrically we observe ‘down-peak’ traffic in the evening. Most of the day there is ’balanced’ traffic with much lower intensity than at peak times. ‘Lunchtime’ traffic consists of two - often overlapping - phases where people first leave the building for lunch or head for a restaurant floor, and then get back to work. The ESGC problem subsumes the following problem: How toassign elevators to passengers in real-time while optimizing different elevator configurations with respect to overall service quality, traffic throughput, energy consumption etc.
Fujitec, one of the world’s leading elevator manufacturers, developed a controller that is trained by use of a set of neuro-fuzzy controllers. Each controller repre- sents control strategies for different traffic situations [8]. The NN structure and the neural weights determine a concrete control strategy. The network structure as well as many of the weights remain fixed, only some of the weights on the output layer can be modified and optimized. A discrete-event based elevator group simulator permits computing the controller’s performance. This highly complex ESGC simulation model will be referred to as the ‘lift model’ (or simply
‘lift’) throughout the rest of this paper.
The identification of globally optimal NN weights is a highly complex task since
the objective function topology is highly non-linear and highly multi-modal. It is stochastically disturbed due to the nondeterminism of service calls, and dy- namically changing with respect to traffic loads. Gradient based optimization techniques cannot be applied successfully to this optimization problem. The computational effort for single simulator runs limits the maximum number of fitness function evaluations to the order of magnitude 104. The objective func- tion considers different traffic patterns described in the previous section. A handling capacity ofnpassengers per hour at 30s means that the elevator sys- tem is able to serve a maximum of n passengers per hour without exceeding an average waiting time of 30s. Beielstein et al. [9] applied evolution strategies (ES) to determine optimal NN weights. The best individuals produced by the ES were assigned handling capacities at 30, 35, and 40 seconds. This results in a multi-criterion optimization problem. The different objectives are aggregated to obtain a single-criteria optimization problem by averaging handling capacities and then subtracting from 3000 pass./h to obtain a minimization problem. The latter value was empirically chosen as an upper bound for the given scenario.
The resulting fitness function reads: F(x) = 3000.0−fa(x), where fa is the average handling capacity (pass./h),ais the parameter design of the evolution strategy optimization algorithm, andxis a 36 dimensional vector that specifies the real-valued NN weights. F(x) is called the ‘inverse handling capacity’.
In general, ESGC research results are incomparable, since the elevator group controlper seis not appropriate as a ‘benchmark problem’:
– Elevator systems have a very large number of parameters that differ widely among buildings, elevator models, manufacturers etc.
– Elevator cars have complex rules of operation, and even slight differences, e.g. in door operation or in the conditions for changing the traveling direction, can affect the system performance significantly. Even the smallest elevator system has a very large state space, making a direct solution infeasible, thus no exact solutions are available for comparison.
– The sophisticated ESGC rules are usually trade secrets of the manufacturers, and cannot made commonly available for research.
In principle, the optimization practitioner can cope with the complexity of the ESGC problem in two different ways: The problem can be simplified or resources can be used extensively (i.e. parallelization, see, e.g. [10]). We will concentrate on the first strategy and present a simplified ESGC model. Ideally, a simplified ESGC model should comply with the following requirements: It enables fast and reproducible simulations and is applicable to different building and traffic configurations. Furthermore it must be a valid simplification of a real elevator group controller and thus enable the optimization of one specific controller policy and the comparison of different controller policies. The simplified model should be scalable to enable the simulation of different numbers of floors or servers.
It should be extensible, so that new features (i.e. capacity constraints) can be added. Last but not least, the model is expected to favor a theoretical analysis.
We propose a model that conforms to all these requirements in the next section.
c0 s
0
c1 s
1 c
n-1 s
n-1
cf-1 s
f-1
1st floor 2nd floor f-th floor
Server #1 Server #2
Server #3 Customer
Customer
Customer
Customer
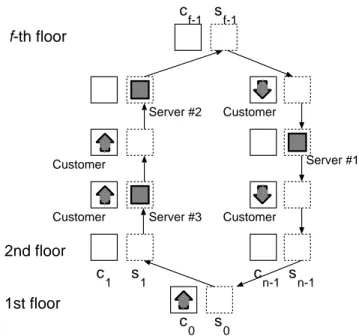
Figure 2: The S-ring as an elevator system. The sites are numbered from 0 to n−1.
2 S-ring Basics
When passengers give a hall call, they simply press a button. Therefore, only a one bit information for each floor is sent to the ESGC. It appears intuitively correct to map the whole state of the system to a binary string. The system dynamics is represented by a state transition table and can be controlled by a policy. The sequential-ring model (S-ring model) has only a few parameters:
The number m of elevator cars, the number n of queues, and the passenger arrival ratep[8, 6]. A 2-bit state (si, ci) is associated with each site. Thesibit is set to 1 if a server is present on theith floor, to 0 otherwise. Correspondingly, thecibit is set to 0 or 1 if there is no waiting passenger resp. at least one waiting passenger. Fig. 2 depicts a typical S-ring configuration. The state at timet is given as
x(t) := (c0(t), s0(t), . . . , cn−1(t), sn−1(t))∈X= IB2n, (1) with IB := {0,1}. A transition probability function f, a decision function δ, and a reward functionrare used to determine the dynamics of the system. A look-up table as shown in Tab. 2 can be used to represent f, δ, and r in a compact manner. We will give a formal definition of the S-ring in the appendix (Def. 2).
The state evolution is sequential (S-ring stands for sequential ring), scanning the
Table 1: The triple in the first column represents the state of the actual site:
Customer waiting, server present, and server present on the next floor. The probability of a state change to the state in the fourth column is given in the second column. Columns three and five denote the decision and the reward respectively. I.e., the server has to make a decision (to ‘take’ or to ‘pass’ the customer) if there is a customer waiting (1xx), and if there is a server present on the same floor (11x) but no server on the next floor (110).
ξ(t) Prob π(x) ξ(t+ 1) ∆r
000 1−p 000 0
p 100 −1
100 1 100 0
010 1−p 001 0
p 0 101 −1
1 010 0
110 1 0 101 0
1 010 +1
001 1−p 001 0
p 101 −1
101 1 101 0
011 1 011 0
111 1 011 +1
sites fromn−1 down to 0, and then again around fromn.1 At each time step, one of the floor queues is considered, where passengers may arrive with probability p. Therefore, the triple ξ(t) := (ck(t), sk(t), sk(t)), with k ∈ {1, . . . , n} and k := 1 + (k+ 1)modn is updated: If the queue has both a customer and a server present, the server makes a decision to ‘take’ (1) or ‘pass’ (0) the customer according to a policyπ (see Def. 3 and Def. 4 in the appendix). In case of a
‘take’ decision, the customer enters the car, and the server stays there; in the
‘pass’ case, or if there is no customer, the server steps to the next site. As the rules of operation are very simple this model is easily reproducible and suitable for benchmark testing.2
Despite the model’s simplicity, it is hard to find the optimal policy π∗ even for a small S-ring; the realπ∗ is not obvious, and its difference from heuristic suboptimal policies is non-trivial.
If the set of states and the set of observations are identical, the model is called fully-observable [11] and the observation functionouses global information. In the following we will also use the partially-observable or the unobservable case.
1The up and down elevator movements can be regarded as a loop. This motivates the ring structure.
2A reference implementation of the S-ring model can be requested from the authors: {tom, preuss}@Ls11.cs.uni-dortmund.de.
Next we will introduce some elementary policies:
– The most obvious heuristic policy is the greedy one: When given the choice, always serve the customer: πg(o)≡1.Rather counter-intuitively, this policy is not optimal, except in the heavy traffic (p >0.5) case. This means that a good policy must bypass some customers occasionally. The greedy policy does not take any information about the state of the system into account.
– The random policy is another trivial policy that leads to rather poor results.
For some givenσ∈[0,1], we can defineπr(o) = 0 with probability (w. pr.) 1−σ, and 1 otherwise. Actions based on the random-policy require no information about the actual system state.
– A quite good heuristic policy, that takes information about the actual state of the system into account, is the balance-policy: πb(o) = 0, if sn−1 = 1, and 1 otherwise. The intention is to put some distance between servers by passing when there is another tailing server, letting it serve the customer: Waiting customers on the (n−1)th floor queue are not served by the leading server, thus a gap is created between the leading and the following server. Balancing the positioning of the servers, πb is significantly better than πg for medium values ofp.
– Finally, we present the perception policy representation: Letθ: IR→IB define the Heaviside function (see Def. 5), and x = x(t) be the state at time t (see Eq. 1), andy∈IR2n be a weight vector. A linear discriminator, or perceptron, πp(x) =θ(< yT, x >),can be used to present the policy in a compact manner.
The perception presentation can be used to encode the other policies mentioned above. Variants of this policy require information on the complete state of the current system, since the state vectorxis used.
The S-ring Model as an Optimization Problem
The ‘optimization via simulation’ approach requires the definition of a perfor- mance measure for the simulation model. The long-run time-average number Qof customers in the system or in the queue are commonly used performance measures in queuing theory [12]. Consider a simulation run of a queuing system over a period of timeT. The steady-state time-average numberQis
Q:= lim
T→∞
T 0 Q(t)dt
T w.pr. 1. (2)
The basic optimal control problem is to find such a policyπ∗ for given S-ring configurationS ∈ S(see Def. 2), that the expected number of sites with waiting passengers, that is the steady-state time-average as defined in Eq. 2, in the system is minimized:
π∗= arg min
π Q(π). (3)
Equivalently, a policyπ is optimal, if it maximizes the expected reward. The general S-ring problem: For a given S-ringS, find the optimal policyπ∗, can be modified to the
Problem 1 (Perceptron S-ring problem) For a given S-ring S, find the weight vectory∈IR2n that represents the optimal policy π∗.
Since the perceptron S-ring problem relies on the fitness functionF : IR2n→IR, it can serve as a benchmark problem for many optimization algorithms [6, 13].
In general,π can be realized as a look-up table of the system state xand π∗ is found by enumerating all possibleπand selecting the one with the lowestQ.
Since this count grows exponentially withn, the naive approach would not even work for any but the smallest cases.
3 Analysis and Simulation of the S-ring system
The S-ring system can be interpreted as a Markovian decision process. Let x(t)∈ X denote the state of the S-ring system at time-stept, whereX denotes the state space of the S-ring system. A single state transition describes the changes of the system, if the kth floor queue is considered. A transition cycle describes the changes of the system, if thensites (k=n−1, n−2, . . . ,2,1,0) are considered in sequence. The N different system states can be enumer- ated using the functionsnum : IB2n → {0,1, . . . ,22n} defined assnum(x(t)) :=
n
i=12i−1(si+ 2n−1ci),and the function slegal, that determines the feasibility of a state (n
i=1si=m).
If the kth floor queue is scanned, the corresponding state transition can be described by an S-ring single state transition matrix Pk. The matrix element (pij) defines the state transition probability from state ito statej. The single state transition matrices can be multiplied to obtain the transition cycle matrix:
P:=n
i=1Pn−i+1.Based onP, we can determine the limiting state probability distribution.
Example 1 Even the simplest non-trivial case with n = 3 floors and m = 2 elevators requires 23 ·3
2
= 24 different states. Based on the limiting state probability distributionπlim and on the vectorc, that contains at itsith position the number of customers when the system is in theith state, we can determine the valueQ for the greedy strategy as < πlim, c >= 3·p2/(p4−p3+ 2p2+ 1).
E.g., if we chosep= 0.3, we obtainQ= 0.2325.
The S-ring can be seen as a partially-observable Markov decision process (POMDP) (see Def. 6). The unobservable MDP (UMDP) is a subclass of the POMDP: No information on the state of the system is available. The S-ring equipped with the random or with the greedy policy is an UMDP.
The complete state of the system is known to the observer at each time point in the fully observable Markov decision process (MDP). The perceptron S-ring is an MDP.
POMDPs can be formulated as optimization problems: I.e. for a given POMDP, the decision maker selects the policy that gives the maximum expected fitness
Arrival Departure
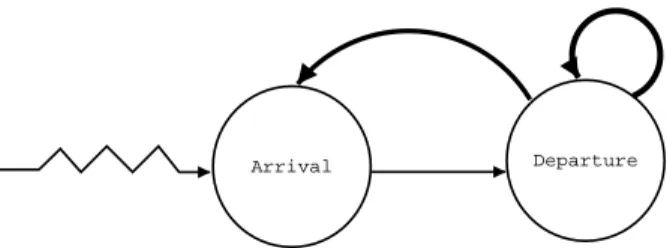
Figure 3: Event graph. The thin arrow represents an event at the beginning (arrival) scheduling an event at the end of the arrow (departure)immediately.
The heavy arrows indicate that the event at the beginning of the arrowmay schedule the event at the end of the arrow.
function value. There exist several dynamic programming approaches for solv- ing POMDP problems: Standard algorithms are value iteration and policy iter- ation [14, 15, 16, 17, 18]. A solution by dynamic programming and by numerical methods such as Q-learning, Kiefer-Wolfowitz stochastic approximation and an evolution strategy [19] is presented in [3].
The conclusions drawn from the theoretical and numerical analyses might be complemented by simulation experiments. The S-ring can be treated as a discrete-event-simulation model [12]. An arrival event schedules a departure event without any intervening time, whereas other events occurring at timeti
are scheduled at timeti+1 :=ti+ 1. Based on the event-graph method, where each event is represented by a node, and directed arrows show how events are scheduled from other events, the S-ring can be presented as shown in Fig. 3 [20].
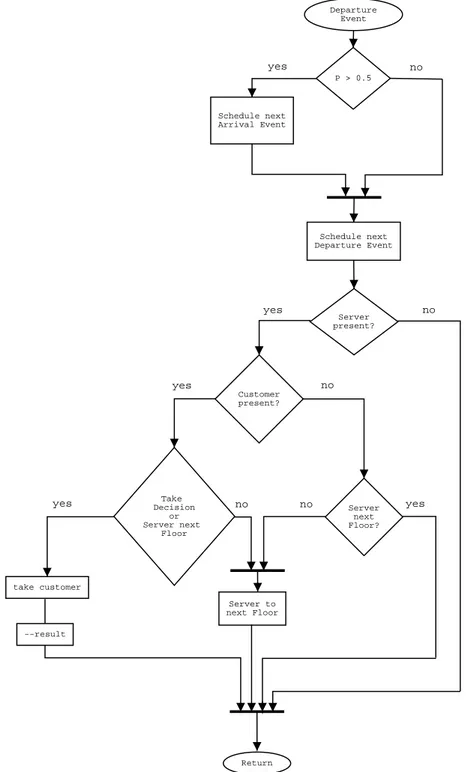
A flowchart for the departure event is shown in Fig. 4. An event-based vari- ant of the S-ring was implemented insimlib. simlib is a C-based simulation
‘language’, that provides functions to accumulate and to summarize simulation data, to schedule events, and to generate random variates [21].
4 The S-Ring Model as a Valid ESGC Model
The complete validation process requires subjective and objective comparisons of the model to the real system [21, 12]. Subjective comparisons are judgments of experts (‘face validity’), whereas objective tests compare data generated by the model to data generated by the real system. Building a model that has a high face validity, validating the model assumptions, and comparing the model input-output transformations to corresponding input-output transformations for the real system can be seen as three widely accepted steps of the validation process [22].
Important similarities of the S-ring with real elevator systems have been ob- served by experts: Both are found to show suboptimal performance when driven with simple greedy policies. They exhibit a characteristic instability, commonly
Departure Event
Server present?
Customer present?
yes
Take Decision
or Server next
Floor
take customer
yes
yes
--result
Server to next Floor
no Server
next Floor?
no
no yes
no
Return
P > 0.5
Schedule next Arrival Event yes
Schedule next Departure Event
no
Figure 4: Function depart. The probability of an arrival event is set to 0.5.
called bunching in case of elevators.
In the following we will consider input-output transformations more detailed.
The model is described by the function:
f : (Z, D)→Y (4)
Thus values of the uncontrollable input parametersZ and values of the control- lable decision variables (or of the policy)Dare mapped to the output measures Y. The model can be run using generated random variatesZi to produce the simulation-generated output measures. E.g. the S-ring model takes a policy and a system configuration and determines the expected average number of floors with waiting customers in the system using the generated random variates that determine a customer arrival event. If real system data is available, a statistical test of the null hypothesis can be conducted:
H0: E(Y) =µis tested againstH1: E(Y)=µ, (5) whereµdenotes the real system response andY the simulated model response.
We will extend these standard validation techniques by introducing a new ap- proach, that takes the choice of an optimization algorithm into account. The main idea is based on the observation that the complexity of a model can only be seen in relation to the associated optimization algorithm [23]: The functions Hn,b:{0,1}n→ {0,1}defined byHn,b(b) = 1 andHn,b = 0 ifa=b(‘needle in a haystack’) can be extremely difficult for (standard) genetic algorithms, whereas they are simple for the degenerated search heuristic that generates the solution bdeterministically.
We additionally assume that every problem requires a specific algorithm param- eter settinga[24]. The vectoraincludes the exogenous parameters such as the population size in evolutionary algorithms or the starting temperature for the cooling schedule in simulated annealing. Fran¸cois and Lavergne [25] introduce a methodology that classifies problem classes based on the parameterization of the underlying optimization algorithm. This methodology is extended in the following to ‘optimization via simulation’ approaches. We will give a definition first:
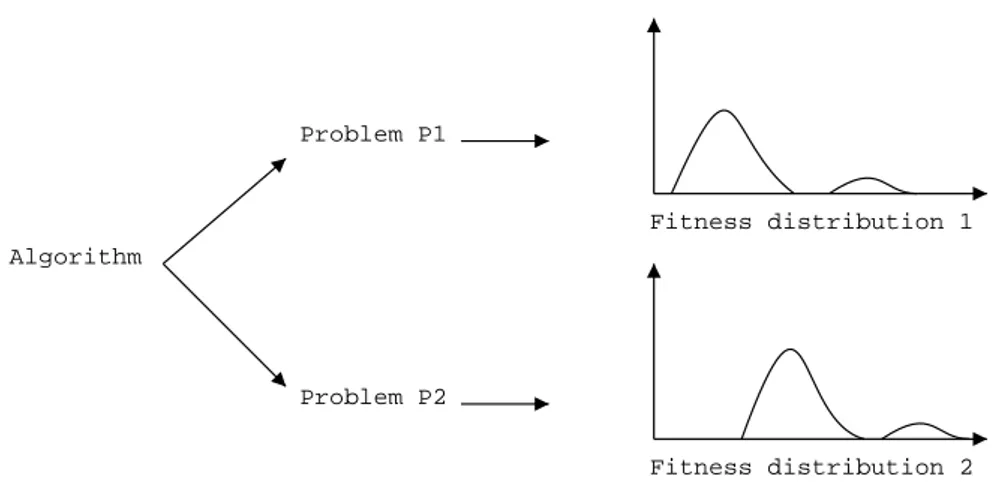
Definition 1 (Algorithm based equivalence) Let the regression modelE(Y) = Xβ model the functional relationship between the algorithm A and its expected performance E(Y) for the optimization problem P. α denotes a new variable that specifies the underlying optimization problem P. Two optimization prob- lems P1 and P2 are equivalent with respect to an algorithm A (P1 ≡A P2), if there are no interactions between the model parameters β and the problem parameterα.
Remark 1 P1≡AP2does not require that the main effect ofαis insignificant.
Remark 2 If P1 ≡A P2, then an optimization algorithm A with parametriza- tionashows a similar behavior on problemP1 and problem P2.
Algorithm
Problem P1
Problem P2
Fitness distribution 1
Fitness distribution 2
Figure 5: Schematic representation of algorithm based validation. A regression model describes the functional relationship between the parameter setting of an algorithm and its expected performance. Two optimization problems are equiv- alent, if there are no interactions between the problem and model parameters.
Eq. 4 can be written equivalently asfP,Q: (Z, a)→Y,where Y is the perfor- mance of an algorithm with the exogenous parameter settingafor the problem P and the quality functionQ.
Similar to the test from Eq. 5 the following statistical test to identify equivalent problems can be performed: The null hypothesisH0 :α= 0,is tested against the alternativeH1:α= 0 (P1 andP2 are not equivalent).
Our goal is to show that the S-ring model is a valid ESGC-model, so that we can transfer results from the S-ring to the lift model. The first step in algorithm based validation (ABV) requires the selection of an optimization algorithm.
Evolution strategies (ES), that are applicable to many optimization problems, have been chosen in the following [19, 26]. Recent publications propose gen- eralized linear models (GLMs) [27, 25] or regression trees [28]. GLM analysis provides a unified approach for linear and non-linear models with both normal and non-normal responses. A generalized linear model that is based on the Gamma distribution and the canonical link is used in the following analysis.
A factorL with two levels{Sring, Lift} is introduced to check for interactions between algorithm parameters andL. Starting from the over fitted model we perform a backward elimination procedure.3 The final model shows that there are no significant interactions between the problemL and other factors.4 We
3The model search (determination of the predictors, their orders and interactions) can be based on the Akaike Information Criterion (AIC). Backward elimination starts with an over- fitted model, whereas forward selection adds a new variable to the model at each stage of the process.
4Another way to test for interactions between the factorLand other factors is to compare two nested modelsM2 ⊂M1. M1 includes interactions between Land other factors of the reduced model, whereas interactions are omitted inM2. M1: Y ∼ Function * model is
update method 1.0
1.5 2.0
2.5
3.0 0.1 arrival rate
0.2 0.3
0.4 0.5 fitness
0 5 10
Default Controller
update method 1.0
1.5 2.0
2.5
3.0 0.1 arrival rate 0.2
0.3 0.4
0.5 fitness
0 5 10
Optimized Controller
Figure 6: Two NN controllers dealing with different update methods (sequential=1, random=2, quasi-parallel=3) and arrival rates on an S-ring with 20 floors and 6 servers. Left hand: Default controller, all weights are 1.0, right hand: ES-optimized controller. Each point represents a simulation run with 1 million steps. Lower values are better. Planes are only added to enhance visibility.
can conclude that the S-ring problem and the lift problem are equivalent with respect to ES. Therefore the S-ring model can be seen as a valid simplification of the lift model. Rem. 2 justifies the development of a simplified ESGC model: An improved (tuned) parameterizationaof algorithm A and problem P1 (S-ring) can be applied to optimize the complex optimization problemP2(lift).
5 S-ring Model Extensions
The S-ring model has been introduced as simplified elevator system model with very limited parameters and features. To improve our understanding of its applicability, it makes sense to explore two types of changes to this model.
Firstly, effects of mechanisms looking inappropriate compared to a real elevator system shall be investigated. Secondly, features not existent in the S-ring model but obviously present in the real-world situation may be subsequently added to find out if they influence the design of a controller significantly.
For our experiments, we used a default NN controller with all weights set to 1.0 and a previously optimized controller that had been adapted to an arrival rate of 0.3. The (10+50)-ES performing the optimization was allowed 50,000
compared toM2: Y ∼ Function + model. The symbol ‘+’ denotes independent factors and the symbol ‘*’ denotes interactions between two factors. ANOVA indicates that there is no significant difference if interactions betweenLand the other factors are included.
arrival rate
0.1 0.2 0.3 0.4 0.5
server capacity 10 12 14 16 18 20 fitness
5 10 15
Default Controller
arrival rate
0.1 0.2 0.3 0.4 0.5
server capacity 10 12 14 16 18 20 fitness
5 10 15
Optimized Controller
Figure 7: Default (left) and optimized NN controller performance on a wide range of arrival rates and server capacities on an S-ring with 20 floors and 6 servers. Each point represents a simulation run with 1 million steps.
evaluations with 1,000 simulation steps each. We used self-adaptation with τ= 0.3,σ∈[0.01,1.0] and re-evaluation of surviving parents.
The S-ring model has been defined in a way that favors its analysis as Markov decision process: Within a full circle, floor states are updated in sequence. Alter- natively, one can imagine random order or even quasi-parallelism. The general behavior of our model must remain stable whatever variant is chosen because the update order of the real system we want to model is usually not known beforehand. We cannot yet prove that this is true for all possible configurations and controllers, but simulations done so far (see Fig. 6) indicate that the S-ring behavior is very similar for different update orders.
An obvious difference between real-world elevator cars and S-ring ones is that the latter have infinite capacity. Previously, we assumed that it is reasonable to neglect capacities for a wide range of parameter settings. Simulation runs depicted in Fig. 7 show that this is indeed the case. Only for extreme pas- senger flows congestion occurs and waiting customers sum up to large numbers.
However, the turning point can be shifted upwards with a good controller policy.
6 Summary and Outlook
We proposed a simplified elevator supervisory group controller, the so-called S-ring. The S-ring can serve as a helpful benchmark problem for evaluating and comparing search heuristics. Different techniques for its analysis and simula- tion were presented. A new method was developed to validate the S-ring as an ESGC model by taking an optimization algorithm into account. Furthermore,
we demonstrated how new features can easily be added to the S-ring.
The current work can be extended by implementing different parallel optimiza- tion strategies. Additionally, this methodology is transferable to other traffic systems or, more general, other distributed control problems. Hence, we hope that the S-ring is an interesting real-world related optimization problem for other researchers.
Acknowledgments
This work is a product of the Collaborative Research Center 531, ‘Computa- tional Intelligence’, at the University of Dortmund and was supported by the Deutsche Forschungsgemeinschaft.
Definitions
Definition 2 (S-ring) The S-ring is the tuple
S= (n, m,X, x0,A,O, f, o, r, g),
wheren∈INandm∈INare the number of queues and servers respectively. X, A, and O denote finite set of states, actions and observation respectively, o is an observation function, and x0 denotes the initial state. X is defined as the set of binary vectors
x= (sn−1, . . . , s0, cn−1, . . . , c0)∈IB2n with n−1
i=0 si = m. Let g(t) : IN+0 → {0,1,2, . . . , n−1} be the function that determines the number of the floor queue scanned at time stept:
g(t) :=n−1−(tmodn). (6)
h:X ×IN+0 →IB3is a helper function, that extracts three bits (customer present on the actual floor, server present on the actual floor, and server present on the next floor) from the state vectorx:
h(x, t) :=(cg(t), sg(t), sg(t−1)) (7)
=(x2n−1−g(t), xn−1−g(t), xn−1−(g(t−1) modn)).
The transition probability function
f :X × A ×IN+0 × X →[0,1] (8) defines probabilities for a state transition from statexto statex depending on the actionaperformed. Finally,
r:X × X ×IN+0 →ZZ (9) is the reward function. S denotes the set of all possible S-ring configurations.
Definition 3 (Decision rule) A decision rule is a mapping from observations to actions:
δ:O → A, δ(o) ={0,1}. (10) Definition 4 (Policy) A sequence (δ0, δ1, δ2. . .) of decision rules is called a policy.
Definition 5 (Heaviside Function) θ(z) =
0, if z <0
1, if z≥0, (11)
Definition 6 (POMDP) A partially-observable Markov Decision Process (POMDP) Mis a tuple M={X, x0,A,O, f, o, V}, where:
• X denotes a finite or countable set of states, x0 ∈ X is the initial state, A denotes a set of actions, and O denotes a set of observations. If not mentioned otherwise, the Markov assumption is made in general: Each state has all information necessary to predict the next event and action.
• f : X × A × X → [0,1] defines probabilities for a state transition from state xto state y depending on the action a performed. f(x, a, y) is the probability that state y is reached from state x on action a. Therefore, each action can be represented by a state transition table of sizeN ×N, or by a state transition matrixPk with entries (pkij) as defined in Eq. 1.
The probabilities in the transition matrix take also exogenous effects into account.
• o : X → O denotes the observation function: The corresponding set of observationsOcan be interpreted as a set of messages sent to the decision maker after an action is completed [18].
• And finally, the value function V :H →IR. If V is time-separable, then it can be written as a combination of the reward function r and the cost function c, that are defined as follows:
r:X →IR, andc:X × A →IR. (12)
References
[1] G. Barney.Elevator Traffic Analysis, Design and Control. Cambridg U.P., 1986.
[2] A.T. So and W.L. Chan. Intelligent Building Systems. Kluwer A.P., 1999.
[3] S. Markon and Y. Nishikawa. On the analysis and optimization of dy- namic cellular automata with application to elevator control. In The 10th Japanese-German Seminar, Nonlinear Problems in Dynamical Systems, Theory and Applications. unknown, Noto Royal Hotel, Hakui, Ishikawa, Japan, September 2002.
[4] R.H. Crites and A.G. Barto. Elevator group control using multiple rein- forcement learning agents. Machine Learning, 33(2-3):235–262, 1998.
[5] H.-P. Schwefel, I. Wegener, and K. Weinert, editors. Advances in Com- putational Intelligence – Theory and Practice. Natural Computing Series.
Springer, Berlin, 2003.
[6] S. Markon, D.V. Arnold, T. B¨ack, T. Beielstein, and H.-G. Beyer. Thresh- olding – a selection operator for noisy ES. In J.-H. Kim, B.-T. Zhang, G. Fogel, and I. Kuscu, editors,Proc. 2001 Congress on Evolutionary Com- putation (CEC’01), pages 465–472, Seoul, Korea, May 27–30, 2001. IEEE Press, Piscataway NJ.
[7] M. L. Siikonen. Planning and Control Models for Elevators in High-Rise Buildings. PhD thesis, Helsinki Unverstity of Technology, Systems Analysis Laboratory, October 1997.
[8] S. Markon. Studies on Applications of Neural Networks in the Elevator System. PhD thesis, Kyoto University, 1995.
[9] T. Beielstein, C.P. Ewald, and S. Markon. Optimal elevator group control by evolution strategies. InProc. 2003 Genetic and Evolutionary Computa- tion Conf. (GECCO’03), Chicago, Berlin, 2003. Springer.
[10] Thomas Beielstein, Sandor Markon, and Mike Preuß. A parallel approach to elevator optimization based on soft computing. In T. Ibaraki, editor, Proc. 5th Metaheuristics Int’l Conf. (MIC’03), pages 07/1–07/11 (CD–
ROM), Kyoto, Japan, 2003.
[11] M. Mundhenk.The complexity of planning with partially observable Markov decision processes. Habilitationsschrift, Friedrich-Schiller-Universit¨at Jena, 2001.
[12] J. Banks, J. S. Carson II, B. L. Nelson, and D. M. Nicol. Discrete Event System Simulation. Prentice Hall, 2001.
[13] T. Beielstein and S. Markon. Threshold selection, hypothesis tests, and DOE methods. In David B. Fogel, Mohamed A. El-Sharkawi, Xin Yao, Garry Greenwood, Hitoshi Iba, Paul Marrow, and Mark Shackleton, ed- itors, Proceedings of the 2002 Congress on Evolutionary Computation CEC2002, pages 777–782. IEEE Press, 2002.
[14] R. A. Howard. Dynamic Programming and Markov Processes. MIT Press, 7th edition, 1972.
[15] Vincent D. Blondel and John N. Tsitsiklis. A survey of computational complexity results in systems and control. Automatica, 36(9):1249–1274, 2000.
[16] J. Goldsmith and M. Mundhenk. Complexity issues in markov decision pro- cesses. In Proc. of 13th Conference on Computational Complexity. IEEE, 1998.
[17] M. Mundhenk, J. Goldsmith, C. Lusena, and E. Allender. Complexity of finite-horizon markov decision process problems. Journal of the ACM, 47(4), 2000.
[18] C. Boutilier, T. Dean, and S. Hanks. Decision-theoretic planning: Struc- tural assumptions and computational leverage. Journal of Artificial Intel- ligence Research, 1999.
[19] H.-G. Beyer and H.-P. Schwefel. Evolution strategies – A comprehensive introduction. Natural Computing, 1:3–52, 2002.
[20] T. K. Som and R. G. Sargent. A formal development of event graphs as an aid to structured and efficient simulation programs. ORSA J. Comp., 1989.
[21] A.M. Law and W.D. Kelton.Simulation Modelling and Analysis. McGraw- Hill Series in Industrial Egineering and Management Science. McGraw-Hill, New York, 3rd edition, 2000.
[22] T.H. Naylor and J.M. Finger. Verification of computer simulation models.
Management Science, 2:B92–B101, 1967.
[23] B. Naudts and L. Kallel. A comparison of predictive measures of problem difficulty in evolutionary algorithms. IEEE Transactions on Evolutionary Computation, 4(1):1–15, April 2000.
[24] D.H. Wolpert and W.G. Macready. No free lunch theorems for optimization.
IEEE Transactions on Evolutionary Computation, 1(1):67–82, 1997.
[25] O. Fran¸cois and C. Lavergne. Design of evolutionary algorithms – a sta- tistical perspective. IEEE Transactions on Evolutionary Computation, 5(2):129–148, April 2001.
[26] Thomas Beielstein, Sandor Markon, and Mike Preuß. Algorithm based validation of a simplified elevator group controller model. In T. Ibaraki, editor, Proc. 5th Metaheuristics Int’l Conf. (MIC’03), pages 06/1–06/13 (CD–ROM), Kyoto, Japan, 2003.
[27] P. McCullagh and J.A. Nelder. Generalized Linear Models. Chapman and Hall, 2nd edition, 1989.
[28] T. Bartz-Beielstein. Experimental analysis of search heuristics – overview and comprehensive introduction. (submitted), 2004.