Introduction to tropical
meteorology and deep convection
Roger K. Smith
University of Munich
TMD Lecture 1
A satpix tour of the tropics
The zonal mean circulation (Hadley circulation), Inter- Tropical Convergence Zone (ITCZ)
Field experiments
Macroscale circulations, The Walker circulation, Monsoons
Synoptic scale weather systems, tropical waves
Moist convection and convective systems
The Madden-Julian Oscillation, Westerly wind bursts
Concluding remarks
Topics
INDO IR 01010510
GMS IR 01022621
GOES IR 00112909
EUMETSAT Movie
Principal land and ocean areas between 40°S and 40°N.
The shaded areas show tropical highlands (over 1000 m).
From Nieuwolt (1977)
How does one define the tropics?
Tropic of Capricorn 23.5os Tropic of Cancer 23.5oN
Maritime continent
A satpix tour of the tropics
The zonal mean circulation (Hadley circulation), Inter- Tropical Convergence Zone (ITCZ)
Field experiments
Macroscale circulations, The Walker circulation, Monsoons
Synoptic scale weather systems, tropical waves
Moist convection and convective systems
The Madden-Julian Oscillation, Westerly wind bursts
Concluding remarks
Next topic
Radiative heat balance
Zonally averaged components of the absorbed solar flux and emitted thermal infrared flux at the top of the atmosphere.
(after Vonder Haar and Suomi, 1971, with modifications)
F (W m-2 )
100 0 200 300
90 50 30 10 0 10 30 50 90 South Latitude North
Absorbed solar flux Emitted infrared flux energy gain
energy loss
+
- -
Mean annual precipitation
Mean annual precipitation as a function of latitude.
(after Sellers, 1965)
2000
1500 1000
500 mm
0
90 60 40 30 20 10 0 10 20 30 40 60 90 North Latitude South
mean meridional circulation
The mean meridional circulation and main surface wind regimes.
after Defant, 1958
ITCZ
ITCZ
A satpix tour of the tropics
The zonal mean circulation (Hadley circulation), Inter- Tropical Convergence Zone (ITCZ)
Field experiments
Macroscale circulations, The Walker circulation, Monsoons
Synoptic scale weather systems, tropical waves
Moist convection and convective systems
The Madden-Julian Oscillation, Westerly wind bursts
Concluding remarks
Next topic
Field Experiments in the Tropics
Global Atmospheric Research Programme (GARP) Atlantic Tropical Experiment (GATE) July 1974
The MONsoon EXperiment (WMONEX December 1978, SMONEX May – August, 1979)
Australian Monsoon EXperiment & Equatorial Mesoscale EXperiment (AMEX, EMEX) January – February 1987
Tropical Oceans Global Atmosphere Couple Ocean Atmosphere Response Experiment (TOGA COARE) November 1992 – February 1993
DYNAMO (Dynamics of the MJO)/CINDY(Cooperative Indian Ocean Experiment on Intraseasonal Variability in Year 2011)
A satpix tour of the tropics
The zonal mean circulation (Hadley circulation), Inter- Tropical Convergence Zone (ITCZ)
Field experiments
Macroscale circulations, The Walker circulation, Monsoons
Synoptic scale weather systems, tropical waves
Moist convection and convective systems
The Madden-Julian Oscillation, Westerly wind bursts
Concluding remarks
Next topic
850 mb 200 mb
JJA
200 mb
850 mb
DJF
Velocity potential
V k
( k ) k
2
We can separate the three-dimensional velocity field into a rotational part and a divergent part (see e.g. Holton, 1972, Appendix C.)
rotational nondivergent
irrotational divergent
( )
0
( ) 0
k ( )
2Upper tropospheric (200 mb) mean seasonal velocity potential indicating the divergent part of the mean seasonal wind which
is proportional to .
(Adapted from Krishnamurti et al., 1973).
OLR < 225 W m-2
month
From Lau & Chan, 1983
Walker circulation
A satpix tour of the tropics
The zonal mean circulation (Hadley circulation), Inter- Tropical Convergence Zone (ITCZ)
Field experiments
Macroscale circulations, The Walker circulation, Monsoons
Synoptic scale weather systems, tropical waves
Moist convection and convective systems
The Madden-Julian Oscillation, Westerly wind bursts
Concluding remarks
Next topic
Monsoons
July
SE Asian Monsoon
January
Australasian Monsoon
South America: January climatology
200 mb wind 850 mb wind
(From Webster, 1983)
An example of monsoon variability
1963
1971 West coast
of India
A satpix tour of the tropics
The zonal mean circulation (Hadley circulation), Inter- Tropical Convergence Zone (ITCZ)
Field experiments
Macroscale circulations, The Walker circulation, Monsoons
Synoptic scale weather systems, tropical waves
Moist convection and convective systems
The Madden-Julian Oscillation, Westerly wind bursts
Concluding remarks
Next topic
Time-longitude section of vis imagery - latitude band 10 -15 N
From Wallace, 1970
0107 01/06
0108
time
Fig. 1.23
GMS – IR 25 Dec 1978
MSLP 25 Dec 1978 Winter MONEX
A B
C
From Webster, 1983
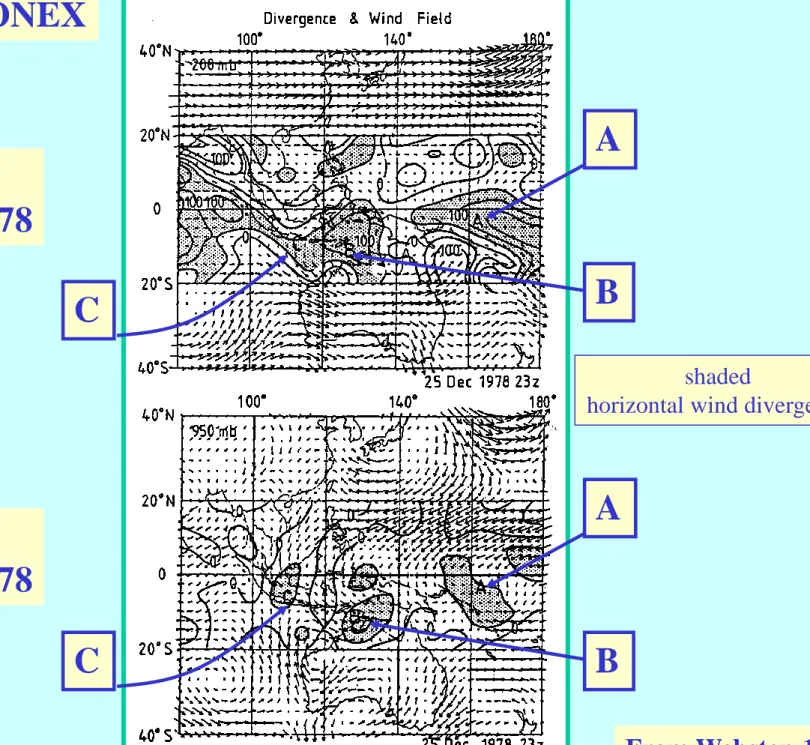
Fig. 1.24
250 mb 25 Dec 1978
850 mb 25 Dec 1978
Winter MONEX
A
C B
A
B C
shaded
horizontal wind divergence
From Webster, 1983
The variation of surface pressure at Darwin for the period 23 - 28 Dec. 1978.
Easterly waves over Africa
WV Imagery 17 June 1997 00Z
Tropical cyclones
TC tracks (1979-1988)
Super typhoon Wynnie 11 Aug 1997
A satpix tour of the tropics
The zonal mean circulation (Hadley circulation), Inter- Tropical Convergence Zone (ITCZ)
Field experiments
Macroscale circulations, The Walker circulation, Monsoons
Synoptic scale weather systems, tropical waves
Moist convection and convective systems
The Madden-Julian Oscillation, Westerly wind bursts
Concluding remarks
Next topic
Moist Convection
Trade Cumuli
The tropical troposphere
q z km
29oC
-73oC 15
-121oC
observed
observed -150oC +150oC
77oC
Conclusion: Deep tropical circulations cannot be dry adiabatic
The role of diabatic processes
z km 15
Conclusion: Deep convection occupies a small fractional area Latent
heat release opposes adiabatic
cooling
Radiative cooling opposes adiabatic
warming
ITCZ subtropical high Fast
ascent
Slow descent
Successive locations of radar reflectivity contours in a tropical
squall line.
From Chang et al. (1987)
Radar reflectivity contours (dBZ) of a tropical squall line observed during
COPT81 (Ivory Coast, West Africa).
Horizontal cross-section at low levels (0.5 – 1.5 km).
Radar reflectivity contours (dBZ) of a tropical squall line observed during COPT81 (Ivory Coast, West Africa).
Vertical cross-section along the axis of propagation.
Types of convection
Hector Movie
A satpix tour of the tropics
The zonal mean circulation (Hadley circulation), Inter- Tropical Convergence Zone (ITCZ)
Field experiments
Macroscale circulations, The Walker circulation, Monsoons
Synoptic scale weather systems, tropical waves
Moist convection and convective systems
The Madden-Julian Oscillation, Westerly wind bursts
Concluding remarks
Next topic
From JAS, Sept. 1972
Madden-Julian Oscillation
From Webster 1987
Madden-Julian Oscillation
MJO
Indian Ocean Feb/Mar 2001
06/02 07/02 13/02
17/02 24/02 06/03
West Pacific Ocean – Feb 2001
06/02 09/02 13/02
21/02 24/02 29/02
http://www.bom.gov.au/bmrc/clfor/cfstaff/matw/maproom/OLR/hov.last6mths.anom.S.gif
GOES-9 12 UTC 2 Dec 1997 10.7 micron image
Westerly wind bursts
The extended Held-Hou Model
Y- Eq. Y0 Y1 Y+ z
Summer Cell Winter
Cell
Solar heating maximum
Streamline dividing the winter and summer cells
Winter cell
Summer cell
Solution for qM0 andY
Eq. Pole
qqy
u = UM
u = 0 y
q
2
4 2
0
M 0 2 E0 2
2
4 2
0
M 0 2 E0 2
Y Y
10a gH 3a
Y Y
2a gH a
q q
q - q -
q q
q - q -
qYqY
1/ 2
2 0
2
M 0 E0 2 2
0
5 gH
Y 3
5 gH 18a
q
q q q - q
q Take q0 = 255 K, q= 40 Kand H = 12 km Y 2400 kmand q0.9 Kcooler than q. in agreement with obs.
unknowns
Y
Horizontal structure of the Kelvin waveand of a westward propagating Mixed Rossby-gravity wave.
Parcel motions Kelvin wave
Mixed R-G wave
2 -2u Y v- dv
dY
2 - 2 Y v -dv
dY
( ) exp ( )
v Y vn -12Y2 Hn Y
dv
dY Y v Y dH
n dY
n
exp
- -21 2
dH
dYn 2n Hn-1( )Y Hn1( )Y 2YHn( )Y -2n Hn-1( )Y Scale and put y = LEY
Now
and
Properties of the Hermite polynomials
Interaction between moist convection and the large-scale flow.
What are the controls on deep convection?
Models usually don’t get the diurnal variation correct.
No generally accepted theory of the Madden-Julian Oscillation.
Weather forecasting in the tropics is still very difficult compared with that in the middle latitudes!