University of Bamberg Chair of Labour Studies Prof. Dr. Olaf Struck
WORKING PAPER – No. 5 – Juli 2011
Individual, Firm-specific and Regional Effects on Internal Employment
Trajectories in Germany
With Special Focus on
Education, Further Training and Skill Formation
Matthias Dütsch Olaf Struck
Otto-Friedrich-University of Bamberg Lichtenhaidestraße 11a
96045 Bamberg
Phone ++49 (0)951 2692 Fax ++49 (0)951 5637
Email margrit.seuling@uni-bamberg.de http://www.uni-bamberg.de/arbeitswiss/
Verbundprojekt BOPS, gefördert durch:
“Labourers have become capitalists not from a diffusion of the ownership of corporation stocks (…) but from the acquisition of knowledge and skills that have economic value.”
– Schultz 1961: 5 –
1 Introduction
The employment period is an important and central stage in the life course which influences the opportunities in life in different ways (Kreckel 1990; Kocka and Offe 2000; Vobruba 1990, 2000). It is widely known that the success of employment greatly depends on education (Boockmann and Steffes 2010; Struck 2006; Erlinghagen 2005; Diewald and Sill 2004;
Hillmert et al. 2004; Grotheer et al. 2004; Bender et al. 2000). In his international literature review Card (1999: 1802) concluded: “Education plays a central role in modern labor mar- kets. Hundreds of studies in many different countries and time periods have confirmed that better-educated individuals earn higher wages, experience less unemployment, and work in more prestigious occupations than their less-educated counterparts.“ Education can thus be considered as a key determinant for employment trajectories by having both a selection func- tion at the transition from education to employment and determining the returns to education (Allmendinger 1989; Hillmert 2001; Müller and Shavit 1998).1
Against this backdrop, the question will be raised if there are additional factors diminishing the economic usability of knowledge and skills. This paper deals with the following ques- tions:
1. What is the effect of education on employment trajectories?
2. Can life course costs of bad employment histories, which are for example caused by poor starts to employment careers, be observed?
3. Do certain characteristics of firms influence employment careers?
4. How strong is the impact of regional disparities on employment trajectories?
1 This implies that education is a central factor of social inequality by causing a vertical social exclusion (Kreck- el 1990).
The following section gives a brief overview of the related literature as well as theoretical considerations. The data and the econometric methods used for the analysis are described in the third section. Section 4 contains the estimation results and the final section draws some conclusions.
2 Related Literature and Theoretical Considerations
As mentioned above, there is much evidence for the significance of education; therefore, this section deals with the three factors considered as relevant for employment trajectories and thus for the usage of knowledge and skills – the previous labour market experiences, firms and regions.
2.1 Previous Labour Market Experiences and the career path
The first aspect, which is to be addressed, is the impact of previous labour market experiences on the future career path; according to cohort analyses, there seem to be life course costs of poor starts to employment careers. It is assumed that changing labour market structures caused by modernisation and economic transformation processes have especially affected en- try-level employees’ career paths; particularly, modernisation processes would have modified internal structures of firms and thus the related promotion prospects (Blossfeld 1986; Hogan 1981; Mayer and Blossfeld 1990). The economic transformation process seems to have in- creased the usage of atypical employment and to have altered mobility patterns by a growth in unemployment and non-employment periods (Giesecke and Heisig 2010; Grotheer et al.
2004; Struck 2006). It is hypothesised that these negative developments could have influ- enced further employment trajectories; according to this, several periods and transitions might not be isolated over the life course, but might be linked in a cumulative way.
Heckman and Borjas (1980) analysed different state dependences in their research on unem- ployment. In this paper, we allow for two variants of state dependences: the “lagged duration dependence” and the “duration dependence”. First, lagged duration dependence accounts for the fact that the probabilities of remaining unemployed or becoming unemployed depend on the length of previous unemployment spells; this can arise if unemployment has resulted in a loss of skills and productivity-enhancing work experience or because horizons have been shortened during the unemployment spell (Heckman and Borjas 1980; Pissarides 1992). Fur-
thermore, stigmatisation effects would have diminished the probability to find employment (Blanchard and Diamond 1994; Biewen and Steffes 2010); this is termed as “scarring-effect”
of unemployment (Arulampalam 2001: 585). In the worst case those employees may become trapped in a “low-pay/no-pay cycle” (Arulampalam et al. 2001: 557). Second, duration de- pendence indicates the effect that the probability of remaining unemployed depends on the length of time the worker has been unemployed in his current unemployment spell due to fur- ther negative signals (Heckman and Borjas 1980). This argument will be turned around for this analysis; we assume that the probability of remaining employed depends on the length of time the worker has been currently employed, for example because of productivity-enhancing work experience, even though he had been unemployed before. This is to be assessed in the following.
2.2 Firm-specific Factors and the career path
Little attention has been paid to firm-specific factors on employment trajectories up until now.
Although referring to the “new structuralism, it is important to account for firm characteris- tics” (Baron and Bielby 1980: 737); thus, firms’ internal processes and structures influence individual career opportunities, wages and status attainment (Ahrne 1994; Baron and Bielby 1980; Struck 2006). Independent firm-specific effects of industrial sectors, firm sizes and per- sonnel structures could be found (Gerlach and Stephan 2005; Grotheer et al, 2004; Struck 2006). In recent years the importance of further training has increased; further training is con- sidered to be highly relevant for attaining status as well as competitive positions. Individuals, organisations and societies are assumed to benefit from that against the backdrop of demo- graphic change; consequently, lifelong learning has become considerably more significant in public discussion to counteract the declining half-life of knowledge which requires a perma- nent adjustment to modern technologies and work processes (Becker and Hecken 2009;
Büchel and Pannenberg 2004; Pfeifer and Reize 2000). This is due to Human Capital Theory which emphasises that education and training raises the productivity and efficiency of work- ers by increasing the level of cognitive ability and human capability (Becker 1962; Mincer 1962; Oi 1962). Recent literature indicates positive effects of further training on wages (Büchel and Pannenberg 2004; Pischke 2001; Wolter and Schiener 2009), whereas the impact on the risk of unemployment is ambiguous (Lechner 1999; Christensen 2001; Pannenberg 2001); furthermore, it remains unclear whether further training increases or decreases labour mobility. Düll and Bellmann (1999) and Becker (1993) find both enhanced seniority and heightened labour mobility; Hübler and König (1999) however, cannot determine a relation
between further training and mobility. We therefore assume that it is to be distinguished be- tween good and bad opportunity structures. It is to be tested whether firms providing further training offer good opportunity structures that lead to more stable jobs and higher wages as a result of increased labour productivity.
2.3 Region-specific Factors and the career path
The impact of regional disparities on employment trajectories has hardly been researched up until now. Neoclassical Labour Market Theory treats regional differences, e.g. with regard to economic power, unemployment rates or average wages, as short-term phenomena which can be compensated by long-term factor movements; however, the argument of an inter-regional long-term equalisation is only partially sustainable due to persistent heterogeneities (Blien 2001; Krugman 1991; Möller und Tassinopoulos 2000). In contrast to the Neoclassical La- bour Market Theory, spatial economics, especially the “New Economic Geography”
(Krugman 1991), have stimulated the emergence of a (new) wave of empirical work concern- ing geographical analysis; thus, regional heterogeneities cause a diverse distribution of eco- nomic activities. The decisions of firms about locations are assumed to be affected by urbani- sation effects, which apply to firms of all industries, and localisation effects, which have an impact on only one industry (Fujita et al. 2001; Krugman 1991, 1998).
Another approach of regional research, Endogenous Growth Theory, has established a link between qualification structures of the regional workforce and the growth potential. It negated the assumption of the Neoclassical Labour Market Theory that economic growth is deter- mined exogenously in the long term (Lucas 1988); thereby, the Endogenous Growth Theory refers back to the Human Capital Theory (Becker 1962, 1975; Mincer 1962; Oi 1962) and emphasises the dependence of regional growth potential on the stock of skills and knowledge available in this region. Due to the fact that employees’ productivity increases with their ac- quired human capital, the regional human capital endowment is considered to be an “engine of growth” (Lucas 1988), even without technological progress. Within this model, all groups of workers and firms in a region might benefit from a selective growth of productivity in cer- tain groups of workers (e.g. the high skilled) as a result of positive external effects by increas- ing wages. These spillover effects may occur for example due to signalling effects and supply chains. Blien and Wolf (2002) as well as Farhauer and Granato (2006) stated that regional growth in employment is positively influenced by the share of vocational trained and high- qualified workers; furthermore, a divergent development in terms of employment and wages
was observed due to a increased skill segregation (Gerlach et al. 2002; Schlitte et al. 2010;
Stephan 2001). This study will explore regional determinants in more detail.
3 Data and Method
3.1 Data and Sample Definition
The database of the following empirical analyses is the German LIAB, a linked employer- employee dataset of the Institute for Employment Research, integrates the IAB Establishment Panel and administrative data on employees (Jacobebbinghaus 2008)2. The first part, the Es- tablishment Panel is a representative annual survey of 16,000 establishments (Fischer et al.
2008); the second part, data on employees is based on two different sources. First, the “Em- ployee-History” contains administrative data on individual employment histories of records submitted by employers to the German public pension insurance. The reliability of this ad- ministrative data is high, as misreporting is a summary offence; an exception concerns indi- vidual information such as the education variable which was adjusted by using imputation rules (Fitzenberger et al. 2005). Second, “Benefit Recipient History” is data on the receipt of unemployment benefits, unemployment assistance or maintenance allowance. Overall, this linked employer-employee dataset is exhaustive on the number of workers covered within the establishment sample.
Additionally, the LIAB dataset and data on regional characteristics deriving from two sources have been merged. Federal Employment Services (BA) made information about economic sectors due to employees per industrial sector available; Federal Institute for Research on Building, Urban Affairs and Spatial Development (BBSR) provided us with data on unem- ployment rates, GDP per capita, types of region regarding population density and centrality of regions and the share of students. This data is expressed as yearly averages. The indicators ex- ist for 96 planning regions („Raumordnungsregionen“) which are considered to adequately describe regional labour markets (Schwarze 1995; Rendtel and Schwarze 1996); thus, this generated dataset permits simultaneous analyses of the employer and the employee sides as well as the regional context.
2 We use the LIAB longitudinal version 2.
Data is restricted to persons aged 25 to 52 who are full-time employed to exclude individuals in vocational training or in work during university vacations, as well as to avoid confusion be- tween job exit and early retirement. If a worker is simultaneously observed twice or more of- ten, the employment spell generating the highest income is used. Finally, the composition of the sample is illustrated in Figure 1.
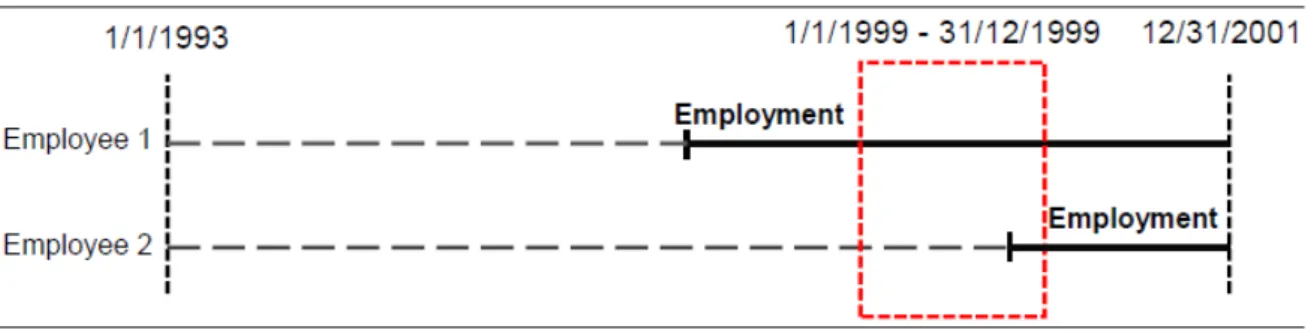
Figure 1: Identification of observed employees
It can be seen that employment histories are left-censored and thus can be tracked from 1993 to 2002; the red rectangle displays the sampling window. The selected sample contains work- ers having already been employed on 1/1/1999 (e.g. employee 1 in the figure) or have been hired between 1/1/1999 and 31/12/1999 (e.g. employee 2 in the figure). These requirements leave us with a sample of 294,419 persons, 1,559 establishments and 96 regions („Raumord- nungsregionen“).3
3.2 Econometric Method
In the following, multivariate data analyses are performed including individuals, firms and re- gions. This hierarchical structure of the data is to be taken into account when choosing an es- timation procedure. Moulton (1986, 1990) mentioned that the inclusion of macro- and meso- variables in a conventional regression analysis leads to an inefficient estimation of the coeffi- cients and to biased standard errors; to solve this problem, three-level models with random ef- fects are estimated. Based on this three-level approach employment trajectories are evaluated in a two-stage procedure: First, job tenure is estimated by using a Piecewise-Constant Expo- nential (PCE) model (Rabe-Hesketh and Skrondal 2008; Skrondal and Rabe-Hesketh 2003):
3 Descriptive statistics of individual, firm-specific and region-specific characteristics are reported in tables 4 to 6 in the appendix.
( ) ( ) ( )
ijkijk t h t
h = 0 expν , and νijk =x'ijk β +zijk(2)'ζ(j2) +rijk(3)'ζk(3)
Here h0
( )
t represents a regression constant for period t . νijk is a vector with corresponding explanatory variables at the individual( )
x'ijk , firm( )
zijk(2)' and region( )
rijk(3)' levels. Finally, β are fixed effects, whereas ζ(j2) and ζk(3) represent random intercepts for firms and regions.Second, an independent competing risks model with three destination states4
• upward within-firm mobility (increase in wages of at least 10%),
• no change and
• downward within-firm mobility (decrease in wages of more than 5%) is performed to explore the internal career paths after two years:
( ) ( ) ( )
issA ic i
i v
A v
c i i
exp Pr exp
1
∑ =
= , and vijka = fijka +ζijka
This equation expresses the probability Pr
( )
ci Ai to incur a certain risk ci among the possible alternatives Ai. The linear predictor vijka contains a fixed( )
fijka and a random( )
ζijka term for each alternative risk a.3.3 Identification of Labour Market States
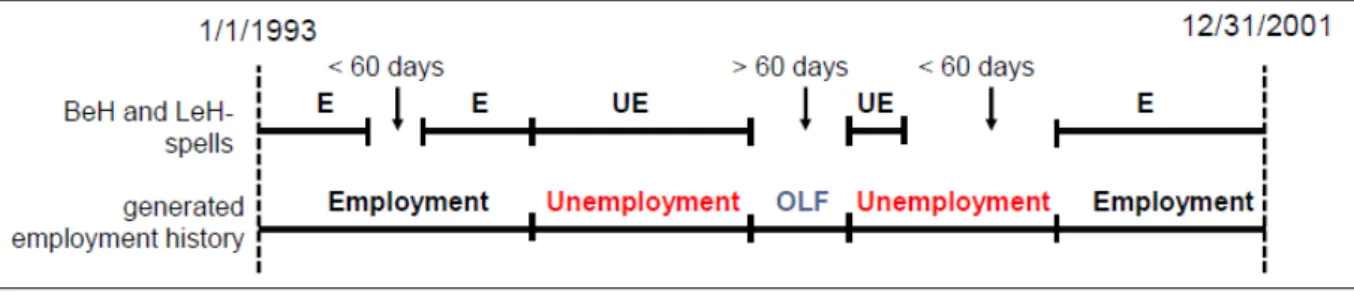
Information about the labour market states, especially the out of labor force state, had to be identified from the original spells; these periods are difficult to define because data contain only information for employment and unemployment periods. Figure 2 demonstrates how the different labour market states have been constructed.
Figure 2: Identification of labour market states
The first line represents the original Employee-History and the Benefit Recipient History spells with its non-employment gaps; according to this, a cleansing procedure with certain
4 A descriptive statistic on the three destination states is provided in Table 7 in the appendix.
rules has been implemented to get three labour market states, while gaps shorter than 60 days have been deleted. The three labour market states can be describes as follows:
• Employment (E): Employment with another employer within 60 days after separation (job-to-job change);
• Unemployment (UE): Receipt of unemployment benefits for at least one day within 60 days after separation;
• Out of the labour force (OLF): No job-to-job change for at least 60 days after separation and no receipt of unemployment benefits.
The estimation is performed with a large set of 56 exogenous explanatory variables which can be divided into three blocks of variables consisting of individual, firm-specific and region- specific factors. The former group includes information on gender, age, highest degree of ed- ucation, nationality, job position as well as cohorts and previous employment state. Firm- specific characteristics are the firm size, qualification structure, age distribution, contractual relationships and investment, co-determination and industrial sectors. Region-specific factors are the differentiated types of regions, the economic structure, human capital endowment and productivity.
4 Results
On account of the large number of explanatory variables the explanation of the effects is di- vided thematically into three subsections for reasons of clarity.
4.1 Individual determinants
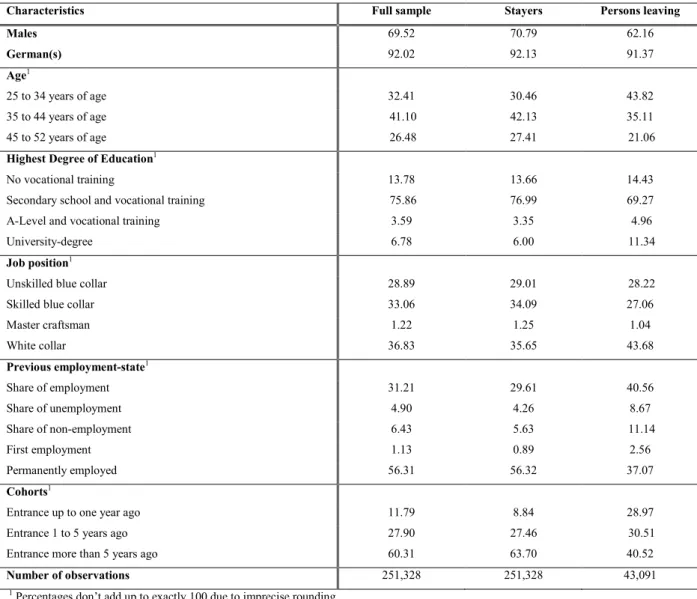
As mentioned before, education was considered to be a highly relevant determinant of em- ployment trajectories; in contrast to it, we assumed that bad employment histories – for ex- ample poor starts to employment careers – cause life course costs. Table 1 contains evidence on these assumptions.
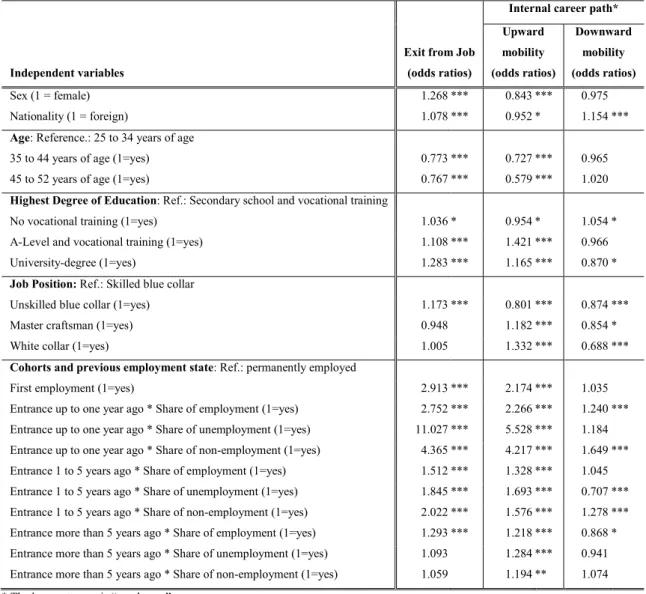
Table 1: Piecewise Constant Exponential- and Competing Risks Model on Individual Factors
Independent variables
Exit from Job (odds ratios)
Internal career path*
Upward mobility (odds ratios)
Downward mobility (odds ratios)
Sex (1 = female) 1.268 *** 0.843 *** 0.975
Nationality (1 = foreign) 1.078 *** 0.952 * 1.154 ***
Age: Reference.: 25 to 34 years of age
35 to 44 years of age (1=yes) 0.773 *** 0.727 *** 0.965
45 to 52 years of age (1=yes) 0.767 *** 0.579 *** 1.020
Highest Degree of Education: Ref.: Secondary school and vocational training
No vocational training (1=yes) 1.036 * 0.954 * 1.054 *
A-Level and vocational training (1=yes) 1.108 *** 1.421 *** 0.966
University-degree (1=yes) 1.283 *** 1.165 *** 0.870 *
Job Position: Ref.: Skilled blue collar
Unskilled blue collar (1=yes) 1.173 *** 0.801 *** 0.874 ***
Master craftsman (1=yes) 0.948 1.182 *** 0.854 *
White collar (1=yes) 1.005 1.332 *** 0.688 ***
Cohorts and previous employment state: Ref.: permanently employed
First employment (1=yes) 2.913 *** 2.174 *** 1.035
Entrance up to one year ago * Share of employment (1=yes) 2.752 *** 2.266 *** 1.240 ***
Entrance up to one year ago * Share of unemployment (1=yes) 11.027 *** 5.528 *** 1.184 Entrance up to one year ago * Share of non-employment (1=yes) 4.365 *** 4.217 *** 1.649 ***
Entrance 1 to 5 years ago * Share of employment (1=yes) 1.512 *** 1.328 *** 1.045 Entrance 1 to 5 years ago * Share of unemployment (1=yes) 1.845 *** 1.693 *** 0.707 ***
Entrance 1 to 5 years ago * Share of non-employment (1=yes) 2.022 *** 1.576 *** 1.278 ***
Entrance more than 5 years ago * Share of employment (1=yes) 1.293 *** 1.218 *** 0.868 * Entrance more than 5 years ago * Share of unemployment (1=yes) 1.093 1.284 *** 0.941 Entrance more than 5 years ago * Share of non-employment (1=yes) 1.059 1.194 ** 1.074
* The base category is “no change”.
Source: Linked Employer-Employee Data (LIAB); own calculations
Results on the highest degree of education show that job exit rates as well as within-firm mo- bility rates differ vastly between qualification groups. While those employees with a voca- tional training degree after having attended secondary school work in stable jobs, the less qualified as well as the high qualified are in instable employment. This is due to Human Capi- tal Theory that predicts higher mobility rates of better educated workers induced by a greater amount of general human capital (Becker 1962; Mincer 1962; Oi 1962). Different results were shown by Grother et al. (2004) and Boockmann and Steffes (2010) who observed firm entrants. This could be taken as an evidence for the Job Search Theory (Barron 1975; Lipp- mann and McCall 1976); thus, particularly already employed, high qualified workers are vol- untarily mobile to improve their wages and working conditions.
Table 1 provides evidence that those low qualified workers remaining in the firm are less able to realize promotions and to avoid downward mobility; rather, the high qualified stayers are rewarded with better career prospects. This can be explained by Segmented Labour Market Theory (Doeringer and Poire 1971; Lutz and Sengenberger 1974); according to this, the high qualified employees work in the first sector in stable jobs, acquire firm-specific qualifications and get promotions. The second sector, however, offers unstable jobs and bad promotion pro- spects for low-skilled workers.
Results for cohorts and previous employment states in Table 1 indicate higher job exit rates for entry-level employees due to Job-Matching-Theory (Jovanovic 1979, 1984); accordingly, misallocations caused by incomplete information occur in case of new hirings that are to be corrected by subsequent labour mobility. Concerning the existence of scarring effects, there is evidence that the length of current employment diminishes the negative effect of lagged un- employment duration dependences. The longer workers with lagged unemployment or non- employment periods are currently employed, the more likely they can reduce scarring effects and stabilize their future employment trajectories. Employees who have entered the firm at most one year ago and remained in the firm have good promotion prospects but also higher risks for decline. It can be assumed that the individual employment history is an important de- terminant of job duration (Boockmann and Steffes 2010; Booth et al. 1999). While Arulampa- lam et al. (2001: 577) noticed, that “unemployment tends to bring future unemployment”, we observe a diminishing effect of duration dependence. Moreover, men, Germans as well as older employees are in more stable employment, whereas only the first two groups of workers have better promotion prospects. To sum up, individuals have different career prospects de- pending on the education degree they especially acquired in the first period of their life course.
4.2 Firm-specific determinants
Firm-specific characteristics were examined to ascertain if it is to be distinguished between good and bad opportunity structures. It should be tested whether firms providing further train- ing offer good opportunity structures that lead to more stable jobs and increasing wages by raising the productivity of workers.
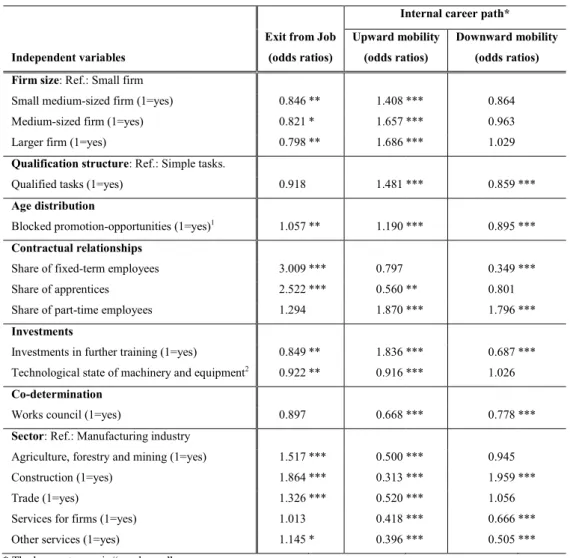
Table 2: Piecewise Constant Exponential- and Competing Risks Model on Firm-specific Factors
Independent variables
Exit from Job (odds ratios)
Internal career path*
Upward mobility (odds ratios)
Downward mobility (odds ratios)
Firm size: Ref.: Small firm
Small medium-sized firm (1=yes) 0.846 ** 1.408 *** 0.864
Medium-sized firm (1=yes) 0.821 * 1.657 *** 0.963
Larger firm (1=yes) 0.798 ** 1.686 *** 1.029
Qualification structure: Ref.: Simple tasks.
Qualified tasks (1=yes) 0.918 1.481 *** 0.859 ***
Age distribution
Blocked promotion-opportunities (1=yes)1 1.057 ** 1.190 *** 0.895 ***
Contractual relationships
Share of fixed-term employees 3.009 *** 0.797 0.349 ***
Share of apprentices 2.522 *** 0.560 ** 0.801
Share of part-time employees 1.294 1.870 *** 1.796 ***
Investments
Investments in further training (1=yes) 0.849 ** 1.836 *** 0.687 ***
Technological state of machinery and equipment2 0.922 ** 0.916 *** 1.026
Co-determination
Works council (1=yes) 0.897 0.668 *** 0.778 ***
Sector: Ref.: Manufacturing industry
Agriculture, forestry and mining (1=yes) 1.517 *** 0.500 *** 0.945
Construction (1=yes) 1.864 *** 0.313 *** 1.959 ***
Trade (1=yes) 1.326 *** 0.520 *** 1.056
Services for firms (1=yes) 1.013 0.418 *** 0.666 ***
Other services (1=yes) 1.145 * 0.396 *** 0.505 ***
* The base category is “no change”.
1 “1” indicates that an employee is positioned ahead the median age in the internal age distribution.
2 “1” indicates that the establishment has state-of-the-art equipment; “5” indicates that the equipment is obsolete.
Source: Linked Employer-Employee Data (LIAB); own calculations
Table 2 indicates that firms providing further training are able to afford more stable jobs and good promotion prospect, whereas downward mobility is scarce. The reason could be that firms intend to strengthen their relationship to employees after having invested in their human capital to avoid “sunk costs” in case of job terminations by employees. These results support findings on positive effects of further training on wages (Büchel and Pannenberg 2004;
Pischke 2001; Wolter and Schiener 2009); opposed to Düll and Bellmann (1999) as well as Becker (1993), but in accordance with Hübler and König (1999), we cannot find a relation be- tween further training and mobility. Furthermore, larger firms and state-of-the-art machinery stabilise employment, while blocked promotion-opportunities and atypical employment have destabilising effects. Due to the greatly varying coefficients of the firm-level variables and the positive impact of firms providing further training, it is to be concluded that opportunity structures significantly influence employment careers.
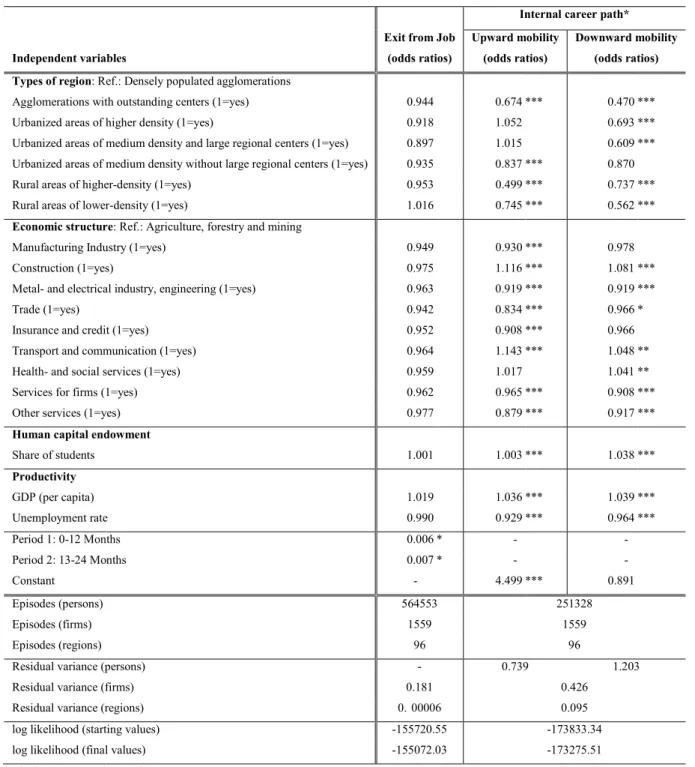
4.3 Regional determinants
On the macro level it was to be assessed whether human capital accumulation affects em- ployment trajectories and whether regional heterogeneities cause a diverse distribution of economic activities.
Table 3: Piecewise Constant Exponential- and Competing Risks Model on Region-specific Factors
Independent variables
Exit from Job (odds ratios)
Internal career path*
Upward mobility (odds ratios)
Downward mobility (odds ratios)
Types of region: Ref.: Densely populated agglomerations
Agglomerations with outstanding centers (1=yes) 0.944 0.674 *** 0.470 ***
Urbanized areas of higher density (1=yes) 0.918 1.052 0.693 ***
Urbanized areas of medium density and large regional centers (1=yes) 0.897 1.015 0.609 ***
Urbanized areas of medium density without large regional centers (1=yes) 0.935 0.837 *** 0.870
Rural areas of higher-density (1=yes) 0.953 0.499 *** 0.737 ***
Rural areas of lower-density (1=yes) 1.016 0.745 *** 0.562 ***
Economic structure: Ref.: Agriculture, forestry and mining
Manufacturing Industry (1=yes) 0.949 0.930 *** 0.978
Construction (1=yes) 0.975 1.116 *** 1.081 ***
Metal- and electrical industry, engineering (1=yes) 0.963 0.919 *** 0.919 ***
Trade (1=yes) 0.942 0.834 *** 0.966 *
Insurance and credit (1=yes) 0.952 0.908 *** 0.966
Transport and communication (1=yes) 0.964 1.143 *** 1.048 **
Health- and social services (1=yes) 0.959 1.017 1.041 **
Services for firms (1=yes) 0.962 0.965 *** 0.908 ***
Other services (1=yes) 0.977 0.879 *** 0.917 ***
Human capital endowment
Share of students 1.001 1.003 *** 1.038 ***
Productivity
GDP (per capita) 1.019 1.036 *** 1.039 ***
Unemployment rate 0.990 0.929 *** 0.964 ***
Period 1: 0-12 Months 0.006 * - -
Period 2: 13-24 Months 0.007 * - -
Constant - 4.499 *** 0.891
Episodes (persons) 564553 251328
Episodes (firms) 1559 1559
Episodes (regions) 96 96
Residual variance (persons) - 0.739 1.203
Residual variance (firms) 0.181 0.426
Residual variance (regions) 0.00006 0.095
log likelihood (starting values) -155720.55 -173833.34
log likelihood (final values) -155072.03 -173275.51
* The base category is “no change”.
Source: Linked Employer-Employee Data (LIAB); own calculations
For the examination of human capital endowment in the regions we used the share of students as a proxy-variable. Table 3 demonstrates that employment cannot be stabilised by the share of high qualified employees. Due to internal career paths not all groups of workers seem to benefit from a high human capital accumulation. This can be explained by findings on skill segregation. Thus, high qualified workers benefit from increasing skill segregation; in con- trast, it leads to unfavourable labour-market conditions for low-skilled workers (Gerlach et al.
2002; Schlitte et al. 2010; Stephan 2001).
Table 3 also illustrates that none of the observed regional determinants affect job exit rates.
Two explanations can be found for this result. First, an econometric reason would be that we used a multilevel framework. Having done this, we accounted for the correlation of employ- ees in specific regions, while other estimation methods often disregard these correlations lead- ing to incorrect standard deviations; second, a quite simple reason is that individual and firm- specific determinants influence job exits to a much greater degree. This is also supported by Bookmann and Steffes (2010) who investigated only weak effects of the local labour market conditions on job durations. Career prospects, however, depend on various regional character- istics. The construction as well as the transport and communication sectors and the GDP raise within-firm mobility; on the contrary, the metal-, electrical and engineering industries, trade, services for firms and other services as well as the unemployment rate reduce internal mobili- ty. These unequal career prospects in different types of region indicate a regional segmenta- tion of the labour market.
5 Conclusions
This paper contributed to life course research by analyzing individual, firm-specific and re- gional effects on employment trajectories. It was assumed that the benefit of education de- pends on the employment history, firms and regional structures; therefore, we combined the German LIAB, a linked employer-employee dataset, and data on regional characteristics from the Federal Employment Services (BA) and the Federal Institute for Research on Building, Urban Affairs and Spatial Development (BBSR). Based on this new and hierarchical struc- tured data set, a multilevel framework was deployed to evaluate employment trajectories in a two-stage procedure. First, job tenure was estimated by a Piecewise Constant Exponential model; then, an independent Competing Risks model with the three destination states “career
advancement”, “no change” and “career decline” was performed to analyse the internal career paths.
The main findings can be concluded as follows. First, evidence suggested that individuals have different career prospects depending on the education degree they especially acquire in the first period of their life course. Second, long term current employment reduces scarring effects; thus, future employment trajectories can be stabilized. Third, firms offer different op- portunity structures which influence the chances and risks in employment careers in different ways; particularly, further training leads to more stable jobs and better promotion prospects.
Fourth, regional factors hardly explain job exit rates, but the unequal internal career prospects in different types of region indicate a regional segmentation of the labour market.
In further research we will estimate another model for the year 2002 to control for different economic situations. Additionally, the effects of the regional characteristics should be investi- gated in more detail.
References
Ahrne, Göran. 1994. Social Organizations. Interaction inside, outside and between organizations. London: Sage.
Allmendinger, Jutta. 1989. Educational systems and labor market outcomes. European Sociological Review 5, 231-250.
Arulampalam, Wiji. 2001. Is Unemployment Really Scarring? Effects of Unemployment Experiences on Wages.
Economic Journal, Royal Economic Society, vol. 111, F585-606.
Barron, John. 1975. Search in the Labor Market and the Duration of Unemployment: Some Empirical Evidence.
American Economic Review 65, 934-942.
Baron, James, and William Bielby. 1980: Bringing the Firms Back in: Stratification, Segmentation, and the Or- ganization of Work. American Sociological Review 45, 737–765.
Becker, Garry. 1962. Investment in Human Capital: A theoretical Analysis. Journal of Political Economy 70, 9- 42.
Becker, Rolf. 1993. Zur Bedeutung der beruflichen Weiterbildung für den Berufsverlauf. Eine empirische Längsschnittuntersuchung über Weiterbildungs- und Berufschancen. In Weiterbildung, Lebenslauf, sozialer Wandel, Hrsg. Arthur Meier and Ursula Rabe-Kleberg, 61-86. Neuwied: Luchterhand.
Becker, Rolf and Anna Etta Hecken. 2009. Berufliche Weiterbildung - bildungs- und arbeits-marktsoziologische Perspektiven und empirische Befunde. In Lehrbuch der Bildungssoziologie, Hrsg. Rolf Becker, 357-394.
Wiesbaden: VS Verlag.
Bender, Stefan, Dirk Konietzka, and Peter Sopp. 2000. Diskontinuität im Erwerbsverlauf und betrieblicher Kon- text. Kölner Zeitschrift für Soziologie und Sozialpsychologie 52: 475-499.
Biewen, Martin, and Susanne Steffes. 2010. Unemployment persistence: Is there evidence for stigma effects?
Economics Letters 106, 188-190.
Blanchard, Olivier, and Peter Diamond. 1994. Ranking, Unemployment Duration, and Wages. Review of Eco- nomic Studies 61, 417-434.
Blien, Uwe. 2001. Arbeitslosigkeit und Entlohnung auf regionalen Arbeitsmärkten. Theoretische Analyse, öko- nometrische Methode, empirische Evidenz und wirtschaftspolitische Schlussfolgerungen für die Bundesre- publik Deutschland. Heidelberg: Physica.
Blien, Uwe, and Katja Wolf. 2002. Regional development of employment in eastern Germany: an analysis with an econometric analogue to shift-share techniques. Papers in Regional Science 81, 391-414.
Blossfeld, Hans-Peter. 1986. Career opportunities in the Federal Republic of Germany: a dynamic approach to the study of life-course, cohort, and period effects. European Sociological Review 3, 208-225.
Boockmann, Bernhard, and Susanne Steffes. 2010. Workers, Firms or Institutions: What Determines Job Dura- tion for Male Employees in Germany? Industrial and Labor Relations Review 1, 109-127.
Booth, Alison, Marco Francesconi, and Carlos Garcia-Serrano. 1999, Job Tenure and Job Mobility in Britain, Industrial and Labor Relations Review 1, 43-70.
Büchel, Felix and Markus Pannenberg. 2004. Berufliche Weiterbildung in West- und Ost-deutschland – Teilnehmer, Struktur und individueller Ertrag. Zeitschrift für Arbeitsmarktforschung 37, 73-126.
Card, David. 1999. The causal effect of education on earnings. In Handbook of Labor Economics 3, Hrsg. : Ashenfelder, Orley and David Card, 1801-1863. Amsterdam: Elsevier.
Christensen, Björn. 2001. Berufliche Weiterbildung und Arbeitsplatzrisiko: Ein Matching-Ansatz. Kieler Ar- beitspapiere Nr. 1033, Institut für Weltwirtschaft, März.
Diewald, Martin, and Stephanie Sill. 2004. Mehr Risiken, mehr Chancen? Trends in der Arbeitsmarktmobilität seit Mitte der 1980er Jahre. In: Beschäftigungsstabilität im Wandel? Hrsg. Olaf Struck und Christoph Köhler, 39–63. Mering: Rainer Hampp Verlag.
Doeringer, Peter and Michael Piore. 1971. Internal labor markets and manpower analysis. Lexington: D.C. He- ath.
Düll, Herbert and Lutz Bellmann. 1999. Der unterschiedliche Zugang zur betrieblichen Weiterbildung nach Qua- lifikation und Berufsstatus. Eine Analyse auf der Basis des IAB-Betriebspanels für West- und Ostdeutsch- land. Mitteilungen aus der Arbeitsmarkt- und Berufsforschung 32, 205-225.
Erlinghagen, Marcel. 2005. Entlassungen und Beschäftigungssicherheit im Zeitverlauf. Zur Entwicklung unfrei- williger Arbeitsmarktmobilität in Deutschland. Zeitschrift für Soziologie 34, 147-168.
Farhauer, Oliver, and Nadia Granato. 2006. Regionale Arbeitsmärkte in Westdeutschland: Standortfaktoren und Branchenmix entscheidend für Beschäftigung. IAB-Kurzbericht 4.
Fischer, Gabriele, Florian Janik, Dana Müller, and Alexandra Schmucker. 2008. Das IABBetriebspanel - von der Stichprobe über die Erhebung bis zur Hochrechnung. FDZ-Methodenreport 1.
Fitzenberger, Bernd, Aderonke Osikominu, and Robert Völter. 2005. Imputation Rules to Improve the Education Variable in the IAB Employment Subsample. FDZ-Methodenreport 3.
Fujita, Masahisa, Paul Krugman, and Anthony Venables. 2001. The spatial economy. cities, regions and interna- tional trade. Cambridge: MIT Press.
Gerlach, Knut, und Gesine Stephan, 2005: Individual tenure and collective contracts. IAB Discussion Paper 10.
Gerlach, Knut, Wolfgang Meyer, and Georgi Tsertsvadze. 2002. Entwicklung der qualifikatorischen Segregation im Verarbeitenden Gewerbe. In: Betrieblicher Wandel und Fachkräftebedarf, Hrsg. Lutz Bellmann und Arne Kölling, 51-84. Nürnberg: Institut für Arbeitsmarkt- und Berufsforschung.
Giesecke, Johannes, and Jan Paul Heisig. 2010. Destabilisierung und Destandardisierung, aber für wen? Die Entwicklung der westdeutschen Arbeitsplatzmobilität seit 1984. Kölner Zeitschrift für Soziologie und Sozial- psychologie 62, 403-435.
Grotheer, Michael, Olaf Struck, Lutz Bellmann, and Tilo Gewiese. 2004. Determinanten von Beschäftigungssta- bilität. Chancen und Risiken von ’Entrants’ im ost-westdeutschen Vergleich. In: Beschäftigungsstabilität im Wandel? Hrsg. Olaf Struck and Christoph Köhler, 125-156. Mering: Rainer Hampp Verlag.
Heckman, James, and George Borjas. 1980. Does Unemployment Cause Future Unemployment? Definitions, Questions and Answers from a Continuous Time Model of Heterogeneity and State Dependence. Economica 47, 247 - 283.
Hillmert, Steffen. 2001. Ausbildungssysteme und Arbeitsmarkt. Lebensverläufe in Großbritannien und Deutsch- land im Kohortenvergleich. Wiesbaden: Westdeutscher Verlag.
Hillmert, Steffen, Karin Kurz, and Daniela Grunow. 2004: Beschäftigungsstabilität in der ersten Hälfte des Er- werbslebens. Ein Kohortenvergleich. In: Beschäftigungsstabilität im Wandel? Hrsg. Olaf Struck und Chris- toph Köhler, 63–86. Mering: Rainer Hampp Verlag.
Hogan, Dennis. 1981. Transitions and social change: The early lives of American men. New York: Academic Press.
Hübler, Olaf, and Anja König. 1999. Verstärkt Weiterbildung die Betriebsbindung oder die Flexibilität der Be- schäftigten? In: Panelanalysen zur Lohnstruktur, Qualifikation und Beschäftigungsdynamik. Hrsg: Lutz Bellmann and Viktor Steiner, 263-312. Nürnberg: BeitrAB 229.
Jacobebbinghaus, Peter. 2008. LIAB-Datenhandbuch. Version 3.0. FDZ-Datenreport 3.
Jovanovic, Boyan. 1984. Matching, Turnover, and Unemployment. Journal of Political Economy 92: 108-122.
Jovanovic, Boyan. 1979. Job Matching and the Theory of Turnover. Journal of Political Economy 87: 972-990.
Kreckel, Reinhard. 1990. Soziale Ungleichheit und Arbeitsmarktsegmentierung. In: Lebenslagen, Lebensläufe, Lebensstile Hrsg. Peter A. Berger and Stefan Hradil, 137-162. Göttingen: Schwartz.
Kocka, Jürgen, and Claus Offe. 2000. Geschichte und Zukunft der Arbeit. Frankfurt a.M.: Campus.
Krugman, Paul. 1991. Geography and trade. Cambridge: MIT Press.
Krugman, Paul. 1998. What´s new about the new economic geography? Oxford Review of Economic Policy 14, 7-17.
Lechner, Michael. 1999. The Effects of Enterprise-Related Training in East Germany on Individual Employment and Earnings. Annales d'Économie et de Statistique 55/56, 97-128.
Lippmann, Steven, and John McCall. 1976. The Economics of Job Search: A Survey. Economic Inquiry 14, 155- 189 u. 347-368.
Lucas, Robert. 1988. On the mechanics of economic development. Journal of Monetary Economics 22, 3-42.
Lutz, Burkart, and Werner Sengenberger. 1974. Arbeitsmarktstrukturen und öffentliche Arbeitsmarktpolitik. Eine kritische Analyse von Zielen und Instrumenten. Göttingen: Schwartz.
Mayer, Karl Ulrich, and Hans-Peter Blossfeld, 1990: Die gesellschaftliche Konstruktion sozialer Ungleichheit im Lebensverlauf. In: Lebenslagen, Lebensläufe, Lebensstile, Hrsg. Peter Berger und Stefan Hradil, 297-318.
Göttingen: Schwartz.
Mincer, Jacob. 1962. On-the-job training: costs, returns and some implications. Journal of Political Economy 70, 50-79.
Moulton, Brent. 1986. Random group effects and the precision of regression estimates. Journal of Econometrics 32, 385-397.
Moulton, Brent. 1990. An illustration of a pitfall in estimating the effects of aggregate variables on micro units.
Review of Economics and Statistics 72, 334-338.
Möller, Joachim, and Alexandros Tassinopoulos. 2000. Zunehmende Spezialisierung oder Strukturkonvergenz?
Eine Analyse der sektoralen Beschäftigungsentwicklung auf regionaler Ebene. Jahrbuch für Regionalwissen- schaft 20, 1-38.
Müller, Walter and Yossi Shavit. 1998. Bildung und Beruf im institutionellen Kontext. Zeitschrift für Erzie- hungswissenschaft 1: 501-533.
Oi, Walter. 1962: Labor as a Quasi-Fixed-Factor. Journal of Political Economy 70, 538-555.
Pannenberg, Markus. 2001. Schützt Weiterbildung vor Arbeitslosigkeit? In Bildung und Beschäftigung. Schriften des Vereins für Socialpolitik, Hrsg. Robert Weizsäcker, 275-291. Berlin: Dunker u. Humblot.
Pfeiffer, Friedhelm and Frank Reize. 2000. Formelle und informelle berufliche Weiterbildung und Verdienst bei Arbeitnehmern und Selbständigen. ZEW Discussion Paper No. 00-01, Mannheim.
Pischke, Jörn-Steffen. 2001. Continuous training in Germany. Journal of Population Economy 14, 523-548.
Pissarides, Christopher. 1992. Loss of skill during unemployment and the persistence of employment shocks, Quarterly Journal of Economics 107, 1371 -91.
Rabe-Hesketh, Sophia, and Anders Skrondal. 2008. Multilevel and Longitudinal Modeling Using Stata. College Station: Stata Press.
Rendtel, Ulrich, und Johannes Schwarze. 1996. Schätzungen von Lohnkurven für Westdeutschland mit einem verallgemeinerten Varianz-Komponenten-Modell. Mitteilungen aus der Arbeitsmarkt- und Berufsforschung 3, 491-493.
Schlitte, Friso, Fabian Böttcher, Annektrin Niebuhr, and Javier Diez. 2010. The determinants of regional dispari- ties in skill segregation – Evidence from a cross section of German regions, HWWI Research Paper 1-36.
Schwarze, Johannes. 1995. Neue Befunde zur Lohnkurve in Deutschland: Eine Analyse mit Paneldaten für Raumordnungsregionen 1985 und 1989. DIW Diskussionspapier 119.
Skrondal, Anders, and Sophia Rabe-Hesketh. 2003. Multilevel logistic regression for polytomous data and rank- ings. Psychometrica 68, 267-287.
Stephan, Gesine. 2001. Firmenlohndifferenziale. Eine Analyse für die Bundesrepublik Deutschland. Frankfurt:
Campus.
Struck, Olaf. 2006. Flexibilität und Sicherheit: Empirische Befunde, theoretische Konzepte und institutionelle Gestaltung von Beschäftigungsstabilität. Wiesbaden: VS Verlag.
Vobruba, Georg. 2000. Alternativen zur Vollbeschäftigung. Frankfurt a.M.: Suhrkamp.
Vobruba, Georg. 1990. Lohnarbeitszentrierte Sozialpolitik in der Krise der Lohnarbeit. In: Strukturwandel der Sozialpolitik. Lohnarbeitszentrierte Sozialpolitik und soziale Grundsicherung, Hrsg. Ders. Georg Vobruba, 11-80. Frankfurt a.M.: Suhrkamp.
Wolter, Felix and Jürgen Schiener. 2009. Einkommenseffekte beruflicher Bildung. Empirische Analysen auf Ba- sis des Mikrozensus-Panels. Kölner Zeitschrift für Soziologie und Sozialpsychologie 61, 90-117.
Appendices
Table 4: Description of individual characteristics (Indication of means and/or shares in percentages)
Characteristics Full sample Stayers Persons leaving
Males 69.52 70.79 62.16
German(s) 92.02 92.13 91.37
Age1
25 to 34 years of age 32.41 30.46 43.82
35 to 44 years of age 41.10 42.13 35.11
45 to 52 years of age 26.48 27.41 21.06
Highest Degree of Education1
No vocational training 13.78 13.66 14.43
Secondary school and vocational training 75.86 76.99 69.27
A-Level and vocational training 3.59 3.35 4.96
University-degree 6.78 6.00 11.34
Job position1
Unskilled blue collar 28.89 29.01 28.22
Skilled blue collar 33.06 34.09 27.06
Master craftsman 1.22 1.25 1.04
White collar 36.83 35.65 43.68
Previous employment-state1
Share of employment 31.21 29.61 40.56
Share of unemployment 4.90 4.26 8.67
Share of non-employment 6.43 5.63 11.14
First employment 1.13 0.89 2.56
Permanently employed 56.31 56.32 37.07
Cohorts1
Entrance up to one year ago 11.79 8.84 28.97
Entrance 1 to 5 years ago 27.90 27.46 30.51
Entrance more than 5 years ago 60.31 63.70 40.52
Number of observations 251,328 251,328 43,091
1 Percentages don’t add up to exactly 100 due to imprecise rounding.
Source: Linked Employer-Employee Data (LIAB); own calculations
Table 5: Description of Firm-specific Characteristics (Indication of means and/or shares in percentages) Characteristics
Firm size1
Small firm 35.51
Small medium-sized firm 30.17
Medium-sized firm 16.28
Larger firm 18.04
Qualification structure1
Simple tasks 18.10
Qualified tasks 81.89
Contractual relationships1
Share of fixed-term employees 4.87
Share of apprentices 8.68
Share of part-time employees 12.21
Investments
Investments in further training 81.14
Technological state of machinery and equipment2 2.92
Co-determination
Works council (1=yes) 57.45
Sector1
Agriculture, forestry and mining 5.03
Construction 13.89
Manufacturing industry 35.39
Trade 11.94
Services for firms 6.03
Other services 27.72
1 Percentages don’t add up to exactly 100 due to imprecise rounding.
2 “1” indicates that the establishment has state-of-the-art equipment; “5” indicates that the equipment is obsolete.
Source: Linked Employer-Employee Data (LIAB); own calculations
Table 6: Description of the Regional Distribution of Employment-relevant Factors (Indication of means and/or shares in percentages)
Characteristics Mean Minimum Maximum
Human capital endowment
Employment rate 47,57 34,80 63,80
Productivity
Unemployment rate 11,77 5,50 22,90
GDP (per capita) 22,63 14,50 41,90
Economic structure1
Agriculture, forestry and mining 2,36 0,35 9,61
Manufacturing Industry 13,50 5,87 27,51
Metal- and electrical industry, engineering 14,51 4,39 38,75
Construction 9,57 5,09 16,58
Trade 15,08 11,25 23,23
Insurance and credit 3,14 1,29 9,90
Transport and communication 4,97 2,32 10,75
Health- and social services 10,79 6,64 15,09
Services for firms 8,13 4,15 17,13
Other services 17,91 11,14 30,81
1 Percentages don’t add up to exactly 100 due to imprecise rounding.
Source: Linked Employer-Employee Data (LIAB); own calculations
Table 7: Status of Stayers after Two Years (Indicated in percentages)
Internal career path1
Cohort 1 (Entrance at most
one year ago)
Cohort 2 (Entrance 1 to 5
years ago)
Cohort 3 (Entrance more
than 5 years ago) Full sample
Number of obser- vations
Downward mobility 5.79 6.16 7.33 6.87 17,268
No Change 54.49 67.81 73.58 70.31 176,710
Upward mobility 39.72 26.03 19.09 22.82 57,350
1 Percentages don’t add up to exactly 100 due to imprecise rounding.
Source: Linked Employer-Employee Data (LIAB); own calculations