Cryptogams as indicator organisms in ecology and conservation biology
DISSERTATION ZUR ERLANGUNG DES
DOKTORGRADES DER NATURWISSENSCHAFTEN (DR. RER. NAT.) DER FAKULTÄT FÜR BIOLOGIE UND VORKLINISCHE MEDIZIN
DER UNIVERSITÄT REGENSBURG
vorgelegt von
Josef Simmel
aus
Mitterfels
im Jahr
2016
Das Promotionsgesuch wurde eingereicht am:
28.07.2016
Die Arbeit wurde angeleitet von:
Prof. Dr. Peter Poschlod
Declaration of manuscripts
The below-mentioned chapter of the present PhD thesis is largely identical with a manuscript already submitted for publication. All other chapters either have not yet been submitted or are not intended for separate publication.
*Chapter 2 was published in F
UNGALE
COLOGYwith the thesis’ author being the main author:
Simmel, J., Bässler, C., Poschlod, P.: Ellenberg indicator values for macromycetes – a methodological approach and first applications.
Fungal Ecology 26 (2017). DOI: 10.1016/j.funeco.2016.09.004
i
Table of contents
CONTENTS PAGE
Summary ……….. ii
Acknowledgements ……….. … v
Motto ……….. vi
Chapter 1 – General introduction ……… 1
Chapter 2 – Ellenberg indicator values for macromycetes – a methodological approach and first applications ...………... 6
Chapter 3 – Lifestyle and threat of macromycetes – are there any functional traits correlated with? ..…....……… 25 Chapter 4 – Does the cryptogam vegetation of calcareous grasslands reflect land- use history? ….………... 37
Chapter 5 – The cryptogam vegetation of grasslands after 37 years of management and succession – bryophytes, lichens, and macromycetes of the “grassland management project” of Baden-Wuerttemberg …………... 50
Chapter 6 – Shifts in species composition of macromycete assemblages in the nature reserve “Sippenauer Moor” – an assessment using species identities, Ellenberg indicator values, and functional traits ….…...…... 68
Chapter 7 – Conclusions and perspectives …….……….……...…. 79
References ………....…….. 83
Table Appendix ……….. 103
ii
Summary
Summary
The present thesis was designed to compare the influence of land-use effects on three groups of cryptogam species, namely the bryophytes, lichens, and macromycetes. Further topics were to newly develop an indicator value system for macromycetes and to compile a broad overview of functional traits applicable to macromycetes. These research topics are intended to (further) stimulate ecological research using macromycetes.
In Chapter 2, I present a methodology for Ellenberg indicator values (EIVs) for macromycetes, including a new indicator value scale, i.e., the substrate openness O.
Furthermore, the hemeroby concept is incorporated for the first time in the system of indicator values. Based on the newly developed methodology, I compiled EIVs for 10 parameter scales for a set of nearly 640 macromycete species. To test the applicability of EIVs for this species group, I analysed the data set by dividing the species by Red List classes or by lifestyle groups. The EIVs light intensity, substrate nutrient availability, substrate openness, and hemeroby related to these two classifications significantly differed. Critically endangered species on average have distinctly higher demands regarding light and substrate openness than not or less strongly threatened ones, which in turn are more tolerant to human impact and have higher demands in nutrient availability. Mycorrhizal species on average have higher demands on substrate openness and are less tolerant to high nutrient levels than saprobiotic or parasitic species. This pattern clearly highlights the points of threat for many macromycete species.
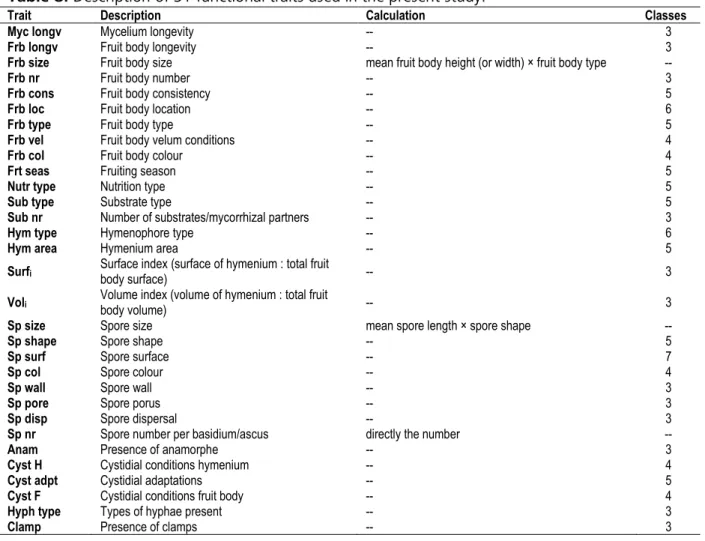
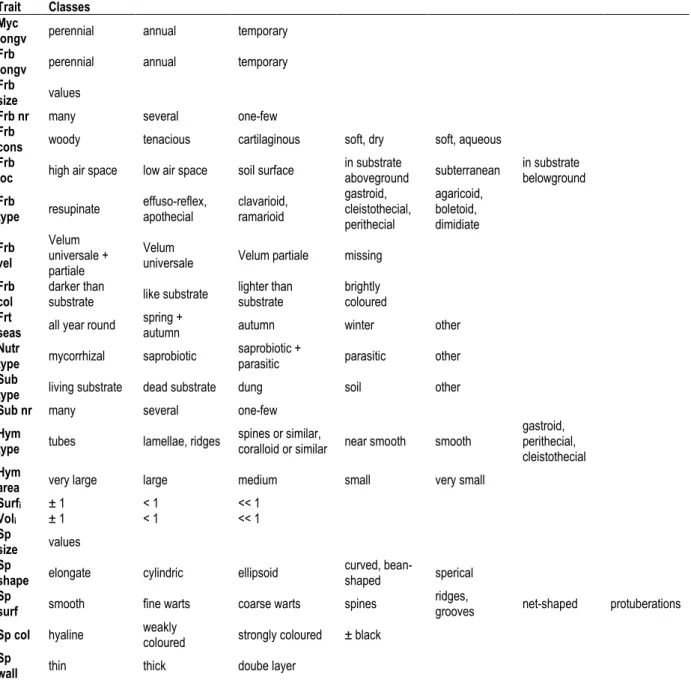
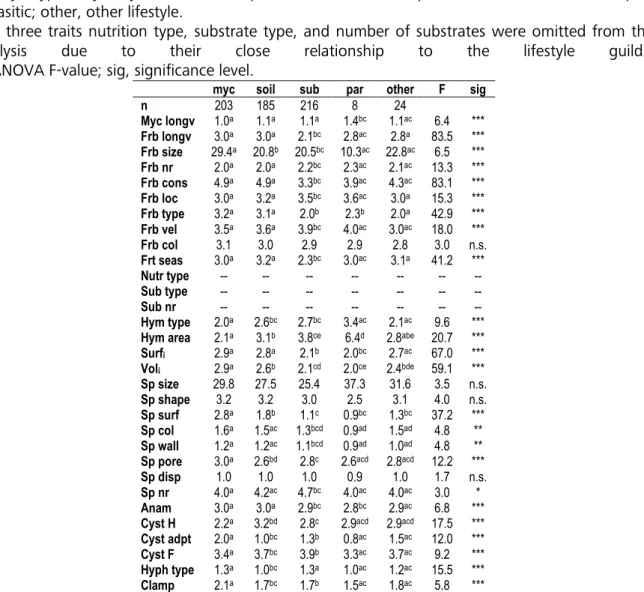
Chapter 3 persued a similar approach like Chapter 2. Using the same macromycete species set, I compiled data for 31 functional traits that cover a broad range of features of, e.g., fruit body morphology, hymenial structure, spore morphology, and propagule dispersal. In a comparative way, Red List classification and lifestyle groups were used to analyse the species set and to get an insight which traits may be connected with the ecology or endangerment of species. Red List classification accounted for significant differences in three traits, and the lifestyle types in 28 traits. I describe the differentiations and discuss them against the background of ecological and morphological research.
Chapter 4 was designed to compare the influence of land-use history on vascular plants and
cryptogams. I compared the results of previous studies on the vascular plant cover of ancient
and recent sites of dry calcareous grasslands to the cryptogam vegetation of these sites. I also
iii
Summary
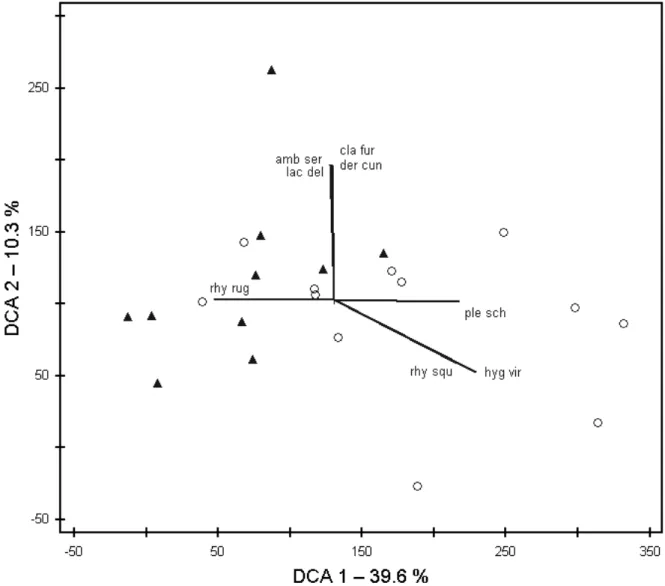
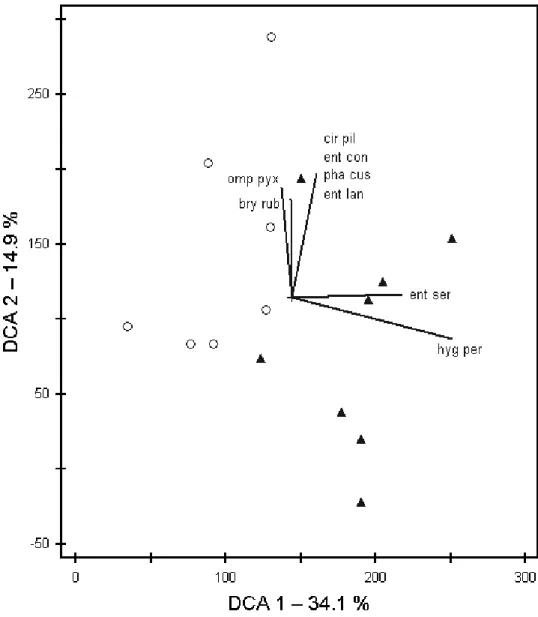
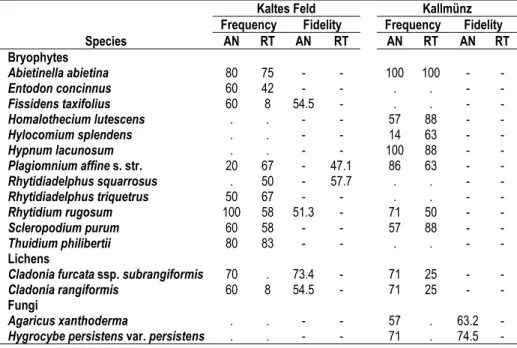
applied Ellenberg indicator values and the indicator species concept. Species numbers and Ellenberg indicator values were quite similar in ancient and recent grasslands. Nevertheless, we could identify indicator species for both grassland types, with Cladonia furcata ssp.
subrangiformis and Hygrocybe persistens var. persistens as strongest indicators of ancient grasslands, and Rhytidiadelphus squarrosus as strongest indicator of recent grasslands. The vascular plant vegetation of the recent grasslands also included arable weeds and crop species, being residuals of the former land-use type. This pattern is very useful in distinguishing recent from ancient sites. However, we found no counterpart for the cryptogam vegetation. Thus, land-use history seems to have less influence on the composition of the cryptogam vegetation in grasslands.
In Chapter 5, I present the first survey of the cryptogam vegetation of the grassland management project of Baden-Wuerttemberg. Using eight study sites the cryptogam vegetation found in the management and successional plots is compared. After a project term of 37 years, I assessed the effects of different mulching, mowing, and grazing methods as well as of undisturbed succession on the cryptogam vegetation, and give recommendations for the management and establishment of species-rich sites. The most species-rich bryophyte vegetation was found for the management types mulching every third year, mowing twice per year, and, for small acrocarpous species only, controlled burning. Macromycete species richness was highest in successional plots. These, despite the comparably short time for development, also yielded a surprisingly rich epiphytic vegetation. To enhance species diversity it is recommended to leave old trees and to newly create situations of high structural diversity by connecting wooded stands with grassland sites differing in the intensity of maintenance.
Chapter 6 is a holistic approach applying the three concepts of species identity, Ellenberg
indicator values, and functional traits to analyse the influence of management and past
draining on the macromycete funga of a calcareous fen, the Sippenauer Moor. I assessed
changes by comparing the present mapping data with data from a study carried out in 1998
and 1999. While species numbers were similar for the Sphagnum patches, we found a
considerable loss of species and of red listed species for the remaining fen area, and only very
few species were found in both studies. Ellenberg indicator values and functional traits did
not yield significant differences. However, we found a considerable increase in the number of
ubiquitous species. These changes in species composition most probably are caused by an
insufficiant management, tree encroachment, and after-effects of the past draining. We
iv
Summary
recommend to apply a more adapted management to prevent further species losses and to
maintain the high quality of the fen.
v
Acknowledgements
Acknowledgements
During my PhD time, many kind people helped me in many ways – by sharing their knowledge, their experience, their technical know-how, or ‘simply’ their time with me. I’d like to say “Thank you very much!” to all of you!
First of all, I want to thank my supervisor Prof. Dr. Peter Poschlod, for guiding me on a safe path through my PhD studies, for letting me work on ‘my’ fungi, and for maintaining such a friendly and homely atmosphere – both intra- and extra-professionally. It was a great time, and I’m especially thankful for your understanding during my times of Lyme borreliosis.
I’m also very grateful for the sustained support and scientific input I received from my mentors, Prof. Dr. Christoph Reisch and Dr. Claus Bässler, and I thank you very much for all kinds of help.
Several people guided me on the way to further expand my knowledge of the species and ecology of fungi and other cryptogams, and therefore I especially want to thank Dr. Helmut Besl (†), Prof. em. Dr. Andreas Bresinsky, Max Kronfeldner (†), Hans Halbwachs, Wolfgang von Brackel, and Helmut Zitzmann.
I always could rely on the help of Günter Kolb and Sabine Fischer, and I’m very much obliged for this.
Furthermore, I’d like to thank the past and present Viktor-von-Scheffel-members (Verena Busch, Annika Sezi, and Sara Saeedi), my past and present office colleagues (Christina Meindl, Juliane Drobnik, Daniela Listl, Franziska Kaulfuß, and Judith Lang), and my past and present colleagues, especially Maria Hanauer and Philipp Glaab.
Last but not least, I want to thank my family and friends, who always were there for me when
I needed someone.
vi
Motto
“
F ungi are the grand recyclers of the planet and the vanguard species in habitat restoration .”
Paul Stamets
“
K ryptogamen, meine Herren, meine Damen , das sind Pflanzen ohne Samen ;
D och die samenlosen Dinger wickeln Weise um den Finger .”
Maria Klement
- 1 -
Chapter 1 General introduction
Chapter 1 – General introduction
Getting to know the cryptogams
Back in 1735, Carl Linnaeus divided the plants (using this term in the broadest sense to cover all groups of organisms traditionally treated by botanists) in ‘phanerogams’ and ‘cryptogams’.
He derived these terms from ancient Greek: phaneros, visible, apparent; kryptos, hidden, secret; gamein, to mate. Thus, phanerogams are those plants that produce clearly visible mating organs (i.e., flowers that result in seeds), and therefore nowadays are referred to as flowering or seed plants (Spermatophyta). In contrast, the term cryptogams subsumes a range of different taxonomic groups without flowering organs and seeds – ferns, bryophytes, fungi (including lichens), slime moulds, algae, blue-green algae, and sometimes also non- photosynthetic bacteria. While ferns, bryophytes, and the largest part of the algae, together with the flowering plants, belong to the Chloroplastida (L
EWIS& M
CC
OURT2004), the remaining groups of cryptogams belong to the animal, fungus, or bacteria kingdoms (S
ITTEet al. 2002). The cryptogams hence are a highly artificial group without coherant relationships, united only by the fact that spores are produced in the course of sexual reproduction.
However, comparing the different groups of cryptogams the respective spores and sporangia also merely are analogous (S
ITTEet al. 2002).
Within the artificial group of cryptogams, various life forms and lifestyles can be found. In the present PhD thesis only the bryophytes, lichens, and macromycetes are taken into account, with macromycetes being those fungi producing fruit bodies larger than 5 mm in size (again, another artificial group!). Also within this subgroup of cryptogams a plenty of ecological adaptations and lifestyles are present, including mycorrhizal lifestyles, desiccation or cold tolerance, epiphytic or endolithic growth, and many more (B
ROWN& W
OOD1953; D
ÖRFELT1989; M
ASUCH1993; F
RAHM2001; S
ITTEet al. 2002; C
ORNELISSENet al. 2007; G
IORDANIet al. 2014). Based on these diverse adaptations, lifestyles, and ecological demands, cryptogams can be used as significant indicator organisms.
What are indicator species – and what do they indicate?
Indicator organisms are such species that can be used as a proxy in examining or monitoring
specific ecological conditions, changes, etc. In many cases, the use of indicator species allows
- 2 -
Chapter 1 General introduction
at least a rough assessment of the studied factors, at the same time saving time and costs of more profound measurements or research in the lab. Such factors may be, e.g., phytosociological aspects, air quality, abiotic substrate conditions, climate and climate change, nutrient availability, primary succession, and land-use history or changes (W
INTERHOFF1992; M
ILES& W
ALTON1993; P
OTT1995; S
CHNEIDER& P
OSCHLOD1999;
E
LLENBERGet al. 2001; D
IEKMANN2003; K
ARLÍK& P
OSCHLOD2009; F
RAHMet al. 2010;
C
HIKISHEV2013; L
ICHT2015; P
OSCHLOD2015).
Besides the use of species identities, i.e., the pure comparison of species or species sets found at certain sites, another common way to use organismic indicators is to apply Ellenberg indicator values or functional traits. Ellenberg indicator values are commonly used to describe ecological parameters related to climate and substrate conditions (E
LLENBERG1974;
E
LLENBERGet al. 2001). Regarding these parameters, the realised niche of a species is assessed and classified using a scale. These scales exist for light intensity, mean annual air temperature, continentality, and the substrate’s moisture, reaction (pH range), nutrient availability, and salt content. Furthermore, there is a classification scale for the frequency of species. For Central Europe, such indicator values are available for vascular plants (E
LLENBERG1974; L
ANDOLT1977; E
LLENBERGet al. 2001; W
EBER2001), bryophytes (D
ÜLL2001), and lichens (W
IRTH2001). B
RIEMLEet al. (2002) also compiled scales for the trampling resistance, mowing and grazing resistance, and fodder value of vascular plants.
Based on the floristic composition or the plant cover or both, mean indicator values can be calculated which allows to compare different study sites or to analyse temporal shifts (cf.
L
ANDOLT1977; E
LLENBERGet al. 2001). Therefore, this method is widely used in environmental (impact) assessments or to quickly identify important environmental filters in plant, habitat, or landscape ecological studies.
In a similar way, functional traits of species can be taken into account. These can be compiled for any part, organ or function of the respective species, such as sizes, colours, temporal scales, growth types, lifestyles, physiology, germination characteristics, dispersal, uptake and usage of water and nutrients, population biology, or population genetics (e.g.: P
OSCHLODet al.
2003; H
ILLet al. 2007; K
LEYERet al. 2008). Thus, in contrast to Ellenberg indicator values
that give information on a species’ ecological niche, functional traits give information about a
species’ makeup and function or how they react to any kind of disturbances, and therefore,
both measures may also be combined to get a comprehensive insight in the factors
controlling, e.g., composition of and shifts within species sets, or the threat or spread of
species.
- 3 -
Chapter 1 General introduction
Cryptogams as indicator species
As noted above, Ellenberg indicator values are available for bryophytes and lichens; however, they are still missing for fungi. On the other hand, functional traits are available for bryophytes, lichens, and fungi (e.g.: H
ILLet al. 2007; B
ÄSSLERet al. 2012; B
ÄSSLERet al.
2015; H
ALBWACHS& B
ÄSSLER2015; B
ÄSSLERet al. 2016; H
ALBWACHSet al. 2016), but as compared to vascular plants this measure is relatively rarely used for these species groups.
Thus, there are two major tasks: to newly establish a system of Ellenberg indicator values for fungi; and to further enhance the use of functional traits for cryptogams.
Although the use of cryptogams as indicator species hence still is limited in some respects, the different groups of cryptogams since a comparably long time are very valuable tools in ecology. With the exception of ferns, most cryptogamic organisms have a relatively simple body structure, e.g. lacking epithelial layers and specialised vascular tissue (S
ITTEet al. 2002;
R
AVEN& E
ICHHORN2013). This simplicity makes them especially receptive regarding environmental impacts, such as shifts in temperature or hydrology or the deposition of fertilizing or toxic substances, which in turn qualifies them as indicator species exhibiting a reliable and relatively fast reaction on the short- or medium-term (B
ARKMAN1958; A
RNOLDS1981; A
RNOLDS1983; H
AWKSWORTH& H
ILL1984; A
RNOLDS1991; W
INTERHOFF1992;
D
ÜLL2001; W
IRTH2001; F
RAHMet al. 2010; L
ICHT2015).
Among the topics in which cryptogams most commonly are used as indicator species are success assessment in restoration ecology (Z
ERBE& W
IEGLEB2009), phytosociological applications (B
ARKMAN1958; P
OTT1995; B
ERG& D
ENGLER2005), and the evaluation of air quality using epiphytic species (H
AWKSWORTH& R
OSE1970; C
ONTI& C
ECCHETTI2001;
H
ULTENGRENet al. 2004; F
RAHMet al. 2010). Another field of research is the impact of hemeroby or the past and present land-use on cryptogam species and communities, which often is studied using coenological (D
IGHTONet al. 1986; U
TSCHICK& H
ELFER2003) and floristic methods (E
INHELLINGER1976; E
INHELLINGER1977; P
AKEMANet al. 1998; G
RAAE&
S
UNDE2000; D
ÜRHAMMER2003; V
ANDERPOORTENet al. 2004; E
IDENSCHINK2011; W
ALZ&
S
TEIN2014), or using physiological patterns such as the mycorrhization rate of plant roots (W
ALLENDA& K
OTTKE1998; B
ERNHARDT-R
ÖMERMANNet al. 2009).
While cryptogams are used as indicator species in a broad range of different topics, only very
few studies take into account several taxonomic groups or subgroups. Thus, only in a few
cases it is possible to directly compare, e.g., bryophytes, lichens, and fungi regarding their
reaction on ecological and man-made impacts. However, such comparative studies are
- 4 -
Chapter 1 General introduction
important in understanding the processes and demands controlling the establishment and occurrence of different cryptogam groups (L
UCZAJ& S
ADOWSKA1997; P
HAROet al. 1999;
P
HAROet al. 2000; H
UMPHREYet al. 2002; L
ÖBELet al. 2006; Ó
DORet al. 2006; F
RITZet al.
2008).
Thesis outline
The present thesis was designed to compare the influence of land-use effects on three groups of cryptogam species, namely bryophytes, lichens, and macromycetes. Further topics were to newly develop an indicator value system for macromycetes and to compile a broad overview of functional traits applicable to macromycetes. These research topics are intended to (further) stimulate ecological research using macromycetes.
In Chapter 2, I present a methodology for Ellenberg indicator values for macromycetes, including a new indicator value scale, i.e., the substrate openness O. Furthermore, the hemeroby concept is incorporated for the first time in the system of indicator values. Based on the newly developed methodology, I compiled Ellenberg indicator values for 10 parameter scales for a set of nearly 640 macromycete species. To test the applicability of indicator values for this species group, I used the data set by correlating the species to the Red List classes or to lifestyle groups.
Chapter 3 persued a similar approach like Chapter 2. Using the same macromycete species set, I compiled data for 31 functional traits of these nearly 640 species. In a comparative way, Red List classification and lifestyle groups were used to analyse the species set and to get an insight which traits may be connected with the ecology or threat of species.
Chapter 4 was designed to compare the influence of land-use history on vascular plants and cryptogams. I compared the results of previous studies on the vascular plant cover of ancient and recent dry calcareous grasslands to the cryptogam vegetation of these sites. I also applied Ellenberg indicator values and, like it was done in the vascular plant studies, the indicator species concept.
In Chapter 5, I present the first survey of the cryptogam vegetation of the grassland
management project of Baden-Wuerttemberg. Using eight study sites the cryptogam
vegetation found in the management and successional plots is compared. After a project term
of 37 years, I assessed the effects of grazing, mowing and different mulching regimes as well
- 5 -
Chapter 1 General introduction
as of succession on the cryptogam vegetation, and give recommendations for the management and establishment of species-rich sites.
Chapter 6 is a holistic approach applying the three concepts of species identity, Ellenberg indicator values, and functional traits to analyse the influence of management and past draining on the macromycete funga of a calcareous fen, the Sippenauer Moor. I assessed changes by comparing the present mapping data with data from a study carried out in 1998 and 1999.
Finally, Chapter 7 provides a general discussion and conclusion of the studies and data
presented in the previous chapters. In form of an outlook, perspectives for further studies are
given.
- 6 -
Chapter 2 Ellenberg indicator values
Chapter 2 – Ellenberg indicator values for macromycetes – a methodological approach and first applications
Abstract
In ecological research, Ellenberg indicator values (EIVs) are used to describe the realised niche of species and habitat parameters. This easy-to-use tool is commonly used for vascular plants, bryophytes, and lichens, but not yet for fungi. Here we provide a methodology for EIVs for fungi and compiled EIVs for nearly 650 species of macromycetes that have been thoroughly surveyed in recent studies. We propose two new EIV scales, namely substrate openness (O) and hemeroby (H). We also give the results of two applications and compare EIV values related to the Red List classification with those related to lifestyle classification.
The EIVs light intensity, substrate nutrient availability, substrate openness, and hemeroby related to these two classifications significantly differed. Critically endangered species on average have distinctly higher demands regarding light and substrat openness than not or less strongly threatened ones, which in turn are more tolerant to human impact and have higher demands in nutrient availability. Mycorrhizal species on average have higher demands on substrate openness and are less tolerant to high nutrient levels than saprobiotic or parasitic species. This pattern clearly highlights the points of threat for many macromycete species.
Key words: continentality, light intensity, substrate moisture, substrate nutrient content, substrate salt content, substrate reaction, substrate exploitability, mean annual temperature.
Introduction
In Central Europe and adjacent countries, Ellenberg indicator values (EIV; e. g.: E
LLENBERG1974; E
LLENBERGet al. 2001) are commonly used to describe ecological parameters. These
parameters are related to climate and soil conditions. In addition, in Germany, a frequency
measure of the percentage of occupied fields of the topographical map (1:25,000) is also
given (E
LLENBERG2001). Climatic parameters include light intensity, mean annual air
temperature, and continentality; substrate parameters include moisture, reaction (pH range),
nutrient availability, and salt content. The realised niche of a species is assessed, and EIVs are
- 7 -
Chapter 2 Ellenberg indicator values
assigned to it using scales that classify the respective parameters. For Central Europe, such values have been compiled for vascular plants (E
LLENBERG1974; L
ANDOLT1977;
E
LLENBERG2001; W
EBER2001), bryophytes (D
ÜLL2001), and lichens (W
IRTH2001). In turn, mean values can be calculated for study areas after recording the floristic composition or the plant cover or both, and the mean EIVS of, e.g., air temperature and soil moisture of different study areas can be compared. Thus, EIVs allow study plots, habitats, or whole landscapes to be easily characterized, and this method is therefore widely used in environmental (impact) assessments or to quickly identify environmental filters in plant, habitat, or landscape ecological studies.
However, it should be mentioned that EIVs were developed only in part from actual measurements of parameters, such as temperature and moisture (cf. T
HOMPSONet al. 1993). In most cases, these values are partially or predominately subjective ratings and thus represent empirical evaluations – the “expert opinion” – of the author (cf.: D
IERSCHKE1994;
E
LLENBERGet al. 2001), partly because parameter measurements for many species are lacking. From their inception, EIVs were designed to relate to ecological conditions integrated over the entire year (E
LLENBERG2001). In many cases, it would often be too complicated and time consuming to make measurements, especially because measurements always are punctual in time or space or both. Although this foundation of predominantly subjective opinions instead of measured data could be considered a weak point of the EIV concept, several studies have shown a distinct and universal correlation between EIVs and actual measurements of the respective ecological parameters (E
RTSENet al. 1998; S
CHAFFERS&
S
ÝKORA2000; E
LLENBERG2001; D
IEKMANN2003; S
MART& S
COTT2004; H
ALBWACHS&
B
ÄSSLER2013; B
ARTELHEIMER& P
OSCHLOD2015), or at least such a correlation within the same vegetation type (W
AMELINKet al. 2002). EIVs, therefore, are a very useful tool in ecological research, but their empirical nature should be kept in mind.
Fungi comprise a wealth of species important in ecology and conservation (H
ARLEY1971;
C
ARROLL& W
ICKLOW1992; W
INTERHOFF1992;
VAN DERH
EIJDEN, M. G. A. et al. 1998;
VAN DERH
EIJDEN, M. G. A. 2002; B
LACKWELL& S
PATAFORA2004), but they have not yet been evaluated using EIVs. This lack of EIVs for fungi could be explained by the incomplete understanding of the lifestyle of many fungal species, and by the high number of species. In Bavaria (Germany) alone, there are at least 5,000 species of macromycetes (K
ARASCH&
H
AHN2009); worldwide, over 1.5 million fungal species might exist (H
AWKSWORTH1991;
H
AWKSWORTH2001). The use of EIVs for fungi could promote further ecological research
and help in understanding fungal species.
- 8 -
Chapter 2 Ellenberg indicator values
We aimed at taking the first step in developing EIVs for fungi. We compiled a “classic” set of EIVs (E
LLENBERG2001) using a dataset of 636 macromycete species recently ecologically characterised (S
IMMEL2011a; S
IMMEL2011b; S
IMMEL2013a; S
IMMEL2013b; S
IMMEL&
K
RONFELDNER2013). We also propose an additional scale for the evaluation of substrate openness (i.e., its accessibility and exploitability), and another scale that takes into account the hemeroby concept (Z
ECHMEISTER& M
OSER2001; K
LOTZ& K
ÜHN2002; W
ALZ& S
TEIN2014) for fungi. In addition to these methodological aspects, we present applications using the Red List category and the lifestyle types of the species.
Materials & Methods
“Classic” EIVs
We considered the following seven indicator values of the EIV system as compiled by E
LLENBERG(2001): L (light intensity), T (mean annual air temperature), K (continentality), F (substrate moisture), R (substrate reaction), N (substrate nutrient availability), and S (salt content of the substrate). We also used the non-EIV frequency measure (M), i.e., the percentage of occupied fields of a 1:25,000 topographical map. Scales of six of these values have 9 tiers; the F scale has twelve tiers (including also 3 tiers for living partially, seasonally, or completely submerged), and that of S has ten tiers (including also 1 step for intolerance of elevated salt contents: “glycophytes”); see Table 3. We used these scales for fungi in the same way as for lichens, bryophytes, and higher plants, with the considerations on L, K, F, and N given below. To enlarge the ecological spectrum covered by EIVs for fungi, we propose two additional scales (see “Additional scales”).
When dealing with indicator values for fungi, especially two aspects should be taken into account: (i) while “atmospheric” environmental factors, such as temperature, have an influence on both soil-inhabiting species and those thriving on or in special substrates (cf.
P
ARTON& L
OGAN1981), the influence of soil parameters, such as moisture and reaction, is more or less limited to the soil body itself or is transmitted to other substrates in a weakened or altered form; and (ii) fungi can grow on a broad range of substrates, from soil to dead and living plants or animals or parts of them.
An indicator value dealing with light requirements might be considered dispensable for fungi, as these organisms are saprobionts, mycorrhizal partners of green land plants or parasites without chlorophyll and, therefore, are not primary producers (C
ARROLL& W
ICKLOW1992;
L
ISIEWSKA1992; B
LACKWELL& S
PATAFORA2004). However, light is indeed important for
- 9 -
Chapter 2 Ellenberg indicator values
fungi. It plays an essential role in mycelial growth and fruit body formation for many species (M
ANACHÈRE1980; M
OORE1998; C
ORROCHANO& G
ALLAND2006; P
URSCHWITZet al.
2006), and although it is presumably not essential for the formation of primordia (M
OORE1998; C
ORROCHANO& G
ALLAND2006), the further development of fruitbodies strongly depends on light as a stimulus for correct growth, e.g., in Coprinus cinereus (Schaeff. : Fr.) Gray, which forms only dark stipes in the dark, and the fruitbodies of many species exhibit phototropism (M
ANACHÈRE1980; M
OORE1998; C
ORROCHANO& G
ALLAND2006).
Moreover, many macromycete species show a preference for open, i.e., well sunlit or dense, i.e., shaded, habitats. This of course can be explained in part by their nutrition source, e.g.
dead wood is more abundant inside forests and grassy substrates are usually commoner outside forests, but by far not completely. For example, in the case of the genus Agaricus L., which almost exclusively comprises soil saprobionts, the whole range can be seen from species growing in open grasslands (e.g., A. campestris L. : Fr.) to species growing in dense forests (e.g., A. silvaticus Schaeff.) (C
APELLI1984; K
RIEGLSTEINER& G
MINDER2010). For ectomycorrhizal fungi K
UMMEL& L
OSTROH(2011) found light to be strongly influencing the community structure. Therefore, we considered light as an indicator value for fungi. If one wants to emphasize the non-photosynthetic lifestyle of fungi, the light value could be re- interpreted as a “habitat openness” value, for which the focus then lies not on increasing strong solar radiation itself but rather on structures causing shading (see Table 1).
Table 1. Re-interpretation of the EIV light scale (L) of E
LLENBERG(2001) as a habitat openness scale.
EIV light Habitat openness
L1 In deep shade, may be less than 1% relative
insolation In confined sites between high rocks, in cave entrances etc.
L2 Between L1 and L3 Inside dense forests with closed canopy and dense young growth or shrub vegetation
L3 Shade plant, mostly less than 5% relative insolation Between L2 and L4
L4 Between L3 and L5 Inside light woodlands with open canopy
L5 Semi-shade plant, rarely in full light Semi-open at the forest edge, in light hedges etc.
L6 Between L5 and L7 Between L5 and L7
L7 Plant generally in well lit place, but also in partial shade
In the open landscape, but adjacent to scattered trees, in dense high-grass vegetation, etc.
L8 Light-loving plant, rarely found with < 40% relative
insolation Between L7 and L9
L9 Plant in full light, found mostly in full sun In completely open sites, i.e., distant to trees, shrubs, rocks, etc.
The continentality (K) is expected to play an important role in studies on a continental scale
(H
EILMANN-C
LAUSENet al. 2014), but is difficult to deal with for fungi in Central Europe
because only few species exhibit a more pronounced preference for either an oceanic or a
continental climate. Many macromycete species have a very wide distribution area, pro parte
even throughout the Holarctic or in both the northern and southern hemispheres (e.g.:
- 10 -
Chapter 2 Ellenberg indicator values
S
ERZANINA1984; W
ASSER1990; V
ELLINGA2004 (for Lepiotaceous fungi)). Therefore, K values of 5, which indicate species seemingly without preference for an oceanic or continental climate) and in quite few cases, K values of 4 or 6, which indicate suboceanic or subcontinental species, constitute almost the entire K scale given in the present study.
Many species of fungi, especially lower fungi, have an aquatic lifestyle and grow in or under water (M
UELLERet al. 2004: 513-586). By contrast, higher fungi, including subgroup macromycetes, are primarily found outside of the water body itself, but there are also exceptions, and the EIV scale for substrate moisture (F) should therefore also range from F1 to F12 for macromycetes. Species such as Lactarius lacunarum (Romagn.) J. E. Lange ex Hora, which grows in fens or on the edge of pools or creeks, have to be classified as F10, and other macromycetes, e.g. Vibrissea truncorum (Alb. & Schw.) Fr. (E
LLIS& E
LLIS1997) and Psathyrella aquatica J. L. Frank, Coffan & Southworth (F
RANKet al. 2010) have nearly or completely submerged fruit bodies and are therefore classified as F11 or F12.
The substrate nutrient availability value (N) has repeatedly been discussed in the past. Even E
LLENBERG(1974) was unsure about this indicator scale. He could characterize the minimum (N1, N2) and maximum values (N 8, N 9) well and easily classify the respective indicator species, but the gradient in between these values was difficult to determine. However, most species revealed tendencies, and at least approximate classifications were possible (E
LLENBERG1974; E
LLENBERG2001).
Whereas initially the N value was thought to be a classification refering solely to the nitrogen
content of the soil or rather that available for plants (E
LLENBERG1974), other authors came to
different results (e. g.: B
OLLER-E
LMER1977; F
RANKet al. 1990). In their works the
correlation between the N value and the soil content of all nutrients (i.e., including
phosphorous, potassium, etc.) was much more distinct than that with only nitrogen. These
authors advocated the use of the N value as “nutrient value” instead of “nitrogen value”, as
done for lichens (W
IRTH2001). Such a broader classification also solves the dilemma of
E
LLENBERG(2001) of how to achieve indicator scales for the soil content of phosphorous,
potassium, sulfur, and calcium, and it reduces the problems of classifying nitrogen availability
as described above because there is no longer a need to separate the influence of nitrogen
alone from that of other nutrients. In addition, it should be noted that the amount of accessible
nutrients differs among the various substrates. W
IRTH(2001) therefore considered terricolous
lichen species separately from corticolous and saxicolous species.
- 11 -
Chapter 2 Ellenberg indicator values
Nitrogen is increasingly important due to high, man-made atmospheric depositions (e. g.:
S
KEFFINGTON& W
ILSON1988; M
ATSONet al. 2002; P
HOENIXet al. 2006). By disarranging nutrient networks, these depositions lead to shifts in the abundance of species and thus to an increasing number of threatened or extinct species in nutrient- or nitrogen-poor habitats (S
KEFFINGTON& W
ILSON1988; A
RNOLDS1991; S
ALAet al. 2000; M
ATSONet al. 2002;
P
HOENIXet al. 2006; P
OSCHLOD2015).
The correlation of N values and nutrient (or nitrogen) content might still be only a part of the whole story. For example, H
ILL& C
AREY(1997) have shown that biomass yield fits better than soil nutrient content with N values, and proposed the name “productivity values” for N.
B
ARTELHEIMER& P
OSCHLOD(2015) even found 16 eco-physiological determinants of the N value.
In the present study, these issues were taken into account as follows. First, the N scale refers to the available nutrients as a whole. However, to a certain degree, we focused on nitrogen because excess nitrogen greatly influences mycorrhizal fungi and saprotrophic fungi growing on nutrient-poor substrates (cf.: A
RNOLDS1991; E
GERTON-W
ARBURTON& A
LLEN2000;
L
ILLESKOVet al. 2002; J
ANSSENSet al. 2010). Second, we considered the two substrate types soil and dead or living plants or animals separately. Third, biomass yield and other determinants were not considered, because very little data on this topic suitable for interpretations has been published.
Additional and excluded scales
We propose two additional indicator values for fungi, i.e., substrate openness and hemeroby.
The accessibility and exploitability of a substrate is of high relevance for newly arriving fungi. Therefore, we considered substrate openness (O value) as an indicator value, where
“substrate” refers to all nutritional sources that can be used by macromycetes, specifically soil
and dead or living plants or animals or parts of them. Soil has a quasi infinite spatial
expansion, whereas plants and animals are distinctly delimited in space and time and in most
cases develop and decay rapidly (L
ISIEWSKA1992). We therefore distinguished these two
substrate types and compiled separate scales for them (Table 2); this distinction is in
congruence with the separation of substrate types for the N value (see above). Because of
these separations in the O and N scales, species growing on soil are not to be directly
compared with those growing on plant or animal substrates. Difficulties in classification were
encountered for fungi growing on special substrates buried in the soil, e.g. Strobilurus
- 12 -
Chapter 2 Ellenberg indicator values
esculentus (Wulfen : Fr.) Singer growing on spruce cones and deadwood-inhabiting species thriving on roots. In such cases, the scale for plant and animal substrates is to be used despite of apparent terricolous occurrence.
For soil-inhabiting species, the substrate openness scale considered two factors: humus richness, i.e. soil thickness, and soil cover by litter and ground vegetation. Humus richness is important in determining the availability and amount of organic matter as well as characteristics such as soil structure and waterholding capacity (AK S
TANDORTSKARTIERUNG1996; A
D-H
OC-AG B
ODEN2005; B
LUMEet al. 2010). We adressed it according to the
“Humuszahl” (humus value) of L
ANDOLT(1977), whereas his “Dispersitätszahl”
(dispersability value) or “Durchlüftungsmangelzahl” (aeration deficiency value) was omitted as it does not yield a good differentiation (M
EIER2002). Soil aeration is explained well by water saturation and temperature (G
RUNDMANNet al. 1994; B
LUMEet al. 2010) and thus by the EIVs substrate moisture (F) and air temperature (T). Soil cover by litter or vegetation (e.g., a dense bryophyte layer) greatly affects the accessibility by dispersal units (spores, conidia) and also some chemical, physical, and biological characteristics (S
YDES& G
RIME1981; F
ACELLI& P
ICKETT1991; B
LUMEet al. 2010).
The scale for species growing on other substrates, such as living or dead plants or dung, was compiled based on the classification of wood rot stages by H
EILMANN-C
LAUSENet al. (2005) and P
OUSKAet al. (2011). Both provide a five-step scale, from dead but still hard to completely disintegrated wood. These five steps were supplemented by three types of living and one step for already (pre-)digested substrates based on remarks by L
ISIEWSKA(1992) and F
RANKLAND(1992).
The impact of human influence was evaluated using a seven-step hemeroby (H) scale
(S
TEINHARDTet al. 1999; K
LOTZ& K
ÜHN2002; W
ALZ& S
TEIN2014). The hemeroby
concept traces back to ideas of S
UKOPP(1969) and others. It classifies species, communities,
or habitats according to their occurrence completely without or with an increasing degree of
human impact (see Table 6). Many species tolerate different hemeroby intensities; therefore,
we noted their complete amplitude instead of using an average hemeroby or some extreme
value which would remove too much information. This holds true also for the EIVs, but these
have always been considered as single-value scores and are commonly used and interpreted as
such. For hemeroby, the opposite is the case (S. K
LOTZ, pers. comm. 2015). Therefore, we
used averaged hemeroby values (H
mean) only in calculations and not to describe the features of
- 13 -
Chapter 2 Ellenberg indicator values
a species or for non-mathematical ecological comparisons. To emphasize the amplitude character, the H
meanformula is given as (S. K
LOTZ, pers. comm. 2015):
H
mean= (x
-1× H
a) + (x
-1× H
b) + …,
where x is the number of H values (= size of the H amplitude) and H
a, H
b, etc. are the single H values of the respective species. The hemeroby concept is applicable at different levels, e.g., for individual substrate particles, landscape units, or map grids (S
TEINHARDTet al. 1999;
Z
ECHMEISTER& M
OSER2001; K
LOTZ& K
ÜHN2002; W
ALZ& S
TEIN2014).
Table 2. Compilation of a substrate openness scale (O), which distinguishes the two substrate types “soil” and “other substrates”, e.g., living and dead plants or parts of them.
Inhabiting soil Inhabiting other substrates O1 Soil humus-rich (raw
humus, peat, etc.)
Denselitter and/orground vegetation
Living and intact O2 Soil of medium humus-
richness (mull, etc.) Living and pre-injured (e.g., bark fissures, strong drought stress, pest infestation) O3 Raw soil with only weak
humus formation Substrate moribund
O4 Soil humus-rich (raw humus, peat, etc.)
Sparselitter and ground vegetation
Substrate dead and still near intact (wood: still hard, ± completely covered with bark, fresh phloem still present at least in parts; herbs: still green and sappy)
O5 Soil of medium humus-
richness (mull, etc.) Substrate dead and weakly disintegrated (wood: quite hard, no fresh phloem left) O6 Raw soil with only weak
humus formation
Substrate dead and disintegrated (wood: partly decayed and becoming soft; herbs: free from intact chlorophyll, beginning to lose their shape)
O7 Soil humus-rich (raw humus, peat, etc.)
Bare soil Substrate dead and strongly disintegrated (wood: decayed and soft throughout) O8 Soil of medium humus-
richness (mull, etc.)
Substrate dead and completely disintegrated (wood: very soft, disintegrating when lifted;
herbs: decayed) O9 Raw soil with only weak
humus formation Substrate (pre-)digested
The parameters evapotranspiration and air humidity both play an important role in the growth and endurance of fruitbodies (Z
OBERI1972; M
CK
NIGHT& E
STABROOK1990) and, together with temperature and air velocity, are important for spore release (Z
OBERI1964; Z
OBERI1972; P
ASANENet al. 1991). Furthermore, they are important criteria in the ecology of parasitic species (D
ICK1992; H
IRSCH& B
RAUN1992). However, these two factors are difficult to handle, in particular at small scales, due to microrelief, shading, wind regime, and other parameters (e.g., see the calculations and estimations applied by K
LEYER(1997)).
Classification concepts thus primarily are based on the scale of, e.g., water catchments
(Z
HANGet al. 2001) or of whole “life zones” (H
OLDRIDGE1967; L
UGOet al. 1999), and
therefore are primarily or exclusively practical at large scales, but hardly for describing a
particular study site. On such a small scale, it seems more reasonable to use a proxy for the
conditions of evapotranspiration and air humidity. In the EIV system, light intensity (L), air
temperature (T), and substrate moisture (F), and probably also continentality (K) values
- 14 -
Chapter 2 Ellenberg indicator values
evaluated together can be used as a substitute. Therefore, we did not consider evapotranspiration and air humidty and do not propose additional scales.
Table 3. Classification scheme for the hemeroby (H) of different urban and non-urban habitats, compiled using data from the literature (S
UKOPP1969; S
TEINHARDTet al. 1999; Z
ECHMEISTER&
M
OSER2001; K
LOTZ& K
ÜHN2002; D
IERSCHKE& B
RIEMLE2008; W
ALZ& S
TEIN2014).
non-urban habitats:
woodlands (including coppices and pioneer forest)
non-urban habitats:
open landscape
urban habitats
H1 Ahemerobic --
Presumably missing in Central Europe today due to emmision input also in high mountain regions H2;
otherwise: rock faces, glaciers and snow regions in still undisturbed alpine and nival mountain ranges
--
H2 Oligohemerobic
Primary or near-natural forests (including alluvial forests, etc.), extensively used forests (tree stock in accordance with the potential natural vegetation)
Coastal areas incl. tidal flats and dunes, unimpaired swamps and bogs, undisturbed alpine grasslands, salt marshes, sea
--
H3 Mesohemerobic
Extensively used forests (tree stock not in accordance with the pnv), coppices, hedgerows, avenues in extensively used surroundings
(Semi-)natural or grazed nutrient- poor grasslands, extensive alpine pastures, orchards, hay meadows not or weakly fertilized, heaths, burnt areas, fallow land, unobstructed waters in intact surroudings and their water body
Shrub vegetation, overgrown areas, fallow land on unimpaired soil (i.e., not impaired by soil compaction, soil sealing, overburden, etc.), wooded parts of landscape gardens, arboreta, undisturbed copses
H4 β-Euhemerobic
Intensively used forests, avenues in intensively used surroundings
Semi-intensively used pastures and meadows (2-3 cuts per year, fertilized with solid dung and artificial fertilizer), impaired waters and their water body, vegetation adjacent to moderately intensively used plantations or arable land
Green areas cut < 3 times per year, ornamental shrub plantings in landscape gardens, disturbed copses, avenues surrounded by large green areas, multi-annual flower beds
H5 α-Euhemerobic
Short-rotation plantations (fuel wood plantations, rotation time < 20-30 years)
Intensively used pastures and meadows (> 3 cuts per year, fertilizing includes liquid manure), moderately intensively used plantations (wine, fruit trees, etc.) and arable land, vegetation adjacent to intensively used plantations or arable land
Ornamental lawns not or only weakly fertilized
H6 Polyhemerobic -- Intensively used plantations and arable land
Scattered settlements/buildings,
flower/vegetable beds replanted ≥ once per year, ornamental lawns strongly fertilized and kept clean by weeding and use of herbicides, areas with partly sealed soil, dumps, quarries, vegetation adjacent to railway/street tracks (but excluding track borders themselves H7)
H7 Metahemerobic -- --
Dense settlement, industrial areas, harbors, airports, contaminated ecosystems, borders of railway/street tracks
- 15 -
Chapter 2 Ellenberg indicator values
Methods for the classification of species
Altogether, ten different scales were used for the classification of macromycete species (see also above): L, T, K, F, R, N, S, M, H, and O.
For L, T, K, F, R, N, S, and O, macromycete species were classified using distributional and ecological data from the literature, our own unpublished observations, and “expert opinions”
of the first and second authors. Especially useful were the five volumes of “Die Großpilze Baden-Württembergs” (K
RIEGLSTEINER2000a; K
RIEGLSTEINER2000b; K
RIEGLSTEINER2001;
K
RIEGLSTEINER2003; K
RIEGLSTEINER& G
MINDER2010), as they provide an abundant set of ecological observations for most basidiomycete species. We used the following approach:
1. We chose 12 model species with well-known ecology and distribution pattern that covered a range of different habitats, fruit body types, and environmental situations (see Table 5).
2. Scale values for the example species were worked out for air temperature (T), substrate moisture (F), substrate reaction (R), and substrate nutrient availability (N), and the values were calibrated; this calibration was used to substantiate the scale values. Mean values of T, F, R, and N calculated from the vascular plant and bryophyte vegetation present at the locations of the respective fungus species (data not shown) thus served as an additional guideline in the development of EIVs for those species.
3. Based on the results for the example species, the remaining species were classified in two steps. First, the ecology of the respective species was checked against that of the example species. Second, based on the similarity (or difference) in the ecological demands, the values for the respective species were chosen;
4. Finally, the species classifications were compared (and reworked, if necessary) in groups of ecologically similar species, p.p. also using additional referencing (see point 2.).
For the preparation of M (frequency) values, we used two different sets of distribution maps:
(i) “Die Großpilze Baden-Württembergs” (K
RIEGLSTEINER2000a; K
RIEGLSTEINER2000b;
K
RIEGLSTEINER2001; K
RIEGLSTEINER2003; K
RIEGLSTEINER& G
MINDER2010); and (ii) the
floristic mapping of Germany (www.pilze-deutschland.de). These data sets were
complemented by other sources, such as the floristic mapping of Austria
(www.austria.mykodata.net) when necessary or useful (e.g., to obtain an insight on the
- 16 -
Chapter 2 Ellenberg indicator values
distribution of species in case of obviously incomplete German maps). From these maps, the number of “Topographische Karten” (topographical maps 1:25,000) occupied by the respective species were counted. As the M scale uses the percentage of occupied Topographische Karten (E
LLENBERG2001), the counts could be directly translated into scale values.
The classification of hemeroby (H) made use of the ranking scheme given in Table 3. In this scheme, different habitat and site types are classified according to their degree of hemeroby.
The H values in turn represent the range of habitats in the hemeroby gradient in which the respective species occurs, giving both the minimum and maximum value. This range of occupied habitats was evaluated using published and personal mapping data and distribution maps.
Analysis of the EIV data
The list of EIVs for fungi was explored and comparatively studied in two analyses that used unweighted mean EIV values.
For this purpose, the species set was divided up based on either the species’ Red List status (Red List of Bavaria; K
ARASCH& H
AHN2009) or lifestyle, thereby providing an overview of the distribution of EIV values according to the respective classification. The amplitude of the EIVs was calculated as absolute and relative differences. Differentiation between groups was analyzed using ANOVA and Scheffé’s test as a post-hoc test in SPSS 23.0.0.0 (IBM SPSS Statistics 2015).
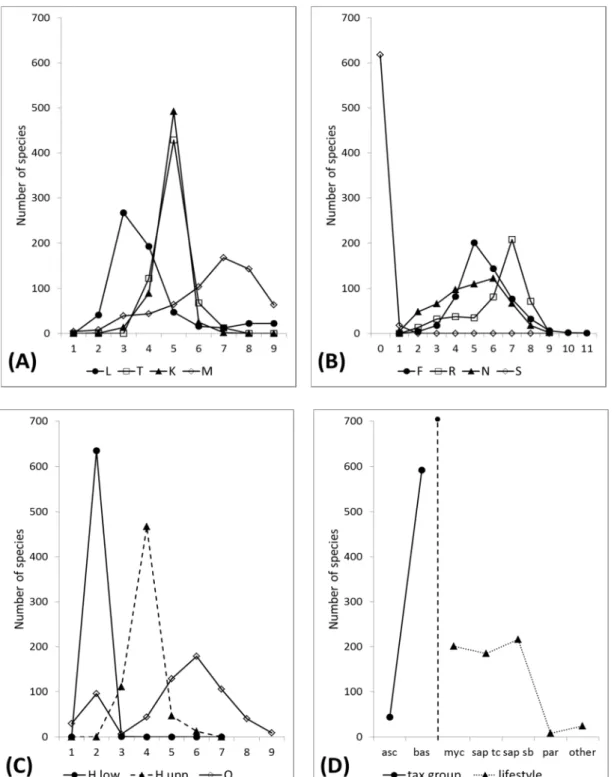
In addition, to visualise the distribution patterns, we used line charts (species numbers plotted against EIV gradients), as also done by E
LLENBERG(2001) for vascular plants.
Results
We used ten different scales (Tables 1-4) in our approach of macromycete classification,
including the newly developed indicator value substrate openness (O; Table 2) and hemeroby
(H), which was used for the first time for fungi. The other EIVs comprise light intensity (L),
air temperature (T), continentality (K), soil moisture (F), soil reaction (R), substrate nutrient
availability (N), and substrate salt content (S), and the frequency measure (M). Based on these
scales, we compiled a list of EIV values for fungi (Table 7 in Table Appendix). We
considered a total of 636 macromycete species, most of which belonged to the basidiomycetes
- 17 -
Chapter 2 Ellenberg indicator values
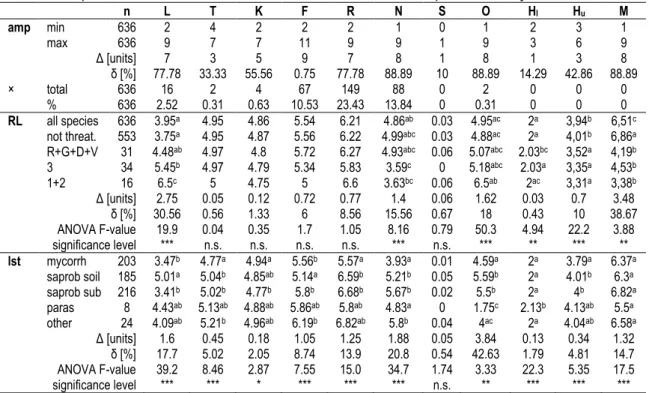
and have a mycorrhizal or saprobiotic lifestyle (Figure 1D). Our analyses (Table 6) revealed almost constant mean values for the EIVs air temperature (T), continentality (K), and substrate salt content (S) when Red List endangerment classes were compared ( ∆ ≤ 0.12 units).
Comparing not threatened and increasingly endangered species the mean values for the EIVs light intensity (L), frequency measure (M), substrate openness (O), and substrate nutrient availability (N) revealed large differences ( ∆ ≥ 1,4 units) and large percent differences ( δ = 15,6 - 38,7 %), with differences being significant for L, N, O, H
u(upper boundary of H), and M. When comparing the species’ lifestyles, significant differences were found for the EIVs L, T, F, R, N, O, H
u, and M.
Table 4. Definitions of the remaining EIVs used. Taken from E
LLENBERGet al. (2001).
Air temperature Continentality
T1 Indicator of cold conditions, found only in high mountain or
boreal-arctic regions, mostly in alpine and nival levels K1 Extremely oceanic species, in Central Europe only in a few outposts
T2 Between T1 and T3 K2 Oceanic species, mainly in the west, including western
Central Europe T3 Indicator of cool conditions, mainly subalpine K3 Between K2 and K4
T4 Between T3 and T5 K4 Suboceanic species, mainly in Central Europe, but
spreading eastward T5 Indicator of fairly warm conditions, from lowland to montane, but
especially in submontane-temperate sites K5 Intermediate species, weakly suboceanic to weakly subcontinental
T6 Between T5 and T7 K6 Subcontinental species, mainly in the east of Central
Europe and adjoining parts of Eastern Europe T7 Warmth indicator, in warm lowland sites and colline levels K7 Between K6 and K8
T8 Between T7 and T9 K8 Continental species, spreading into Central Europe
from the east only exceptionally T9
Indicator of extreme warm conditions, spreading from the Mediterranean only into the warmest places of the upper Rhine valley
K9 Extremely continental species, virtually absent from western Central Europe
Substrate moisture Substrate salt content
F1 Indicator of xeric conditions, restricted to soils drying out
intermittently S0 Glycobiont, tolerating fresh water only
F2 Between F1 and F3 S1 Tolerating certain salt concentrations, but mostly on
substrates poor in chloride F3 Indicator of rather xeric conditions, more often found on dry
ground than on moist places, never on damp soil S2 Oligohaline (I), mainly on substrates with very low chloride content
F4 Between F3 and F5 S3 β-Mesohaline (II), mainly on substrates with low
chloride content F5 Indicator of mesic conditions, mainly on fresh soils of average
dampness, absent from both wet and dry ground S4 α/β-Mesohaline (II/III), mainly on substrates with low to moderate chloride content
F6 Between F5 and F7 S5 α-Mesohaline (III), mainly on substrates with moderate
chloride content F7 Indicator of rather hygric conditions, mainly on constantly moist
or damp, but not on wet soils S6 α-Meso/polyhaline (III/IV), on substrates with moderate to high chloride content
F8 Between F7 and F9 S7 Polyhaline (IV), on substrates with high chloride
content F9 Indicator of hygric conditions, often on water-saturated, badly
aerated soils S8 Euhaline (IV/V and V), on substrates with very high
chloride content
F10 Indicator of occasionally, but only temporary flooded sites S9 Euhaline to hyperhaline (V-VI), on substrates with high and, during drought periods, extreme salt content F11 Rooting under water, but at least intermittently exposed to the
air, or plant floating on the surface
F12 Submerged, permanently under water or nearly so
- 18 -
Chapter 2 Ellenberg indicator values
Table 4 continued
Substrate reaction Substrate nutrient availability
R1 Indicator of extremely acidic substrate, never found on weakly
acidic or basic substrate N1 Indicator of sites extremely poor in available nutrients
R2 Between R1 and R3 N2 Between N1 and N3
R3 Indicator of acidic substrate, mainly on acid substrate, but
exceptionally also on nearly neutral one N3 Indicator of sites more or less poor in available nutrients
R4 Between R3 and R5 N4 Between N3 and N5
R5 Indicator of moderately acidic substrate, only occasionally found
on very acidic or on neutral to basic substrate N5 Indicator of intermediate nutrient availability
R6 Between R5 and R7 N6 Between N5 and N7
R7 Indicator of weakly acidic to weakly basic substrate, never found
on very acidic substrate N7 Species often found in places rich in available nutrients
R8 Between R7 and R9 N8 Between N7 and N9
R9 Indicator of basic substrate, always found on calcareous
substrate N9 Indicator of extremely rich situations, such as cattle
resting places or polluted rivers Frequency (occupied squares of topographical map grid)
M1 Extremely rare, only in a few squares M2 Very rare, in about 1% of the squares M3 Rare, in about 5%
M4 Moderately rare, in about 10%
M5 Neither rare nor frequent, in about 25%
M6 Between 5 and 7, moderately frequent M7 Frequent, but not everywhere, in about 50%
M8 Very frequent, in about 75%
M9 Nearly everywhere, lacking only in a few squares
When we plotted species numbers against the EIV gradients (Figure 1 A-C), different distribution patterns were visible. For the EIVs T, K, F, and the upper boundary of H, the distribution had a marked maximum near or at the center value of 5; for L, M, R, S, and the lower boundary of H the distribution was more skewed to the left or right. For EIVs O and N, the distribution was bimodal or more flattened, respectively.
Discussion
We present the first proposal of Ellenberg indicator values for fungi. For most of the 636 macromycete species considered, all indicator values except continentality (K) were easy to classify. However, a certain proportion of fungi had to be classified as “indifferent” (Table 6;
indicated by “×” in the EIV list) at the respective value because the ecological behavior of the species was not distinct or limited enough to describe it by a single value (cf.: E
LLENBERG1974; E
LLENBERG2001). The newly introduced indicator value substrate openness (O) and the hemeroby (H) – applied to fungi for the first time –, were also both easy to classify. By contrast, continentality (K) values were similar for a large part of the species. As described above many fungus species do not exhibit clearly visible preferences within the gradient of continentality, probably owing to their wide distribution areas (S
ERZANINA1984; W
ASSER1990; V
ELLINGA2004), resulting in K values primarily of 5 or occassionally 4 or 6.
- 19 -