Lifetime Measurements in Neutron-rich Isotopes close to N = 40 and
Development of a Simulation Tool for RDDS Spectra
Inaugural-Dissertation Erlangung des Doktorgradeszur
der Mathematisch-Naturwissenschaftlichen Fakultät der Universität zu Köln
vorgelegt von
Thomas Christian Braunroth
aus Frechen
Hundt Druck GmbH, Köln
2017
Berichterstatter:
(Gutachter) Prof. Dr. Alfred Dewald
Prof. Dr. Jan Jolie
Tag der mündlichen Prüfung: 10. Oktober 2017
Abstract
The main topic of the present work is the experimental determination of level lifetimes in 58,60,6224Cr by means of the recoil distance Doppler-shift technique. The correspond- ing experiment was performed at the National Superconducting Cyclotron Laboratory at Michigan State University (USA). Excited states in58,60,62Cr were populated by one- proton knockout reactions from fast radioactive59,61,63Mn beams.
Level lifetimes were determined for the 2+1 and4+1 states as well as in case of58,60Cr for the 6+1 states. The determinedB(E2; 2+1 →0+gs) values in 58,60,62Cr are in reasonable agreement with previous results from intermediate Coulomb-excitation experiments, al- though the present data suggests slightly enhanced collectivity. In58Cr, theB(E2) values of the 4+1 →2+1 and 6+1 →4+1 transitions are comparable to the B(E2; 2+1 → 0+gs) value.
From 58Cr to 60,62Cr, the B(E2; 4+1 → 2+1) values evolve more rapidly compared to the B(E2;2+1 →0+gs) values which suggests rotor-like behaviour with pronounced quadrupole deformations ∼0.3.
Compared to the neighbouring iron isotones, the evolution of B(E2) values along the chromium isotopes toward N = 40indicates a comparable trend, although the collectiv- ity in chromium appears to be mildly enhanced.
The experimental results are discussed in the shell-model framework using the eective interaction LNPS. The comparison shows a pleasant agreement, although the experimen- tal data suggests a slightly stronger enhancement of collectivity toward N = 40.
Calculations with the interacting boson model were performed for 56,58,60,62Cr. They are able to reproduce the experimental excitation energies and transition strengths with reasonable accuracy but do not indicate a signicant degree of quadrupole deformation.
Other isotopes that were produced in the experiment were investigated with respect to the identication of γ-ray transitions and level lifetimes. Of particular interest are the neutron-rich 59,61Mn isotopes (Z = 25), for which level lifetimes of the 7/2−1, 9/2−1 and 11/2−1 states were determined (in 61Mn the assignment is only tentative). In addition, level lifetimes in 63Mn of the tentatively assigned (7/2−1) and (9/2−1) states were eval- uated. The results are compared to shell-model calculations using the f p interaction KB3G as well as the state-of-the-art interaction LNPS-m. The present data indicates a structural change close to N = 36. The experimental data for 61Mn suggests that the B(M1) value for the 7/2−1 → 5/2−gs is underestimated by the LNPS-m interaction when freeg factors are used.
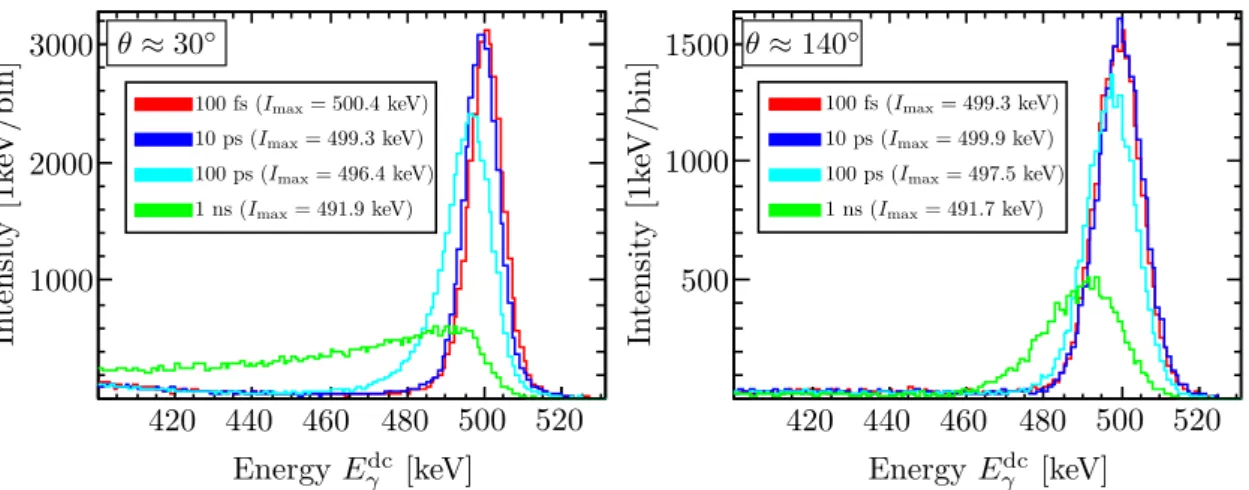
In the second part of this thesis, a tool is presented which allows to generate γ-ray spectra of lifetime studies based on the electromagnetic Doppler-shift using empirical parameters. The tool is highly exible which enables the incorporation of various ex- perimental bounding conditions. It is applied to investigate the inuence of velocity distributions on the lifetime analysis and results indicate that systematic deviations are minimized if distance-dependent mean recoil velocities are taken into account.
Zusammenfassung
Kernziel dieser Arbeit ist die experimentelle Bestimmung der Lebensdauer angeregter Kernzustände in 58,60,62Cr unter Verwendung der etablierten Recoil Distance Doppler- shift Methode, aus denen modellunabhängige Übergangswahrscheinlichkeiten gewonnen werden können.
Das dazugehörige Experiment wurde am National Superconducting Cyclotron Labora- tory an der Michigan State University (USA) durchgeführt. Hierbei wurden angeregte Kernzustände in 58,60,62Cr durch Protonen-Knockout an schnellen 59,61,63Mn-Isotopen bevölkert. Im Rahmen dieser Arbeit konnten Lebensdauern der Zustände2+1,4+1 sowie im Falle von58,60Cr der6+1 Zustände bestimmt werden. In58,60,62Cr sind die experimen- tellen reduzierten Übergangswahrscheinlichkeiten des 2+1 → 0+gs Übergangs in Einklang mit bereits bekannten Übergangsstärken, die aus Experimenten unter Verwendung der Coulomb-Anregung gewonnen wurden, obschon die vorliegenden Were ein höheres Maÿ an Kollektivität vermuten lassen. Die 4+1- und 6+1-Zustände in 58Cr zeigen ein dem 2+1 Zustand ähnliches kollektives Verhalten, während aus den Übergangsstärken bestimmte Verhältnisse in 60,62Cr eher auf Rotor-artiges Verhalten mit ausgeprägten Quadrupolde- formationen β2 ∼0.3 hinweisen. Verglichen mit den benachbarten Eisen-Isotonen zeigen die Chrom-Isotope eine ähnliche kollektive Entwicklung hin zu N = 40, obschon diese in Chrom leicht erhöht erscheint.
Die Ergebnisse werden im Rahmen des Schalenmodells unter Verwendung der modernen Wechselwirkung LNPS in einem erweiterten Modellraum diskutiert. Dabei wird eine gute Übereinstimmung beobachtet, wobei die LNPS-Rechnungen den experimentell beobach- teten Anstieg der Kollektivität hin zuN = 40tendenziell unterschätzen.
Für neutronenreiche Chrom-Isotope wurden Rechnungen im IBM durchgeführt. Diese reproduzieren die experimentellen Daten mit zufriedenstellender Genauigkeit, bedingen allerdings kein hohes Maÿ an Quadrupoldeformation.
Weitere im Rahmen dieses Experiments bevölkerte Isotope wurden untersucht. Hervor- zuheben sind hierbei die neutronenreichen59,61Mn Isotope, für die Lebensdauerinforma- tionen der angeregten 7/2−1,9/2−1 und 11/2−1 Zustände (die Zuordnung in 61Mn ist bis dato nur vorläug) extrahiert werden konnten. Ferner konnten in63Mn die Lebensdauer zweier angeregter Zustände bestimmt werden, deren Zordnung zu 7/2−1 und 9/2−1 noch bestätigt werden muss. Die Diskussion dieser Ergebnisse im Rahmen des Schalenmodells geschieht durch Vergleich mit der KB3G Wechselwirkung sowie der weiterentwickelten LNPS−m Wechselwirkung. Dabei wird eine strukturelle Veränderung in unmittelbarere Nähe zuN = 36beobachtet. Dies ähnelt dem Verhalten der benachbarten Eisen-Isotope.
Zum Abschluss wird eine Simulation vorgestellt, mit der unter Berücksichtigung rein em- pirischer Parameter Simulationen von Lebensdauermessungen im Pikosekunden-Bereich durchgeführt werden können. Das Programm zeichnet sich durch ein hohes Maÿ an Flexi- bilität aus, sodass unterschiedliche experimentelle Randbedingungen berücksichtigt wer- den können. Im Rahmen dieser Arbeit wird die Anwendung dieses Programms auf die Untersuchung von Geschwindigkeitsverteilungen mit relativen Breiten bis zu∼30 % dis- kutiert. Die Ergebnisse erlauben den Rückschluss, dass die Annahme von abstandsab- hängigen mittleren Rückstoÿgeschwindigkeiten in der Lebensdaueranalyse systematische Abweichungen minimieren.
Contents
I. Lifetime Measurements in Neutron-rich Isotopes close to N = 40 1
1. Introduction 2
1.1. The Recoil Distance Doppler-Shift Technique and its Application at NSCL 4
2. Experimental Setup 7
2.1. Development and Purication of the Cocktail Beam . . . 7
2.2. The Spectrograph S800 . . . 9
2.3. The Plunger Device TRIPLEX . . . 11
2.4. The Segmented Germanium Array . . . 13
3. Data Preparation 15 3.1. The SeGA in Plunger Conguration . . . 15
3.1.1. Geometry of the SeGA Detectors . . . 15
3.1.2. Data Taken with a Standard152Eu Source . . . 17
3.1.3. Background Measurement . . . 22
3.1.4. Doppler Reconstruction . . . 23
3.2. Plunger Device . . . 25
3.2.1. Calculation of Zero Osets . . . 25
3.2.2. Calculation of Absolute Foil Separations . . . 28
3.2.3. Plunger Foil Thicknesses . . . 28
3.3. S800 Calibration . . . 30
3.3.1. Calibration of the CRDC Detectors . . . 30
3.3.2. Calibration of the Ionisation Chamber . . . 31
3.3.3. Correction of Time-of-Flight Signals . . . 32
3.4. Particle Identication and Gate Conditions . . . 36
4. Analysis 39 4.1. Determination of Transition Energies . . . 39
4.2. Lifetime Estimates from Decay Curves . . . 39
4.3. Determination of Level Lifetimes Using a Realistic Monte Carlo Simulation 40 4.3.1. Relativistic eects . . . 41
4.3.2. Eect of the Level Lifetime on the Line Shape . . . 42
4.3.3. Changes to the Code G4LifeTimeG . . . 42
4.4. Error Estimates . . . 43
4.5. Calculation of Transition Strengths and Related Signatures . . . 47
5. Results 49 5.1. Composition of the Cocktail Beams . . . 49 5.2. 58Cr34- Measurement of γ-Ray Transition Energies and Level Lifetimes . 53
Contents
5.3. 60Cr36 - Measurement of γ-Ray Transition Energies and Level Lifetimes . 59 5.4. 62Cr38 - Measurement of γ-Ray Transition Energies and Level Lifetimes . 64
5.5. Vanadium Isotopes . . . 69
5.5.1. 56V33 - Measurement of γ-Ray Transition Energies . . . 69
5.5.2. 55V32 - Measurement ofγ-Ray Transition Energies and Level Life- times . . . 70
5.6. Other Chromium Isotopes . . . 73
5.6.1. 57Cr33 - Measurement of Level Lifetimes . . . 73
5.7. Manganese Isotopes . . . 76
5.7.1. 59Mn34 - Measurement of Level Lifetimes . . . 76
5.7.2. 61Mn36 - Measurement of Level Lifetimes . . . 80
5.7.3. 63Mn38 - Measurement of Level Lifetimes . . . 83
5.8. 64Fe38 - Measurement of Level Lifetimes . . . 87
5.9. Summary . . . 90
6. Discussion 91 6.1. Qualitative Discussion for Even-Even Nuclei . . . 91
6.2. The Interacting Boson Approximation . . . 95
6.2.1. Choice of the IBM-1 Hamiltonian . . . 95
6.2.2. IBM-1 Calculations for Neutron-Rich Cr Isotopes . . . 97
6.2.3. Comparison of58,60,62Cr with the Critical Point Symmetry E(5) . . 100
6.3. Shell Model Framework . . . 102
6.3.1. Comparison of58,60,62Cr with the LNPS Interaction . . . 102
6.3.2. Comparison of59,61,63Mn with the KB3G and LNPS-m Interactions 106 7. Summary 112 II. Development of a Simulation Tool for RDDS Spectra 113 8. Motivation 114 9. Basic Properties 116 9.1. Sketch of an Iteration . . . 117
9.2. Tracking of Events . . . 118
9.3. Limitations . . . 119
10.Proof of Principles 120 10.1. Simulation of 58Cr . . . 120
10.2. Determination of Absolute Foil Separations in a Multi-Nucleon Transfer Experiment . . . 122
10.3. The Impact of Velocity Distributions on RDDS Spectra . . . 124
11.Summary 130
A. Considered Transitions in 152Eu Data 131
Contents
B. Decay Curves in 58,60,62Cr 132
C. Reacted Beam Cuts 134
D. Experimental Data - Systematics 138
E. Theoretical Calculations 142
E.1. Shell-Model Calculations for56,58,60,62,64Cr . . . 142 E.2. Shell-Model Calculations for59,61,63Mn . . . 144
F. Input Parameters for the Monte Carlo Simulation 146
Bibliography 152
Part I.
Lifetime Measurements in Neutron-rich Isotopes close to
N = 40
1. Introduction
The atomic nucleus is a many-body system consisting of interacting fermions, represented by the neutrons and the protons. The fermionic nature of the nucleons in combination with the attractive nuclear potential leads directly to inherent shell-like congurations.
From an experimental perspective, Kurt Guggenheimer in 1933 was among the rst to link discontinuities in the (neutron/proton) separation energies at certain neutron/proton numbers to such a shell structure, which have been called magic numbers later on. How- ever, model-based theoretical calculations performed in the 1930's were able to reproduce only part of these numbers. It took over fteen years till the crucial role of the spin-orbit coupling for the nuclear structure was fully realized. Calculations within a mean-eld (shell) model performed by Maria Goeppert-Mayer and Hans Jensen showed that such a term in the Hamiltonian is mandatory to reproduce these magic numbers. In 1963, their eorts were rewarded with the Noble prize in physics and the nuclear shell model with its various derivatives can safely be considered as one of the corner stones in modern nuclear physics.
In recent years it was found that the magic numbers cannot retain their universal char- acter when leaving the valley ofβstability toward nuclei with extreme isospins as a result of residual nucleon-nucleon interactions. Examples for collapsing shell closures, e.g. in
32
12Mg20 [Dét79; Mot95] and 4214Si28 [Bas07], as well as emerging shell gaps, e.g. in 248O16
[Hof09; Kan09] and5420Ca34[Ste13], were found in the light to medium mass region of the nuclear landscape. Many of these observations were enabled by the advent of Radioac- tive Ion Beam (RIB) facilities in conjunction with ecient (and segmented) High-Purity Germanium (HPGe) arrays and highly ecient spectrometers for particle-identication purposes, which have allowed to expand the borders of experimentally accessible nuclei step by step toward the proton and neutron drip lines. Many eorts were also invested to understand the shell evolution, i.e. the evolution of single-particle energies as a function of neutron and proton numbers (N and Z), in regions characterized by rapidly changing structures, e.g. in the vicinity of emerging/collapsing shell closures.
One example is the so-called island of inversion around32Mg, where deformed2p−2h intruder congurations are energetically favoured compared to canonic0p−0hstructures.
Another interesting region of the nuclear landscape is given by the neutron-rich isotopes around 68Ni (N = 40), where the emergence of another island of inversion around 64Cr was suggested [Len10].
In68Ni, the high2+1 state energy of 2033 keV [Bro95] as well as the small reduced transi- tion strength of B(E2;2+1 →0+gs)=51(12)e2fm4 [Sor02; Bre08] are substantial signatures expected for a nucleus at a (sub-)shell closure. In addition, the existence of low-lying 0+ states is interpreted due to n-particlen-hole excitations related to shape coexistence (see, e.g., Ref. [Tsu14]), which is believed to act as a doorway toward the island of in- version (see, e.g., Ref. [Now16]). The interpretation ofN = 40as a (sub-)shell closure is questioned by the fact that only a weak and very localized closure in 68Ni was observed
Figure 1.1.: Systematics of excitation energies for the rst 2+ state (E(2+1)) (top) and B(E2; 2+1 → 0+gs) values (bottom) for even-even nuclei with 20 ≤ Z ≤ 28. Shown are experimental data published till the beginning of 2012.
[Gué07] and by a theoretical study of Langanke and colleagues [Lan03], which concludes that the calculated transition strength to the rst2+1 state in68Ni exhausts only a fraction of the low-lying B(E2) strength and that a signicant part of the experimental B(E2) strength resides in excited states above 4 MeV.
Reducing the number of protons by two, the even-even iron isotopes show rapidly de- creasing E(2+1) energies [ENSDF; Lid13] and increasingB(E2;2+1 → 0+gs) values [Lju10;
Rot11; Cra13] toward N = 40. Within the shell model, this onset of quadrupole collec- tivity is only reproduced if the neutron valence space is expanded with theg9/2 and d5/2 orbitals. One interaction tailored to such an enlarged model space is the eective interac-
1. Introduction
tion LNPS [Len10], which has been applied successfully to various isotopes in theN = 40 region [Rec12; Cra13; Lou13; Rec13]. Shell-model calculations using the LNPS interac- tion were performed for chromium isotopes and predict a rapid increase in quadrupole collectivity toward N = 40 which is associated with a pronounced quadrupole deforma- tion (β2 ∼0.3) as a result of signicant contributions from neutron2p−2h and 4p−4h excitations [Len10]. In fact, the experimental E(2+1) values in 60,62,64Cr36,38,40 depicted in Fig. 1.1 show a monotonic decrease [Sor03; Zhu06; Gad10].
The main motivation of the present work is to investigate the evolution of quadrupole collectivity toward N = 40 in more detail. For this purpose, lifetimes of excited states in 58,60,62Cr were measured with the recoil distance Doppler-shift (RDDS) technique, which allows a model-independent determination of reduced transition strengths. The present experiment was performed at the National Superconducting Cyclotron Labora- tory (NSCL) at the Michigan State University (MSU).
Prior to the experiment, only the B(E2; 2+1 → 0+gs) value in 58Cr was known from a Coulomb-excitation experiment performed at intermediate energies [Bür05]. In ad- dition, a complimentary Coulomb-excitation experiment on 58,60,62Cr was performed in 2010. The results were published in 2012 [Bau12] and support the predicted increase of collectivity. Still, information on transition strengths for higher-lying transitions are mandatory to describe the structure of these nuclei in more detail, e.g. in terms of the nuclear shape.
This part of the thesis reports on the results of this experiment for58,60,62Cr as well as for neighbouring nuclei, in particular 59,61,63Mn.
1.1. The Recoil Distance Doppler-Shift Technique and its Application at NSCL
Lifetimes of excited states in neutron-rich chromium isotopes were measured with the established RDDS technique (see Ref. [Dew12] for an extended review), which can be applied to investigate level lifetimes in the ps range. Following the systematics in neigh- bouring iron and chromium isotopes as well as theoretical predictions, level lifetimes for low-lying yrast states in58,60,62Cr within the range of 1 ps to 200 ps were expected, which made the RDDS technique applicable. Using the present experiment as a guideline, its application at NSCL is briey outlined in the following.
A radioactive cocktail beam is produced by fragmentation of a82Se (E= 140MeV/u) beam on a9Be production target. The cocktail beam is then ltered for the desired iso- tope (here: 59,61,63Mn) via the in-ight separation technique using the fragment separator A1900 [Mor03] (see Sec. 2.1).
The puried cocktail beam is guided to the experimental place located right in front of the S800 spectrograph [Baz03], where it impinges on a secondary target foil located in the plunger device. Here, (excited) states in the nucleus of interest are populated by means of a suiting reaction mechanism (e.g. knockout, Coulomb excitation or multi-nucleon re- moval reactions). In the experiment at hand, a light and highly absorptive Be target1 is placed at the secondary target position, which is well-suited for the required one-proton
1The isotope9Be has no bound state. In the optical model it can be considered as a highly absorptive disk to incident particles.
1.1. The Recoil Distance Doppler-Shift Technique and its Application at NSCL
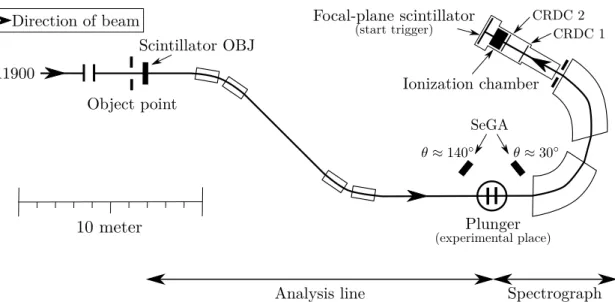
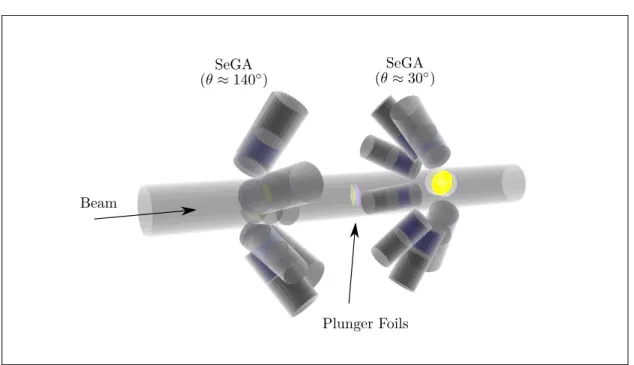
Figure 1.2.: Schematic sketch of the recoil distance Doppler-shift technique applied at the NSCL using the plunger device TRIPLEX (two-foil conguration), the Segmented Germanium Array and the magnetic spectrograph S800 in combi- nation with fast radioactive beams. Foil thicknesses ∆drefer to the present experiment.
knockout reaction mechanism.
Recoils leaving the experimental target have typically an energy of 90 MeV/u, correspond- ing to recoil velocities with respect to the speed-of-light (from now on called β velocity, β =v/c) of βT ≈0.4. A degrader made of gold is placed in a well-dened but adjustable separation with respect to the target and allows to slow down the recoils to βD ≈0.34.
The decay of an excited state follows the nuclear decay law and, thus, has a charac- teristic time behaviour. A detector placed at a polar angle θ with respect to the recoil trajectory will observe a Doppler-shifted energy Eds compared to the intrinsic γ-ray en- ergy E0 which depends on theβ velocity as well as the polar angle θaccording to:
Eds(β, θ) =E0
p1−β2
1−βcosθ (1.1)
Simplied speaking and neglecting decays within a foil, the de-excitations can take place either between the foils (characterized by theβvelocityβT) or behind the degrader (char- acterized by theβ velocityβD). The energy deposition of the experimentally detectedγ ray will therefore depend on the recoil position at the time of the emission. As a result, for each transition two peaks (labelled fast or target component (βT) and slow or degrader component (βD)) will occur in the γ-ray spectrum (at Doppler-shifted energies). The intensity ratio between the two peaks depends on the foil separation, the time behaviour of the feeding pattern as well as the level lifetime τ.
If the ight time through a foil is of the order of the lifetime, slowing-down processes will have a signicant impact on the line shape and, hence, need to be taken into account
1. Introduction
in the analysis. The Segmented Germanium Array (SeGA) was used in the present ex- periment for the detection of γ rays, with detectors placed in two rings at θ ≈30◦ and θ≈140◦ with respect to the beam axis.
Recoils leaving the plunger device enter the magnetic spectrograph S800 and are iden- tied by means of time-of-ight and energy-loss measurements. In addition, the recoil trajectory is reconstructed and the γ-ray energies are Doppler-reconstructed event by event, for which the recoil velocity vector behind the plunger foils as measured with S800 is taken into account.
A schematic sketch depicting the application of the RDDS technique at NSCL is shown in Fig. 1.2.
Major Dierences Compared to Standard Plunger Experiments
Compared to standard plunger experiments as performed, e.g., at the Cologne FN tandem facility, the discussed experiment diers in various aspects, of which the most important ones shall be outlined.
First, the required recoil identication demands the use of a degrader instead of a stopper. Due to the large recoil velocities, a separation of fast and slow component is feasible for ∆β =βT−βD&6%, with the precise value depending on the energy of the γ-ray transition and the detector angle.
Second, the beam energies are signicantly higher. They are of the order of a few MeV/uin standard experiments, while at NSCL they are around 100 MeV/ufor (ltered) radioactive beams produced by in-ight separation. It is therefore mandatory to take into account relativistic eects, such as Doppler broadening, the Lorentz boost and relativistic aberration eects.
Third, typical beam intensities at NSCL with the present setup are around 103 to 105pps and, hence, much lower compared to stable beam intensities of ∼ 1 −2pnA (∼1012pps). For compensation, the relativistic beam energies allow to use signicantly thicker foils with thicknesses between few hundred micrometers and few millimetres.
Still, experiments at the NSCL are low statistics experiments. Therefore only few foil separations are measured and the analysis is limited to particleγ(instead of particleγγ) coincidences.
Fourth, lifetime experiments at the NSCL using fast beams are typically performed with direct reactions, which compared to fusion evaporation are characterized by low γ-ray multiplicities.
Fifth and as a consequence of the large recoil velocities of∼100µm/ps in combination with thick targets, the line shape of the observed γ-ray transition is often inuenced by slowing-down and solid-angle eects.
2. Experimental Setup
The present experiment was performed at the National Superconducting Cyclotron Lab- oratory at Michigan State University, USA. The NSCL facility plays a pivotal role in experimental nuclear structure as well as nuclear reaction physics and is one of the lead- ing facilities1 for experiments using the in-ight separation technique2 [Mor04], which is employed to produce radioactive beams at intermediate energies (E ∼100MeV/u) with high purities.
Main purpose of the experiment was a measurement of low-lying level lifetimes in
58,60,62Cr, which were populated by one-proton knockout from radioactive secondary beams 59,61,63Mn. For collective nuclei, the cross section of electromagnetic Coulomb interactions (at intermediate energies) exceeds the one-nucleon knockout reaction cross section usually by one order of magnitude. Still, the knockout reaction is a powerful tool since it benets from the dominating nuclear interaction, thereby enabling in the case of even-even nuclei a population of states beyond the rst2+ state.
For the present experiment, the settings of the fragments separator were optimized for each secondary beam to ensure high absolute secondary beam intensities while maintain- ing high beam purities. In addition, the plunger foil congurations were adjusted to the expected secondary beam intensities and level lifetimes. As a consequence, the experi- ment was divided into three parts characterized by three dierent experimental settings:
The rst setting was optimized for the secondary beam59Mn, while the second and third settings were optimized for the secondary beams61Mn and63Mn, respectively.
This chapter is structured as follows: In Sec. 2.1 the development of primary and secondary radioactive beams is described. Here, the focus is on the ltering of the cocktail beam using the A1900 fragment separator. In Sec. 2.2 the S800 spectrograph, its focal- plane detector system and its use for the particle identication is discussed. In Sec. 2.3 the plunger device TRIPLEX and the chosen foil congurations are explained. In the nal Sec. 2.4 of this chapter, the Segmented Germanium Array (SeGA) for the detection of γ rays is described.
2.1. Development and Purication of the Cocktail Beam
The Coupled Cyclotron Facility (CCF) [Mil01] provided a primary beam of 82Se, which was accelerated in the cyclotrons K500 and K1200 to an energy of 140 MeV/u.
1The leading role will be further cemented by the upcoming Facility for Rare Isotope Beams (FRIB) located at MSU, which will allow quantitative measurements in very exotic nuclei using fast, stopped and re-accelerated rare isotope beams.
2The GSI facility in Germany and the RIKEN facility in Japan follow a similar approach at higher beam energies.
2. Experimental Setup
Figure 2.1.: Schematic sketch depicting the primary beam development (CCF) and the ltering of the secondary cocktail beam (A1900). The direction of the beam is indicated by arrows. Scintillators, fragmentation target, wedge and relevant slit systems are shown. See text for details.
The development of the primary beam3 began with the extraction of 82Se out of the electron cyclotron resonance (ECR) ion source ARTEMIS [Koi00]. Following a pre- acceleration, 82Se particles were axially injected into the K500 cyclotron, in which they were accelerated up to an energy of 12.24 MeV/u. The K1200 cyclotron was then used to accelerate the particles to their nal energy of 140 MeV/u. The cyclotron was operated at a radio frequency set to 23.1392 MHz.
The primary beam of 82Se was then guided to the (primary) 9Be fragmentation target (FT) placed at the object point of the fragment separator A1900 [Mor03]. The induced fragmentation reactions produced a radioactive cocktail beam that consisted of a vast variety of isotopes south-west of8234Se (1 ≤Z ≤34,1 ≤N ≤48). The A1900 separated the constituents of the cocktail beam according to their magnetic rigidities, Bρ. The main components of the A1900 are two pairs of magnetic dipoles (D1/D2 and D3/D4), a wedge-formed aluminium degrader placed in-between these pairs, various slit systems as well as retractable detectors for particle-identication purposes (see Fig. 2.1 for a schematic sketch).
The wedge-formed aluminium degrader fulls two purposes: First, its shape leads to an energy loss∆E that depends on the recoil position along the dispersive axis. Fast recoils are thereby stronger decelerated compared to slow recoils. This has a focusing eect with respect to the energy. Second, theZ2 dependence of the stopping power reduces the contribution of undesired isotopes with dierent atomic number but comparable rigidities.
To limit the amount of (unreacted) primary beam particles, a beam stopper is placed at
3The experiment was proposed with a primary beam of76Ge, but it was performed with a then available beam of82Se. The fragmentation cross sections for the relevant Mn isotopes remain almost unchanged (see Refs. [Tar09; Tar13]), but still, there were two advantages: First,82Se was available with a higher beam intensity (35 pnA vs 25 pnA). Second,82Se was provided with a higher beam energy (140 MeV/u vs. 130 MeV/u), which is benecial for the ltering of the secondary beams.
2.2. The Spectrograph S800 Setting 1 Setting 2 Setting 3
Primary Beam 82Se with E = 140MeV/u FT 9Be thickness [cmmg2] 352 540 517
Bρof D1/D2 [Tm] 3.76189 3.73340 3.89370 Image 1 slits [mm] [-16:16] [-22.5:22.5] [-29.25:29.25]
Momentum acceptance±∆p [%] 1.09 1.53 1.98 Wedge 0◦ thickness [cmmg2] 390 240 180
Bρof D3/D4 [Tm] 3.36680 3.48130 3.70659 Focal-plane slits [mm] [-5:5] [-5:5] [-5:5]
Secondary beams 59Mn, 60Fe 61Mn, 62Fe, 63Mn, 64Fe,
63Fe,60Cr 65Fe,61Cr Intensity xMn [pps] 2.55·105 1.82·104 1.37·103 Energy before XFPxMn [MeV/u] 93.7 91.6 97.4
Purity at A1900 FPxMn [%] 53 40 16
Table 2.1.: Information on the A1900 settings and key properties of the secondary cocktail beams. The quoted secondary beam intensities and energies were provided by the A1900 group. See text for details.
the exit of the rst dipole magnet D1. The image 1 slits between D1 and D2 dene in rst order the momentum acceptance of A1900, while the image 3 slits between D3 and D4 in combination with the focal-plane slits improve the beam purity.
A 109-µm-thick plastic (BC404) scintillator (XFP) placed at the focal plane of A1900 is used for timing purposes, which during the experiment allows to identify the constituents of the cocktail beam by a time-of-ight measurement. Relevant quantities describing the experimental settings of A1900 and basic secondary beam properties are listed in Table 2.1. In Ref. [Mor03], the resolving power R of A1900 is quantied byR= 2915.
Downstream of the A1900 focal plane the particles follow a transfer line (∼ 25 m in length) toward the S800 spectrograph, which is explained in the following section.
2.2. The Spectrograph S800
After passing the transfer line, the secondary beam particles enter the S800 spectrograph [Baz03], which is shown schematically in Fig. 2.2. The S800 consists of two parts:
The analysis line
This part fullls beam-tuning purposes. It begins at the object point of S800 and ends at the experimental position where in the present experiment the plunger apparatus is placed. This position can be regarded as the pivot point of S800.
The spectrograph
The main components of the spectrograph are two 75◦ dipoles and the focal-plane detector system [Yur99].
2. Experimental Setup
Figure 2.2.: Schematic sketch of the S800 spectrograph, that consists of analysis line and spectrograph. See text for details.
The S800 was used in focused mode, which enables the maximum momentum acceptance and in which the coordinates of fragments/recoils at the S800 focal plane are sensitive to the incoming beam/recoil momenta.
The object point holds a 130-µm-thick plastic (BC404) scintillator (OBJ) for timing purposes which can be used for rates up to 1 MHz. The beam is guided from the object point toward the pivot point, where the plunger device is placed. Reacted and unreacted particles enter the spectrograph which separates them according to their rigidities. A slit system is placed right in front of the focal-plane detector system to prevent unreacted secondary beam particles from entering the focal-plane detector system.
Cathode Readout Drift Chambers
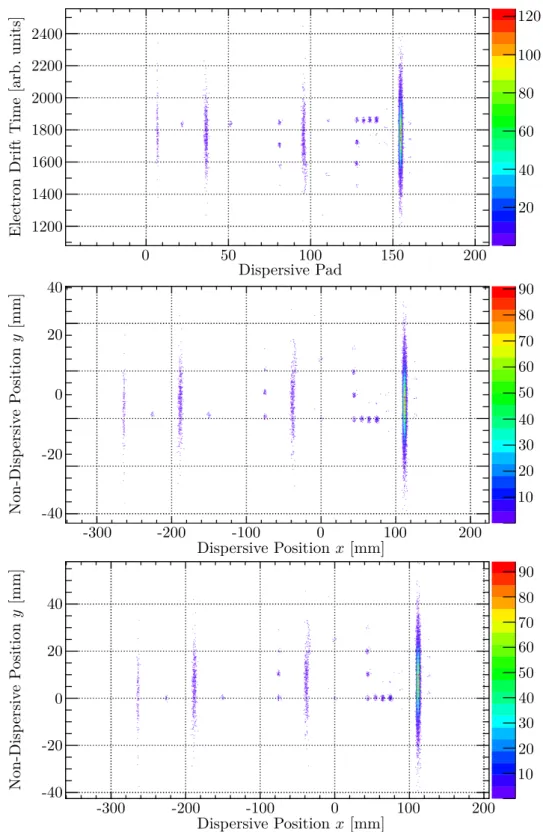
The rst component of the S800 focal-plane detector system is a pair of two Cathode Readout Drift Chambers (CRDC) [Fuc92] which are divided by a separation of 1 m. A CRDC is essentially a gas-lled detector with a sub-mm position resolution, nominatively given by 0.5 mm [Yur99]. The active area is ±28cm (dispersive direction) times±13cm (non-dispersive direction), while the active depth is 1.5 cm.
Information on the dispersive coordinate (x) is obtained by a multi-cathode method (pad width 2.54 mm), while information on the non-dispersive coordinate is obtained by measuring the electron drift time following recoil-induced ionizations. The CRDCs are lled with80% CF4 and 20 % isobutane at a gas pressure of 140 Torr [Yur99]. Due to the comparably slow electron drift velocities ve ∼50µm/ns, the safe operation of the CRDC detectors is limited to rates of few kHz.
Since both CRDCs measure (x, y) coordinates, the trajectory vector of particles entering the focal plane can be determined.
2.3. The Plunger Device TRIPLEX Path Reconstruction
Knowing the properties of the magnetic eld in the S800 spectrograph, the trajectory at the focal plane, the recoil mass m as well as its charge state Q, the ion optics code COSY Infinity [Mak06] is used to calculate the transfer matrixSto describe the particle transfer from the S800 pivot position (T) to its focal plane (FP).
This allows to reconstruct the recoil velocity vector at the pivot point, i.e. the position of the plunger degrader. Practically, the following relation is valid4:
−αT yT βT
∆ET/Ekinref
=S−1
−xFP
−αFP yFP βFP
(2.1)
In this formula, α(β)is the angle between reference path and (non-)dispersive axis given in radian. Similarly,x(y)are coordinates along the dispersive (non-dispersive) axis given in meters. ∆ET/Ekinref is the ratio of the kinetic energy dierence between experimental and reference energy ∆ET = Ekinexp −Ekinref to the kinetic energy of a reference particle which moves along the reference trajectory.
For such a reference particle, the product (βγ)ref of β velocity and Lorentz factor γ is given according to:
(βγ)ref= Bρ[Tm]
3.107 · Q
m[amu] (2.2)
Here,Bρis the rigidity of the S800 dipoles,Qis the charge state of the reference particle andm is its mass given in atomic mass units (amu) [Wan12]. From this relationship, the kinetic energy of the reference particle is given according to
Ekinref [MeV]=m[MeV/c2]·c2·(γref−1) (2.3) Segmented Ionization Chamber
Downstream of the CRDC detectors, a 16-fold segmented ionization chamber is placed to measure the energy loss of traversing particles. The ion chamber is lled with P10 (90 % Ar, 10 % CH4) at a typical pressure of 300 Torr [Yur99].
Focal-plane Scintillator
In the experiment at hand, the last relevant component of the focal-plane detector system is a 1-mm-thick plastic scintillator, which provides the time reference relevant for the CRDCs as well as auxiliary detector components, such as SeGA. In the experiment, this scintillator triggers the event recording.
2.3. The Plunger Device TRIPLEX
The experiment was performed with the three-foil plunger device TRIple PLunger for EXotic beams (TRIPLEX) [Iwa16], which was designed and manufactured at the Insti- tut für Kernphysik (IKP) in Cologne. A picture of the device is shown in Fig. 2.3. The
4The signs are a result of dierences between the experimental and the COSY coordinate systems.
2. Experimental Setup
discussed experiment was part of a short campaign in which TRIPLEX was used for the rst time (see Refs. [Nic14; Nic15] for results of the accompanying experiment).
Compared to the already existing NSCL/Köln plunger device [Dew06], TRIPLEX can be used with three foils. This enables rened experimental applications of the RDDS tech- nique, e.g. covering two distinct lifetime ranges within one foil setting (see Ref. [Iwa16]
for details). In TRIPLEX, the position of the second foil holder is mechanically xed.
Hence, this foil denes the reference point, e.g. with respect to the surrounding γ-ray detector array.
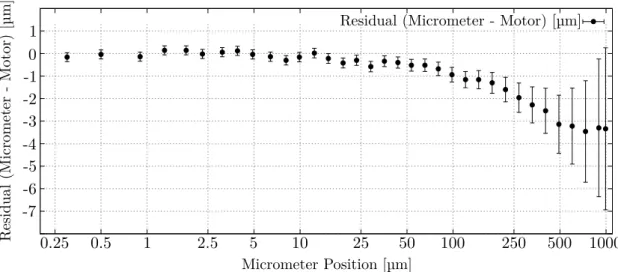
The rst and third foil holder can be moved along the beam axis with respect to the second foil holder. From a technical point of view this is achieved by a mechanical con- struction using three tubes of dierent diameters. Bearings with high precision and low tolerances allow a sliding movement of the outer and inner tube with respect to the cen- tral tube, where the latter is coupled to the second foil holder. Displacements up to 30 mm (corresponding to a ight time (particle frame) of roughly 230 ps forβ = 0.4) are feasible and limited by the maximum stroke of the built-in linear actuators (Nexact® N- 381 manufactured by Physik Instrumente (PI) GmbH & Co. KG) which contain optical encoders to measure displacements with a resolution of 10 nm.
B C D E
A
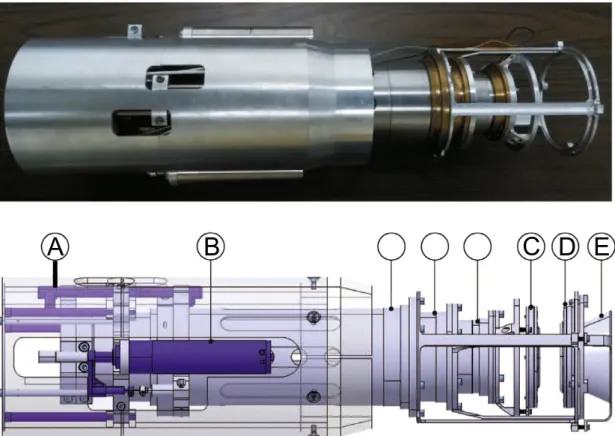
Figure 2.3.: (Top) Photograph of the TRIPLEX device without foil holders. (Bottom) Schematic sketch of TRIPLEX. A micrometer probe (A), a linear actuator (B) and foil holders (C,D,E) are identied [Iwa16]. Reprinted with permission from Elsevier.
2.4. The Segmented Germanium Array Setting 1 Setting 2 Setting 3
Plunger Target (9Be) 287 520 1289
Plunger Degrader (197Au) 252 252 252
Polyester Film (Mylar®) 50 50 50
Table 2.2.: Information on the plunger foil thicknesses (in µm) for each experimental setting. See Sec. 3.2.3 for details.
The linear actuators are coupled mechanically to the rst and third foil holder, respec- tively. The coupling is to some extend exible and, hence, a motor movement may not induce a real displacement of the corresponding foil, e.g. in case of high friction5. For this purpose two axial micrometer probes (GTL 21/22 manufactured by TESA Technology) with an active range of 5 mm are coupled to the rst and third foil holder.
A beryllium foil was used in the present experiment as a secondary target material and, hence, it was mounted onto the rst foil holder. Beryllium was chosen because of its low mass and its absorptive character [Tos01]. The rst is favourable for the kinematics, while the latter improves the cross section of knockout reactions. A gold foil was mounted onto the second foil holder and was used as a degrader. A thin polyester lm was placed onto the third holder, which signicantly reduced the contribution of incompletely ionized particles. In particular, the inuence of the 24+ charge state of Mn was drastically reduced, which lowered the number of secondary beam particles in the S800 focal plane signicantly.
Due to the almost linear relationship between production yield and target thickness, it is in principal desired to use thick targets. This, however, is limited by two constraints:
First, the recoil energy (downstream of the plunger device) has to be suciently large (E ≥ 40MeV/u) to allow an unambiguous event correlation. Second, it is desired to minimize the contribution of de-excitations taking place within a foil, because such decays aect the line shape.
A reduction of the recoil β velocity by ∼ 6% is sucient to separate fast and slow components in the Doppler-reconstructed γ-ray spectrum. The thickness of the gold degrader was therefore chosen to be close 250 µm.
The thicknesses of all utilized foils are listed in Table 2.2.
2.4. The Segmented Germanium Array
The Segmented Germanium Array (SeGA) in plunger conguration consists of 15 SeGA detectors [Mue01] and was used to detect prompt γ rays. Each SeGA detector houses a cylindrical HPGe crystal which has a length of 8 cm and a diameter of 7 cm. The outer contacts of the crystals are electrically segmented (see Fig. 2.4). The crystal is divided into eight disks (labelled from A to H) with thicknesses of 10 mm. Each disk is divided
5Due to the high precision of the bearing unit, a signicant contribution from friction is in principal not expected. However, the device showed temperature-dependent friction eects which was traced back to dierent elongation coecients of the used materials. This problem was solved in 2016.
2. Experimental Setup
Figure 2.4.: Left: Photograph of SeGA in plunger conguration focused on the upstream detectors at θ≈140◦ surrounding the beam pipe. The azimuthal angles are printed into the picture for ϕ = 0◦ and 90◦. Right: Segmentation of the SeGA crystals as taken from Ref. [Mue01]. Reprinted with permission from Elsevier.
into four equally sized quarters (labelled from 1 to 4). To maximize the benets from the segmentation, the crystal axis is placed perpendicular to the connection line between reference point (plunger degrader) and detector centre position, see Fig. 2.4.
In total, energy and time information are collected from each of the 32 segments as well as from the core. In the analysis, the Doppler reconstruction is applied to the full energy collected in the core using the angle of the segment with the largest energy deposition. Information on the intrinsic and expected total detector resolution can be found in Sec. 3.1.2.3.
The detectors were placed in two rings around the beam axis. The downstream (up- stream) detector ring is placed at an angle of θ ≈ 30◦ (θ ≈ 140◦) with respect to the beam axis. In total seven and eight detectors were placed in the detector ring atθ≈30◦ and θ ≈ 140◦, respectively. The azimuthal angles ϕ of the detectors were given by 0◦, 45◦, 90◦, 135◦, 180◦6, 225◦, 270◦ and 315◦. Precise information on the determination of the SeGA geometry can be found in Sec. 3.1.1. A photograph of SeGA as it was used in the experiment is depicted in Fig. 2.4.
6This detector is missing in the downstream ring due to the limited space at the entrance of the S800 spectrograph.
3. Data Preparation
It was mandatory to apply various calibrations and corrections to the raw experimental data before solid information could be extracted. These calibrations and corrections will be discussed in this chapter.
In Sec. 3.1 the various steps needed for the SeGA detectors are described. The following sections clarify the preparation of plunger (Sec. 3.2) and S800 data (Sec. 3.3).
3.1. The SeGA in Plunger Conguration
As can be readily seen from Eq. 1.1, a reasonable Doppler reconstruction requires to know the (eective) polar angle θ, i.e. the angle between the velocity vector of the particle when the γ-ray is emitted and the detection position of the γ-ray, with high precision.
In addition, the geometry of the germanium array has to be mapped accurately into the (GEANT4) simulation to enable a precise description of subtleties, such as full photo- peak eciencies and solid-angle eects. The determination of the SeGA geometry is explained in Sec. 3.1.1.
For each of the three plunger-foil congurations, measurements with a standard152Eu source (see Sec. 3.1.2) placed at various positions within the plunger housing were per- formed and fullled several purposes:
1. Matching the response signals of cores as well as segments to real energy values, see Sec. 3.1.2.1.
2. Evaluation of the full photo-peak eciency, depending on the source position and foil conguration, see Sec. 3.1.2.2.
3. Determination of the intrinsic detector resolutions, see Sec. 3.1.2.3.
4. Matching theγ-time signals of the SeGA detectors, see Sec. 3.1.2.4.
3.1.1. Geometry of the SeGA Detectors
To motivate the necessity of a precise knowledge on the array geometry, it is instructive to see the eect of a slightly misaligned detector array on the Doppler-reconstructedγ-ray spectrum. This can be visualized by simulation tool-kits, e.g. based on GEANT4.
For this purpose, consider hypothetical prompt γ-rays with an energy of 1 MeV which are emitted from recoils moving along the beam axis with β = 0.4. Geometric mis- matches are forced into the Doppler-reconstruction which lead to systematic shifts in the Doppler-reconstructed γ-ray spectrum. Here, the assumed detector geometry is realistic and mimics the experimental one. Results are shown for the downstream detector ring in Fig. 3.2.
3. Data Preparation
Figure 3.1.: Schematic drawing of components scanned in the laser measurement, show- ing the beam tube (red) and SeGA detectors (green). The dots in the down- stream detector ring (θ≈30◦) correspond to the position of screws placed on the backside of the crystal housing from which the axial segmentation can be referred. For the upstream detectors (θ≈140◦) a grid on the front caps can be seen, which coincides with the quarterly segmentation. The orientation of the associated coordinate system is illustrated in the upper left corner.
First, a forced mismatch of ∆r(x, y) = 10mm in the area perpendicular to the beam axis is introduced. As can be seen in Fig. 3.2, this increases the peak width (in terms of FWHM) in the Doppler-reconstructedγ-ray spectrum by almost 4 keV, which corresponds to a relative increase of the resolution by 60 %. The peak centroid, however, appears at the expected energy.
Second, a forced mismatch of∆z= 10mm (along the beam axis) is introduced. This af- fects the polar angles systematically and shifts the centroids of the Doppler-reconstructed peaks in both rings by ∼ 6 keV toward higher energies, while the energy resolutions re- main essentially unchanged.
To minimize systematic uncertainties in the analysis, characteristic positions and orienta- tions of the SeGA detectors as well as the beam pipe housing the TRIPLEX device were measured with a laser scan using a commercial system manufactured by FARO Technolo- gies Inc.. The result is illustrated in Fig. 3.1.
The corresponding orthogonal coordinate system in which the positions are given is cho- sen as follows: The origin coincides with the pivot point of the S800 spectrograph. The zaxis coincides with the beam axis, thex axis shows vertically upward and they axis is chosen such that the coordinate system follows a right-handed orientation, e.g. it points to the right with respect to the beam direction. With respect to the magnetic rigidities of S800, thex axis is then the dispersive axis, while they axis is the non-dispersive axis of the spectrograph.
In this reference frame the mean focus position of the SeGA detectors was found to be at (x, y, z) = (0,0,−54mm), with variations smaller than 2 mm. With respect to this
3.1. The SeGA in Plunger Conguration
Figure 3.2.: Inuence of systematic errors in the detector geometries on the Doppler- reconstructedγ-ray spectrum in the downstream detector ring as investigated with a GEANT4 simulation. Left: Doppler-reconstructedγ-ray spectrum for a perfectly aligned Detector geometry. Centre: Doppler-reconstructed γ-ray spectrum assuming a systematic upstream shift of 10 mm. Right: Doppler- reconstructed γ-ray spectrum assuming a systematic shift of 10 mm in the area perpendicular to the beam axis. Changes in the centroid energy (∆E) and the peak resolution (∆σ) are written into the spectra.
focus point, the mean radial distance to the detectors were given by 29.9 and 23.7 cm for the downstream and upstream detector ring, respectively. The mean polar angles were quantied to 30.6◦ and 140.6◦.
It was intended to align the plunger degrader at (x, y, z) = (0,0,−52mm)1. Regard- ing the analysis, the precise z coordinate of the plunger degrader was determined by an iterative process until self-consistency was achieved between experimental and simulated Doppler-reconstructed γ-ray spectrum with respect to the 2+1 → 0+gs γ-ray transition energy of the corresponding chromium isotope. For the latter, the transition energy was taken from literature. Best results were achieved for z coordinates of -44 mm (rst and second setup) and -48 mm (third setup). The displacement within the (x, y) area was determined by minimizing the peak width of the same transition in the Doppler- reconstructed γ-ray spectrum.
3.1.2. Data Taken with a Standard 152Eu Source
Several data runs with a standard 152Eu source (activity A0 = 26.0kBq) were recorded before and after the experiment while the plunger device was located at its nominative experimental position. For each of the three plunger foil congurations (characterized by varying Be target thicknesses) three γ-ray spectra with distinct source positions and foil separations were recorded (see Fig. 3.3). Each of these runs was recorded for around 30 minutes.
These data sets allow a.) to match the response signals to real energies, b.) to investigate position-dependent eects (e.g. due to changing solid angles), c.) to investigate gain stabilities and d.) to determine absolute full photo-peak eciencies as well as detector resolutions.
1For this purpose a mechanical stick with a well-dened length was used to push the plunger device into position.
3. Data Preparation
Figure 3.3.: Positions of the152Eu source for which SeGA data was recorded. Left: Source (depicted in red) placed downstream of the degrader while target and de- grader are in contact. Middle: Source placed on the target surface with a foil separation of ∼ 5mm. Right: Source placed on the target surface with a foil separation of ∼12mm. The separation between second and third foil was around 20 mm in all cases.
3.1.2.1. Energy-Channel-Matching of Core and Segmental Signals
Information on γ-ray energies for transitions following the decay of 152Eu were taken from Ref. [NDS152]. For the matching of the core signals, only transitions in the en- ergy range 121 to 1528 keV characterized by suciently strong intensities (usually larger than 1 %) and non-overlapping transitions of comparable intensities were taken into ac- count. A list of the considered transitions can be found in Appendix A. To extend the energy-matched region toward higher energies2, additional background transitions (see Sec. 3.1.3) at 1460.8 (40K), 1764.5 (214Bi) and 2614.5 keV (208Tl) were also taken into account.
The corresponding core response was tted for each SeGA detector to the γ-ray en- ergy using linear, quadratic and cubic functions. Non-linearities in the SeGA response in the low and high (>1.5 MeV) energy range were reported prior to this work (see, e.g.
[Cra10b]), where the latter were traced back to non-linearities in the response of the Ortec AD413 ADCs [Lid04].
In the present experiment, non-linearities were observed for all detectors. While for some detectors these could be corrected by assuming a quadratic dependence, for others a cubic term was mandatory. Only the detector placed at(θ, φ)≈(30◦,90◦) was prone to severe non-linearities. Typical reduced χ2 values for the linear, quadratic and cubic ts were around 200, 60 and 10, respectively.
As a consequence, a cubic polynomial expression was used for the energy-channel match- ing. As examples of the quality, the residuals of the gain matching are shown in Fig. 3.4 for a typical as well as for the most problematic detector placed at(θ, φ)≈(30◦,90◦). Us- ing the cubic t, deviations between tted and literature values for γ-ray energies below 2 MeV were in general smaller than 0.2 keV, with two exceptions:
2This is in particular important for the downstream detector ring as a consequence of the Doppler-shift toward higher energies.
3.1. The SeGA in Plunger Conguration
Figure 3.4.: Quality of the energy-channel matching using a cubic function. Left: Rep- resentative residuals of the detector placed at (θ, φ) ≈ (30◦,−45◦). Right:
Residuals of the problematic detector placed at (θ, φ) ≈ (30◦,90◦) which shows severe non-linearities.
The detector at(θ, φ)≈(30◦,90◦) suered from severe non-linearities which could be observed in all 152Eu runs and aected the full energy range.
The detector at (θ, φ) ≈ (140◦,135◦) suered from gain instabilities, leading to a double-peak structure at low energies and a severe low-energy tail at higher energies.
Possible gain shifts were investigated by comparing energy matching parameters cor- responding to 152Eu data recorded before and after the experiment. The systematic uncertainty is estimated to be 1 keV for Doppler-reconstructed energies below 1500 keV and 2 keV for higher energies, which is reasonable to account also for gain shifts, which in most cases were well below 0.5 keV.
In a following step, the segment responses were gain-matched using the calibrated core energies. For this purpose, the data was restricted to γ-ray events with multiplicity M = 1. The correlation of segment response versus calibrated core energy is tted with a quadratic function in the energy range 50 to 1500 keV, see Fig. 3.5.
3.1.2.2. Full Photo-Peak Eciencies
The full photo-peak eciencies P(Eγ,i) at specic γ-ray energies Eγ,i were determined for each of the152Eu runs according to
P(Eγ,i) = Iγ,iexp
∆t·pabsγ,i ·A·LT (3.1)
with the experimental intensity Iγ,iexp, the measuring time∆t, the probability to observe the transition per decaypabsγ,i taken from [IAEA07; NDS152] (see Appendix A), the activity A of the 152Eu source and the lifetime LT as evaluated from DAQ scalers. Various
3. Data Preparation
Figure 3.5.: Matching of the segment response to the core signal for events with multi- plicity M = 1. The left gure shows the unmatched case while the right gure shows the matched response following the procedure described in the text.
analytical functions, e.g. the expression introduced by Gray [Gra85], were tested for their abilities to describe the experimental data points. The smallest χ2 was achieved using the formula introduced in Ref. [Deb84], which describes the eciency according to:
(Eγ) =alogEγ+blog Eγ
Eγ +clog2 Eγ
Eγ +dlog4 Eγ
Eγ +elog5 Eγ
Eγ (3.2)
Whenever it is referred to quantitative experimental full photo-peak eciencies in the following, this function is used.
Figure 3.6.: Comparison of full-photo peak ecienciesP for three dierent source posi- tions labelled (a), (b) and (c) (see Fig. 3.3 for clarication) as determined for the foil conguration of the rst experimental setup. For each data set the best t using Eq. 3.2 is shown.
As an example, the results of the foil conguration of the rst experimental setup are shown for both detector rings in Fig. 3.6. The qualitative behaviour of the shown data can
3.1. The SeGA in Plunger Conguration
Detector a b FWHM
(30◦, 0◦) 5.79 4.59 3.57 (30◦, 45◦) 7.29 4.13 3.68 (30◦, 90◦) 4.79 3.15 3.09 (30◦, 135◦) 4.16 3.98 3.19 (30◦, 180◦) - - - (30◦, -135◦) 5.08 4.09 3.37 (30◦, -90◦) 4.79 5.23 3.42 (30◦, -45◦) 9.79 3.18 4.29
Ring 5.79 4.41 3.50
Detector a b FWHM
(140◦, 0◦) 5.20 3.17 3.14 (140◦, 45◦) 6.49 3.41 3.39 (140◦, 90◦) 4.88 3.95 3.28 (140◦, 135◦) 5.82 3.36 3.28 (140◦, 180◦) 4.24 5.32 3.56 (140◦, -135◦) 5.28 3.96 3.35 (140◦, -90◦) 5.94 4.03 3.45 (140◦, -45◦) 5.95 3.10 3.24
Ring 5.57 3.59 3.13
Table 3.1.: Resolution parameters (see Eq. 3.3) of single SeGA detectors in the down- stream (left) and upstream (right) detector ring as deduced from summed data of all 152Eu runs recorded prior to the experiment and the FWHM (in keV) at 1408 keV as a signature for the detector resolution. The bottom line lists the same result for the full detector ring using the integrated statistics.
be understood due to the inuence of solid-angle as well as shadowing eects. In addition, the plots highlight that the eciency at low energies is strongly position dependent. The eciency curve of the downstream detectors shows a distinct knee around 220 keV when the source is placed between target and degrader, which vanishes if the source is placed downstream of the degrader.
In the upstream detector ring this knee can be seen for all source positions, but its energy is correlated to the source position. The eciency of the upstream detector ring reduces, as expected, if the source is placed downstream of the degrader.
3.1.2.3. Intrinsic Detector Resolutions and Doppler Broadening
After the gain matching, the statistics of all152Eu runs recorded prior to the experiment were added to quantify the intrinsic resolution of each of the 15 SeGA detectors. The FWHM were determined by tting Gaussian functions to transitions in the energy range 121 keV to 1550 keV using the function
FWHM(Eγ)[keV]= q
a+b·Eγ[keV] (3.3)
This procedure was repeated for the summed spectrum for both detector rings. The results are listed in Table 3.1. Depending on the detector, the FWHM (at 1408 keV) varied between 3.1 keV and 3.9 keV in the present experiment.
As a result of the relativistic recoil velocities, the observedγ-ray resolution in the labo- ratory frame are also aected by a signicant Doppler broadening (DB), which is a direct consequence of the aperture of the SeGA segments. This is an intrinsic eect and, hence, was not correctable with the present setup.
The relative contribution of Doppler broadening to the energy resolution (∆EDB) ob-
3. Data Preparation
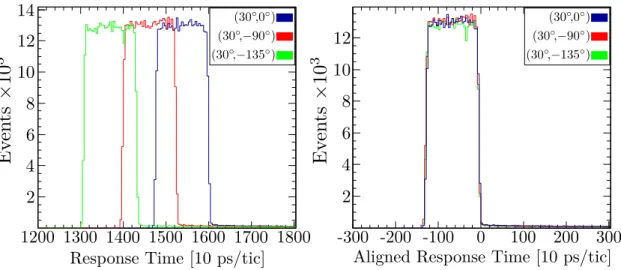
Figure 3.7.: Matching of the γ-time information, illustrated for three detectors. Left:
Raw γ-time information. Right: Correctedγ-time information.
served in a Doppler-reconstructed γ-ray spectra can be quantied via:
∆EDB
Eγ0 = βsinθ
1−βcosθ∆θS (3.4)
Here, ∆θS is the opening angle of the detector segment. In the discussed experiment, the mean full opening angles of segments were ∼ 1.8◦ (downstream ring) and ∼ 2.5◦ (upstream ring), respectively. Consider, for instance, the de-excitation of the 2+1 state in
58Cr (Eγ= 881keV) while moving with aβ velocity ofβ= 0.4. The Doppler broadening increases the total resolution (FWHM) by 8.6 keV in the downstream ring and 5.9 keV in the upstream ring.
3.1.2.4. SeGA Response Timing
Using152Eu data, the time information from the core signals of the SeGA detectors were matched to each other. For this purpose, the right shoulder of the γ-time response is shifted to zero using a constant term (see Fig. 3.7 for illustration).
3.1.3. Background Measurement
The natural background radiation was measured before (≈2.75hours) and shortly after (≈0.2hours) the experiment. The resulting totalγ-ray spectra are shown in Fig. 3.8. A comparison of both background spectra reveal that no severe activation took place. The 1460-keV line of 40K is the strongest contribution to the background spectrum. During the analysis special care was given to avoid random coincidences correlated to background and non Doppler-shiftedγ rays in general from contaminating relevant peaks.
3.1. The SeGA in Plunger Conguration
Figure 3.8.: The spectra show the (natural) background radiation as recorded with SeGA before (top) and after (bottom) the experiment. Each transition is identied and labelled with the corresponding transition energyEγ, the mother nucleus and if applicable the corresponding decay chain.
3.1.4. Doppler Reconstruction
The separability of the plunger peaks - labelled fast (slow) component for decays upstream (downstream) the degrader - depends crucially on the Doppler reconstruction, for which both angle and recoil velocity information are taken into account. This is illustrated in Fig. 3.9, which shows Doppler-shifted and Doppler-reconstructedγ-ray spectra correlated
3. Data Preparation
Figure 3.9.: Eect of the Doppler reconstruction on the peak separability. Shown are Doppler-shifted (left) and Doppler-reconstructed (right) γ-ray spectra of the downstream detector ring correlated to 58Cr for a 4-mm foil separation. In the latter, fast (f) and slow (s) components are identied.
to 58Cr recorded for the foil distance of 4 mm. The Doppler reconstruction is performed event-by-event using the β velocity determined with S800 and a trajectory-corrected detector3 angleθ. The energy of the slow component in the Doppler-reconstructedγ-ray spectrum is essentially given by the literature value of the corresponding transition.
3The mean scattering angle in the analysis of58,60,62Cr were measured with S800 to 1.6(10)◦, 1.3(10)◦ and 1.2(14)◦. The values in brackets refer to the corresponding root mean square error. In general, the scattering angles were distributed between 0 and 5◦.