Improvement and validation of dynamical malaria models in Africa
Inaugural - Dissertation zur
Erlangung des Doktorgrades
der Mathematisch-Naturwissenschaftlichen Fakultät der Universität zu Köln
vorgelegt von
Edmund Ilimoan Yamba aus Saboba, Ghana
Köln 2016
Berichterstatter (Gutachter): Prof. Dr. Bülent Tezkan (Vorsitzender) Prof. Dr. Susanne Crewell
Prof. Dr. Andreas H. Fink
Prof. Dr. Adrian P. Tompkins
Dr. Volker Ermert (Beisitzer)
Tag der mündlichen Prüfung: 25. October 2016
Abstract
Overcoming the serious public health burden of malaria in Africa especially the sub- Saharan Africa requires a detailed understanding of malaria epidemiology in the re- gion. To contribute to this effect, this work embarked on several research steps.
The first part of this study investigated the impact of climatic and environmental factors on seasonal malaria transmission in the Africa. Monthly Entomological Inoculation Rate (EIR
m) data initially gathered from different malaria locations across the region via a literature review was utilized for this purpose. The results revealed that rain- fall was the primary climatic determinant of malaria seasonality at markedly seasonal rainfall areas such as Sahel and Eritrea. But its impact at bimodal rainfall distributed and more humid zones was more complex. Temperature was not a limiting factor of malaria seasonality in Africa except for East Africa where it can delay the impact of rainfall. The seasonal peaking characteristics malaria were mostly unimodal. At zones characterised by bimodal rainfall distributions, the peaks were frequently associated with the first rainfall maximum of the year. Seasonal malaria intensity anti-correlated with elevation and population density. Though seasonal malaria transmission is driven mainly by An. gambiae, An funestus and An. arabiensis, the vectors had competing and complex individual impact on seasonality. The findings of this section have im- portant implications for the disease control especially the spatial and temporal target of malaria interventions and resource allocation. Besides, it provides information re- garding future malaria modelling efforts and the validation and evaluation of existing weather-driven malaria models.
The second part of the study validated seasonal malaria transmission in Africa sim-
ulated by two malaria models using the observed EIR
mdata. The models include
the 2010 version of the Liverpool Malaria Model (LMM
2010) and the VECtor-borne
disease community model of the international centre for theoretical physics,TRIeste
(VECTRI). The goal was to determine the accuracy of both models in simulating sea-
sonal malaria transmission in Africa. The validation revealed that LMM
2010and VEC-
TRI error ranges were generally within or about the same as the standard deviation
of the observed EIR
mdata though larger errors were detected for Guinea and some
individual monthly minor differences. Both models also agreed with observations that
the seasonal peaking behaviour of malaria was predominantly unimodal. However,
transmission peaks in the models tend to be delayed by one month in the Sahel and
Eritrea area. Both models further agreed with observed values of a seasonality index
that the seasonal malaria transmission contrast is closely linked with the latitudinal
variation of climatic covariates such as rainfall in Africa. VECTRI revealed a stronger
ability in capturing the levels of malaria endemicity in East Africa than LMM
2010. The
hydrology model in VECTRI poorly captures seasonal malaria transmission at perma-
nent water body locations. Though both models had loopholes, inferences from the
validation conclude that they could realistically reproduce the seasonal evolution of
the disease in Africa as a function of climate and environment. The findings, therefore,
provides the basis for further review and refinement of the models by their developers to stage them as best fundamental tools for seasonal malaria prediction.
In the third part of this work, a formulated simple model of immunity to malaria and incorporated into VECTRI was evaluated. Also, the section performed a one-at-a- time sensitivity study of VECTRI parameter settings to its output variability. The re- sults revealed that the immunity model enabled VECTRI to simulate different levels of malaria for Africa by reducing transmission rates at increased exposure of humans to malaria. The simple immunity model also substantially improved the seasonal malaria simulations of VECTRI by reducing its output error. The one-at-a-time sensitivity analysis performed on VECTRI parameter settings revealed parameters showing the strongest variation of the model output. The most sensitive parameter settings con- sisted of survival probabilities (i.e. adult vector and larval survival), threshold temper- atures (i.e. minimum temperature for larval survival and that for the sporogonic cycle), degree days (i.e. larvae growth), and hydrological components (i.e. total evaporation and infiltration losses). The new immunity model represents a helpful tool for future malaria modelling effort, and its refinement for consideration in VECTRI is necessary.
Parameters contributing most to VECTRI output variability require additional research
to strengthen knowledge base to reduce VECTRI output uncertainty.
Zusammenfassung
Nur ein besseres Verständnis der Malariaepidemiologie südlich der Sahara wird es er- möglichen die ernsthafte Belastung der öffentlichen Gesundheit durch diese Krankheit zu überwinden. Die vorliegende Doktorarbeit soll dazu einen Beitrag leisten, indem sie die Malariasaison genauer untersucht. Analysiert wird sowohl die Bedeutung von klimatischen und umgebungsbedingten Antrieben als auch der Einfluss durch unter- schiedliche Mückenarten. Außerdem validiert und analysiert sie wetterangetriebene, dynamisch-mathematische Malariamodelle, welche realistische Simulationen von epi- demiologischen Malariacharakteristika erstellen.
Diese erste Studie dieser Arbeit untersucht den Einfluss von klimatischen und umge- bungsbedingten Faktoren auf die saisonale Verteilung der Malariaübertragung. Hier- für wurde zunächst die Literatur in Bezug auf monatliche Werte der entomologische Inokulationsrate (EIR
m) ausgewertet. Die EIR
m-Werte wurden für unterschiedliche Malariastandorte innerhalb von Subsahara-Afrika zusammengetragen. Für Gebiete mit stark saisonalen Regenfällen hat der Niederschlag den größten klimatischen Einfluss auf die Malariasaison. Für Gebiete, die eine bimodale Regenverteilung aufweisen und feuchter sind, ist der Einfluss komplex. Die Temperatur stellt in Subsahara-Afrika bis auf Ausnahme von Ostafrika keinen limitieren Faktor für die Malariaverbreitung dar. Die Analyse der Spitzen der saisonalen Malariaübertragung zeigt, dass meist unimodale Verteilungen auftreten. Bei bimodaler Niederschlagsverteilung steht die Spitze in der Malariaübertraugung oft in Verbindung mit dem ersten Regenmaximum des Jahres. Die Intensität der Malariasaison ist antikorrelliert mit der Höhenlage und Bevölkerungsdichte. Obgleich die Malariasaison meist durch An. gambiae, An funes- tus und An. arabiensis bestimmt wird, besitzen diese Vektoren einen konkurrierenden, komplexen und individuellen Einfluss auf die Saisonalität. Trotzdem die verwende- ten Daten einige Unsicherheiten aufweisen hat der erste Teil der vorliegende Arbeit wichtige Implikationen für die zeitliche und räumliche Durchführung von Malari- abekämpfungsmaßnahmen und das zur Verfügung stellen von Ressourcen. Die er- ste Studie hält ebenfalls Informationen in Bezug auf die Validierung und Bewertung von wetterangetriebenen Malariamodellen und für zukünftige Malariamodellierungen bereit.
Die zweite Studie validiert die Ausgabe des LMM
2010(Engl.: “2010 version of the Liv- erpool Malaria Model) und von VECTRI (Engl. “VECtor-borne disease community model of the international centre for theoretical physics,TRIeste”). Die Validierung zeigt, dass die Modelle auf der Basis von Klima- und Umgebungsvariablen in der Lage sind eine realistische Malariasaison zu simulieren. Die Fehler von LMM
2010und VEC- TRI bewegen sich meist innerhalb der Standardabweichung der Beobachtungsdaten.
Allerdings wurden für Guinea größere Fehler ausfindig gemacht and es traten ebenfalls
kleinere Abweichungen für individuelle Monate auf. Die Charakteristika der Malari-
aübertragungsspitzen stimmen bei beiden Modellen mit den Beobachtungen überein,
bei denen hauptsächlich unimodale Verteilungen auftraten. Die simulierten Spitzen in
der Malariaübertragung treten für den Sahel und Eritrea meist einen Monat später auf als beobachtet. Die Modelle simulieren in etwa den gleichen Malariasaisonalitätsindex wie beobachtet. Letzterer hängt stark von der geographischen Breite und klimatischen Kovariaten wie dem Niederschlag ab. VECTRI trifft die Malariaverhältnisse für Gebi- ete mit permanentem Wasserangebot nicht sehr gut. Insgesamt zeigen aber die Ergeb- nisse der zweiten Studie, dass beide Modelle in der Lage sind für Subsahara-Afrika realistische saisonale Malariaübertragungsraten zu simulieren. Diese Studie liefert eine Grundlage für weitere Revisionen und Verbesserungen dieser wetterangetriebe- nen Modelle, wodurch Werkzeuge entstehen könnten, die eine Malariavorhersage er- möglichen.
Ein neues einfaches Immunitätsmodul von VECTRI wurde abschließend in der drit- ten Studie der Doktorarbeit untersucht. Dieses Modul ermöglicht VECTRI unter- schiedliche Malarianiveaus für Subsahara-Afrika zu simulieren indem die Malariaüber- tragung reduziert wird, falls Menschen stark der Malaria ausgesetzt sind. Dieses ein- fache Immunitätsmodul war in der Lage den Modellfehler von VECTRI in Bezug auf saisonale Malariaübertragungsraten zu verkleinern. Eine Sensitivitätsanalyse wurde für die Modellparameter von VECTRI durchgeführt, wobei für jeden Modelllauf im- mer nur ein Parameter geändert wurde. Die am stärksten sensitiven Parameter stellen Überlebenswahrscheinlichkeiten (Mücken und Larven), Schwellwerttemperaturen (Min- imaltemperatur für das Larvenüberleben und für den sporogonischen Zyklus), Grad- tage (Larvenentwicklung) und hydrologische Komponenten (Verdunstungs- und Infil- trationsparameter) dar. Die letzte Studie zeigt, dass dieses einfache Immunitätsmodul ein hilfreiches Werkzeug darstellt und dass dieses weiter verbessert werden sollte.
Darüber hinaus informiert dieser Teil der Arbeit über weitere Modellparameter, die
eingehender erforscht werden müssen.
Contents
Acronyms 1
1 Introduction 2
1.1 The research background . . . . 2
1.2 Statement of the Problem . . . . 3
1.3 Research questions . . . . 4
1.4 Objectives . . . . 4
1.5 Organization of the thesis . . . . 5
2 Literature review 6 2.1 Malaria and the Plasmodium parasite . . . . 6
2.1.1 The genus Plasmodium life cyle . . . . 6
2.1.2 Epidemiology and burden of malaria . . . . 7
2.2 Malaria transmission drivers . . . . 9
2.2.1 Vector species . . . . 9
2.2.2 Meteorological factors . . . . 10
2.2.3 Environmental factors . . . . 10
2.2.4 Human factors . . . . 12
2.3 Entomological metrics for malaria transmission . . . . 13
2.3.1 Human Biting Rate . . . . 13
2.3.2 CircumSporozoite Protein Rate . . . . 14
2.3.3 Entomological Inoculation Rate . . . . 14
2.4 Weather-driven dynamical mathematical malaria models . . . . 15
3 Impact of climate and environment on seasonal malaria transmission 17 3.1 Background . . . . 17
3.2 Materials and methods . . . . 19
3.2.1 Materials . . . . 19
3.2.2 Methods . . . . 21
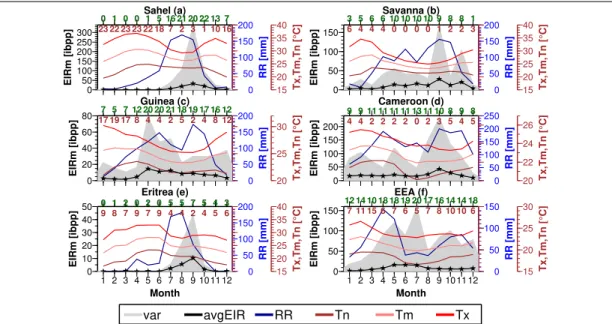
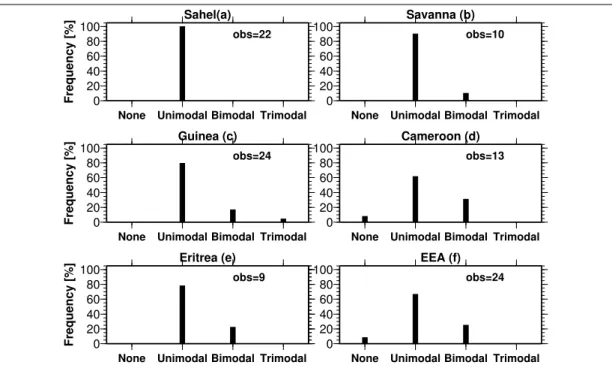
3.3 Results . . . . 22
3.4 Discussion . . . . 25
3.5 Summary and conclusions . . . . 31
4 Validation of LMM
2010and VECTRI 33 4.1 Background . . . . 33
4.2 Data and methods . . . . 34
4.2.1 Data . . . . 34
4.2.2 Methods . . . . 35
4.3 Results . . . . 37
4.4 Discussion . . . . 43
4.5 Summary and conclusions . . . . 48
5 Modelling immunity to malaria and VECTRI parameter sensitivity 50 5.1 Background . . . . 50
5.2 Methods . . . . 51
5.2.1 Brief description of VECTRI . . . . 51
5.2.2 Modelling immunity to malaria . . . . 52
5.2.3 Evaluation of the immunity model . . . . 55
5.3 Sensitivity of VECTRI parameter settings . . . . 55
5.4 Results and discussion . . . . 56
5.4.1 The simple immunity model . . . . 56
5.4.2 Sensitivity test . . . . 60
5.5 Summary and conclusions . . . . 62
6 Conclusions and recommendations 63 6.1 Summary and discussions . . . . 63
6.2 Study weakness . . . . 65
6.3 Conclusions and study significance . . . . 65
6.4 Recommendations and future outlook . . . . 66
A Appendix 68 A.1 Categorization of data locations . . . . 68
A.2 Observed EIR
mdata uncertainties . . . . 69
Bibliography 73
List of Tables
3.1 Number of locations and data amount at each climate zone . . . . 19
4.1 EIR Seasonality Index . . . . 36
5.1 VECTRI default parameters and their dimensions . . . . 56
A.1 Malaria locations and their characteristics . . . . 71
A.2 Table A.1 continuou . . . . 72
List of Figures
2.1 The life cycle of the genus Plasmodium parasite . . . . 6
2.2 Projected changes in malaria incidence rates by country, 2000–2015 . 8 2.3 The distribution of three most dominant malaria vectors in Africa . . . 9
3.1 Geographical distribution of data locations in sub-Saharan Africa . . . 20
3.2 Annual distribution of the number of EIR
mobservations . . . . 21
3.3 Seasonality of observed EIR
mcompared with rainfall and temperature over sub-Saharan Africa . . . . 23
3.4 Peak characteristics of EIR
mover sub-Saharan Africa . . . . 24
3.5 Cross correlation between EIR
mand rainfall . . . . 25
3.6 Comparism of EIR
mseasonality at different elevations . . . . 26
3.7 Seasonality of EIR
mat different population density settings . . . . 26
3.8 Comparison of EIR
mseasonality at different settings of hydrology . . 27
3.9 Geographical distribution and sympatric association of malaria vectors 28 3.10 Seasonal patterns of EIR
mfrom three dominant malaria vectors . . . . 28
4.1 Monthly MAE of LMM
2010and VECTRI . . . . 38
4.2 Monthly MBE of LMM
2010and VECTRI . . . . 39
4.3 Seasonal peaking behaviour of EIR
mmover sub-Saharan Africa . . . . 40
4.4 EIR peak months at unimodal distributed areas . . . . 41
4.5 Peak months at bimodal EIR distributed areas . . . . 41
4.6 Distribution of EIR Seasonality Index with latitude . . . . 42
4.7 Malaria endemicity in East Africa . . . . 43
4.8 Cross correlation between VECTRI simulated EIR
mand rainfall com-
pared to observed . . . . 44
4.9 Cross correlation between LMM
msimulated EIR
mand rainfall com- pared to observed . . . . 45
4.10 VECTRI simulated EIR
mfor different settings hydrology . . . . 46
5.1 The structural layout of VECTRI model . . . . 52
5.2 Schematic diagram of the simple immunity model . . . . 53
5.3 Simulated annual malaria cases and EIR
afor sub-Saharan Africa . . . 57
5.4 Sensitivity of immunity parameter settings to seasonal malaria outcome 59 5.5 Mean Absolute Error of model simulated EIR
mto the observed . . . . 60
5.6 Sensitivity of VECTRI simulated EIR
ato its parameters settings . . . 61
Acronyms
EIR Entomological Inoculation Rate . . . . 3
EIR
mmonthly Entomological Inoculation Rate. . . . 3
LMM
20102010 version of the Liverpool Malaria Model . . . . 3
VECTRI VECtor-borne disease community model of the international centre for theoretical physics, TRIeste . . . . 3
Pl. Plasmodium . . . . 6
An. Anopheles. . . . 6
AG An. gambiae. . . . 25
AF An. funestus. . . . 25
AA An. arabiensis. . . . 25
AN An. nili . . . . 25
AM An. moucheti . . . . 25
HBR Human Biting Rate . . . . 13
WHO World Health Organization . . . . 13
HLC Human Landing Catches . . . . 14
PSC Pyrethrum Spray Catches . . . . 14
LTC Light Traps Catches. . . . 14
CSPR CircumSporozoite Protein Rate. . . . 14
ELISA Enzyme-Linked Immunosorbent Assay. . . . 14
PCR Polymerase Chain Reaction. . . . 14
ibpp infectious mosquito bites per person . . . . 19
Pd Population density. . . . 21
GPDWv3 Gridded Population Density data of the World, version 3 . . 21
PWB Permanent Water Body . . . . 22
ARCv2 African Rainfall Climatology version 2. . . . 19
ERAI European Centre for Medium-Range Weather Forecasts (ECMWF) Interim Reanalysis . . . . 20
SY Start Year . . . . 19
SM Start Month . . . . 19
EY End Year. . . . 19
EM End Month . . . . 19
CHAPTER 1 Introduction
1.1 The research background
Malaria over the course of history has taken a huge toll on both human life and de- velopment in endemic countries (Hay et al. 2010). Some countries in the temperate climate managed to eliminate it (Killeen et al. 2002). Others are engaged in elimina- tion strategies (Feachem et al. 2010). Africa especially the sub-Sahara however, is still occupied with control efforts (Feachem et al. 2010). The disease remains one of the pressing public health problems in the region (Guerra et al. 2008) despite a reduction in its burden over the last decade (WHO 2015). The difficulty in eliminating malaria in the region is due to a complex interplay of many factors (Caminade et al. 2014).
The main one being the suitability of climate and environment of the area for malaria transmission (Caminade et al. 2014) that enables the dominance of efficient vectors of the disease (Murray et al. 2012, Sinka et al. 2010). The resistance of malaria parasites to antimalarials (Gregson and Plowe 2005) and malaria vectors to insecticides (Choi et al. 2004, Coetzee and Fontenille 2004) are additional challenges. Other factors in- clude the low socioeconomic status of the region (Tshikuka et al. 1996) and perhaps lack of political will.
Climate and environmental covariates reportedly impact on the development dynamics of both the vectors and parasite (Craig et al. 1999, Gething et al. 2011, Kirby and Lindsay 2009). Their influence trickles further on the behaviour of the vectors, their density and the number of infective mosquito bites a person receives per unit time (Fontenille et al. 1997, Molineaux and Gramiccia 1990). As a result, a temporal and spatial variability of the disease transmission occurs in Africa particularly the sub- Saharan Africa (Mbogo et al. 1995, Robert et al. 2003, Shililu et al. 2003). Another influence of malaria transmission dynamics in the sub-region is linked to the level of immunity acquired by the dwelling population (Molineaux et al. 1988). Due to acquired immunity to malaria, the disease infection moves differentially within the different age groups and gender of the sub-Saharan African population (Doolan et al.
2009, Mandal et al. 2011).
To eliminate malaria in Africa may require a complete trace of the disease progression
path. This includes an understanding of the influence of climate and environmental fac-
tors including vector type and immune status of the population at stake on the disease
seasonality. These, coupled with strengthening health systems, developing infrastruc-
ture and poverty reduction, will accelerate the elimination process. Since the systemic
interaction of malaria is dynamic, the use of dynamical mathematical malaria mod-
els is necessary. These models can provide an explicit framework to understand and
analyze the complex transmission pathways of the disease (Dobson and Carper 1992,
Bibliography
Mandal et al. 2011, Patz et al. 2003).
1.2 Statement of the Problem
Studies about the impact of climate and environment including vector type on malaria seasonality in Africa exist. But a comprehensive assessment of the disease in this regard using observed monthly Entomological Inoculation Rate (EIR
m) data across a wide range of different epidemiological settings in the region is scarce. Some previous attempts (Craig et al. 1999, Ermert et al. 2011b, Grover-Kopec et al. 2006, Tanser et al.
2003) relied on model simulated or other surrogates data. Other works that used Ento- mological Inoculation Rate (EIR) data (Mabaso et al. 2007, Roca-Feltrer et al. 2009) either lumped data from different climate settings or provided no adequate information about the individual influence of climatic and environmental variables. Many other studies (Briet et al. 2008, Giha et al. 2005, Kleinschmidt et al. 2001, Mabaso et al.
2005, Teklehaimanot et al. 2004, Thomson et al. 1999, Yé et al. 2007) relied on preva- lence or clinical malaria cases gathered from hospitals or clinics. But prevalence or case data are problematic because they are a cluster of different transmission windows (Reiner Jr et al. 2015). Besides, there are enormous variations in health seeking be- haviour of humans and health policies (Afrane et al. 2012). Hence, evidence of the impact of climate and environment on seasonal malaria transmission in Africa espe- cially the sub-Saharan is unconsolidated and require further probe.
Moreover, VECtor-borne disease community model of the international centre for the- oretical physics, TRIeste (VECTRI) (Tompkins and Ermert 2013) and 2010 version of the Liverpool Malaria Model (LMM
2010) (Ermert et al. 2011a), are weather-driven dynamical mathematical malaria models. They are scientifically sound and found to simulate realistic malaria transmission rates for epidemic and endemic areas in Africa (Ermert et al. 2011a, Tompkins and Ermert 2013). They have contributed to the under- standing of malaria transmission dynamics in the region (Caminade et al. 2014, Ermert et al. 2012; 2013, Tompkins and Di Giuseppe 2015). But despite their acceptability and application in the area, their simulation of seasonal malaria patterns for the region has not been extensively validated and evaluated with observed data from many different locations across the region. It means then that their seasonal malaria simulations may not be representative of the local conditions of the area. This applies in particular since most locations of the region are meteorologically different from those that were used during model calibration and validation. For these reasons, their prediction ca- pabilities, accuracy and generality of their simulated malaria seasonality compared to measured values are largely not maximized and indefensible.
The last but not the least, VECTRI is a regionally scaled, high resolution (on the order
of 1-5 km) model that innovatively incorporates vector-host interaction and accounts
for population density and surface hydrology (Tompkins and Ermert 2013). Despite its
novelty and provision of adequate approximations of biological and epidemiological
features of malaria in Africa (Caminade et al. 2014, Tompkins and Di Giuseppe 2015),
immunity to malaria is missing in its formulations. Since immunity is an important
malaria transmission determinant in sub-Saharan Africa (Doolan et al. 2009), its ab-
sence in VECTRI suggests the model may be unable to describe the overall malaria
transmission dynamics in the region quantitatively. Also, VECTRI parameter settings
Bibliography
have not been optimized to determine their relative importance to malaria outcome.
Since parameter settings are most influential on model output (Chitnis et al. 2008), de- termining their sensitivity to the model outcome is critical for VECTRI validation and guide for future research efforts (Hamby 1994).
1.3 Research questions
To find solutions to the identified problems this research addresses the following ques- tions:
1. Can we use EIR
mdata to understand how climate and environment including mosquito type influence seasonal malaria transmission in Africa?
(a) How do climatic factors such as rainfall and temperature influence seasonal malaria transmission?
(b) How do hydrological settings such as irrigation and permanent water bod- ies affect malaria seasonality?
(c) Is malaria seasonality different at population density domains such as ur- ban, peri-urban and rural areas?
(d) Does malaria seasonality differ at different elevations?
(e) How do vector type and their distribution in various climatological settings affect malaria seasonality?
2. Do VECTRI and LMM
2010simulate realistic seasonal malaria patterns in Africa as a function of climate and environment?
3. Can a model of immunity to malaria be formulated to understand its impact on seasonal malaria transmission in Africa?
4. Does incorporating immunity into VECTRI make it more realistic and reliable for seasonal malaria study in Africa?
5. How does VECTRI parameter settings influence its seasonal malaria outcome?
(a) Can we optimize the parameter settings of VECTRI to determine their rel- ative importance to VECTRI simulation of seasonal malaria?
(b) Which parameters of VECTRI contribute most to its output variability and require additional research to reduce the uncertainty or are insignificant and can be eliminated from the model settings?
1.4 Objectives
The study seeks to achieve the following objectives:
1. Determine the impact of climatic and environmental variables including mosquito
species on malaria seasonality in Africa.
Bibliography
2. Verify the accuracy of LMM
2010and VECTRI in simulating seasonal malaria transmission in Africa as a function of climate and environment.
3. Evaluate the reliability of a formulated simple model of immunity to malaria in Africa.
4. Improve VECTRI’s simulation of seasonal malaria by incorporating the formu- lated immunity model into its structure.
5. Ascertain the relative importance of VECTRI parameter settings to its seasonal malaria simulations through a sensitivity study.
1.5 Organization of the thesis
The research is organized into the following chapters: In chapter one the motivation to this study encompassing problem statement, research questions, and objectives are presented.
Chapter two reviews the literature on the Plasmodium parasite prevalence, burden, transmission drivers, metrics for estimation malaria transmission, and weather-driven dynamical mathematical malaria models.
In chapter three, the impact of climatic and environmental factors including vector species on seasonal malaria transmission using spatial EIR
mdata is presented.
Chapter four uses EIR
mdata to validate and evaluate the accuracy of VECTRI and LMM
2010in simulating seasonal epidemiological patterns of malaria in Africa.
In Chapter five, the reliability of a formulated simple model of immunity to malaria
is evaluated. The chapter also examines whether or not an inclusion of the immunity
model into VECTRI structure improved its simulation of seasonal malaria transmis-
sion in Africa. Besides, the relative importance of VECTRI parameter settings to its
seasonal malaria simulations was examined through a sensitivity study. The thesis is
concluded in chapter six with summary, discussions and future outlooks.
CHAPTER 2 Literature review
2.1 Malaria and the Plasmodium parasite
Malaria is a life-threatening vector-borne disease caused by the genus Plasmodium parasite (WHO 2015). Primary route of human infection is through bites of sporo- zoites infected female Anopheles (An.) mosquitoes during blood meal (Ross 1897).
Infection can also take place via shared contaminated sharps (eg. needles, blades, syringes), mother to child during pregnancy and delivery, blood transfusion and organ transplant (WHO 2014). Symptoms may include fever, headache, muscle aches, chills, tiredness, nausea, vomiting and diarrhoea (Laishram et al. 2012, WHO 2000). Com- plicated symptoms may involve the nervous, respiratory and renal systems (Trampuz et al. 2003). Five species of the parasite causes disease in humans namely Plasmod- ium (Pl.) falciparum, vivax, malariae, ovale and knowlesi (Singh and Daneshvar 2013, WHO 2015).
2.1.1 The genus Plasmodium life cyle
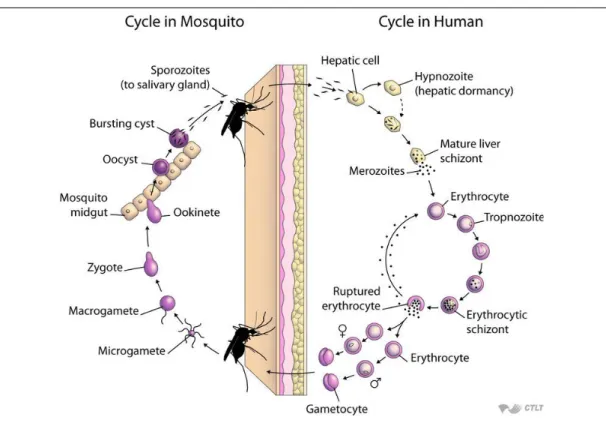
Figure 2.1: The life cycle of the genus Plasmodium parasite. Source: JHSPHOPEN- Courseware (2016)
Bibliography
The parasite’s life cycle is reportedly complex, involving sexual and asexual devel- opmental stages and alternates between the female An. mosquito (the vector) and the human host (Aron 1988, Aron and May 1982). The five human species informedly exhibit similar life cycle (Gueirard et al. 2010) as illustrated diagrammatically in Fig- ure 2.1.
During a blood meal, a sporozoite-infected female An. mosquito injects some of the sporozoites (fewer than 100 (Ponnudurai et al. 1991, Rosenberg et al. 1990)) into the human bloodstream. The inoculated sporozoites find their way into the liver and invade the liver cells called hepatocytes (Bailey 1988, Mota et al. 2001). While in the liver, they undergo asexual multiplication (schizogony) for a period (about 9-14 days for Pl.
falciparum, 12-17 days for Pl. vivax and 18-40 days for Pl. malariae (Warrell 2002)) to form merozoites (Bousema et al. 2014, Josling and Llinas 2015). Matured merozoites exit the hepatocytes after fracturing them and occupy the red blood cells (erythrocytes).
In the blood, they engage in a cycle of erythrocytes invasion and rupture. First, they enlarge into trophozoite after conquering the red blood cell. The trophozoites undergo asexual divisions to form schizonts. Matured schizonts then rupture freeing the newly formed merozoites (about 15 to 30 (Homann 2008)) into the blood that re-invade new erythrocytes (Miller et al. 2002). This cycle repeats about 1-3 days, infecting thousands of red blood cells of the host leading to illness and complications if not treated (Diebner et al. 2000).
Some of the merozoite (<10%) leave the asexual replication cycle and develop into sexual forms of the parasite, called gametocytes (Josling and Llinas 2015). A female An. mosquito having a blood meal on an infected human may ingest these gametocytes.
In the mosquito midgut, the gametocytes develop further into male and female gametes which fuse to form diploid zygotes. The Zygotes develop into ookinetes that burrow through the mosquito midgut wall and form oocysts. After a period of growth in the mosquito gut (12 days for Pl. falciparum (Anderson and May 1991, Bruce-Chwatt et al. 1973) ), the oocyst bursts and release the newly formed sporozoites into the body cavity of the mosquito. The sporozoites then maneuver their way into the mosquito salivary glands where they remain in wait for another human infection cycle (Bousema et al. 2014, Josling and Llinas 2015).
2.1.2 Epidemiology and burden of malaria
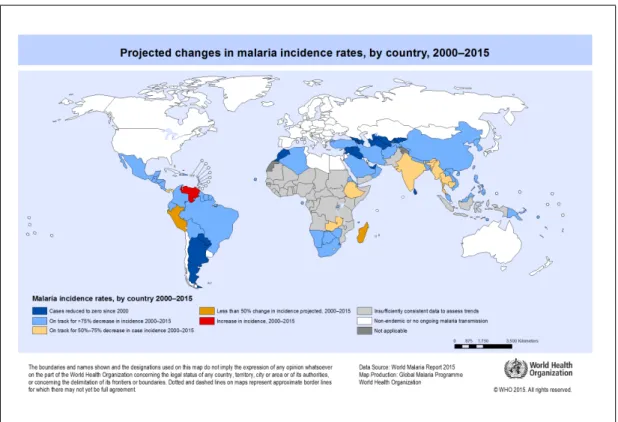
Malaria occurs throughout most of the tropical and subtropical regions of the world (see Figure 2.2). Africa especially the sub-Saharan is, however, the most malaria trou- bled region (Guerra et al. 2008). For instance, out of about 214 million new cases and 438000 malaria deaths estimated worldwide in 2015, 88% of the cases and 90% of the deaths (especially children under five years) were from the African region (WHO 2015). The disease remains perennial in most parts and one of the major public health concerns of the area (Grover-Kopec et al. 2006), despite a reduction in incidence and mortality rates by 42% and 66% respectively between 2000 and 2015 (WHO 2015).
The poorest and marginalised communities are often the most severely affected (Gallup and Sachs 2001).
Of the five human species, Pl. falciparum and vivax pose the greatest public health
Bibliography
Figure 2.2: Projected changes in malaria incidence rates by country, 2000–2015. Source:
(WHO 2015)
challenge (WHO 2015). Pl. falciparum is said to be the deadliest and the most widespread in the tropics especially Africa (Guerra et al. 2008, Guyatt and Snow 2001, Hammerich et al. 2002, Hay et al. 2010, McQueen and McKenzie 2004). Pl. vivax is supposedly rare in Africa with cases constrained to Madagascar and parts of the Horn (Gething et al. 2012, Mendis et al. 2001). Much of vivax (about 80-90%) occur in the Middle East, Asia, and the Western Pacific, with about 10-15% in Central and South Amer- ica (Mendis et al. 2001). Pl. vivax rarely cause death but inflicts debilitating fever, chills, nausea, vomiting, and myalgia (Baird 2004). Pl. malariae, ovale and knowlesi contribute a small proportion of malaria infection (Doolan et al. 2009, WHO 2015).
Pl. malariae is widespread in sub-Saharan Africa, much of south-east Asia, Indone- sia and many of the islands of the western Pacific (Collins and Jeffery 2007). Pl.
ovale is naturally distributed in sub-Saharan Africa and the islands of the western Pa- cific (Collins and Jeffery 2005). Pl. knowlesi (the zoonosis) is widely distributed in south-east especially in Malaysia (Cox-Singh and B 2008, Singh and Daneshvar 2013, White 2008). Sympatric and co-infection of the parasite species have been reported.
In Africa, Pl. malariae is frequently found in sympatry with Pl. falciparum (Collins
and Jeffery 2007). In Burkina Faso for instance, Gneme et al. (2013) found Pl. fal-
ciparum co-existing with malariae and ovale. Similar co-infection interactions in the
sub-region have also been reported in other studies such as McKenzie et al. (2002) and
Bousema et al. (2008).
Bibliography
2.2 Malaria transmission drivers
2.2.1 Vector species
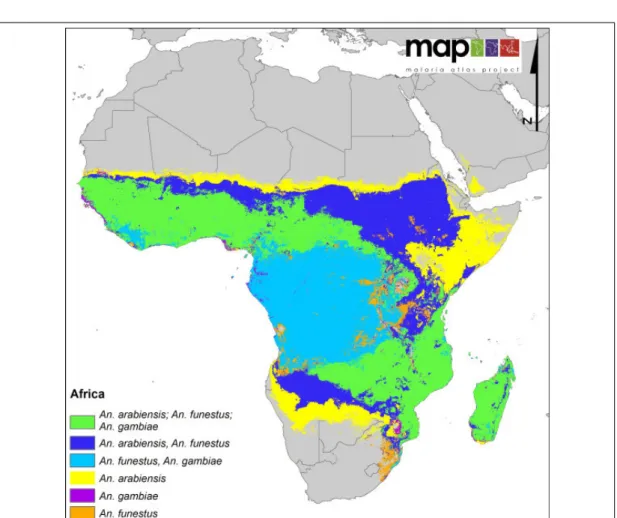
Figure 2.3: The distribution of three most dominant malaria vectors in Africa. Source: Sinka et al. (2012)
The high prevalence, morbidity and mortality rates of malaria in sub-Saharan Africa is partly blamed on the dominance of the most efficient malaria vectors in the region (Guerra et al. 2008, Hay et al. 2009). Reported dominant species include An. gambiae complex (gambiae ss, arabiensis, melas, merus), funestus, nili and moucheti (Coet- zee et al. 2000, Coetzee and Fontenille 2004, Levine et al. 2004, Lindsay et al. 1998, Murray et al. 2012, Sinka et al. 2010). An. gambiae complex class (especially An.
gambiae ss and arabiensis) and An. funestus have been observed as the most efficient
vectors in the region(Sinka et al. 2010, White 1974). Their geographic distribution
and the sympatric association is displayed in Figure 2.3. Collins and Besansky (1994)
indicates that a chunk of malaria cases in Africa are attributed almost entirely to these
three vectors. According to Coosemans et al. (1992), they are responsible for most of
the malaria cases due to their high anthropophilic behaviour (although An. arabiensis
is less anthropophilic when cattle feeding opportunity exists). Besides, An. gambiae
and funestus are long-lived vectors (high longevity).
Bibliography
2.2.2 Meteorological factors
Rainfall
Rainfall has been linked with malaria since the early days of the disease research (Gill 1920). Rainfall reportedly provide the aquatic sites needed by gravid malaria vectors to lay their eggs to develop into adult vector through stages of larvae and pupae (Martens et al. 1995, Molineaux 1988, Reiter 2001). Emerging adults then disperse according to their flight range (Kar et al. 2014). Besides, rainfall informedly provide humid- ity (at least 60%) suitable for vector survival (Reiter 2001, Thompson et al. 2005).
Studies (Craig et al. 1999, Gill 1920) have reported a correlation between the onset of rainy season and an increase in vector abundance. For instance, in a prospective analysis of malaria epidemic associated with El Niñoin in Ugandan highlands, Lind- blade et al. (1999) found that rainfall anomaly correlated positively with vector density one month later. Rainfall has also resulted in malaria epidemics at malaria-free zones.
For instance, Fontaine et al. (1961) report that the 1958 malaria epidemics outbreak in Ethiopia was a due to an unusually high rainfall amount. Lindsay and Martens (1998) also attributed the 1940 malaria outbreak in Nairobi Kenya to rain. Moderate rain is beneficial for the immature mosquitoes (water-bound stages) to strive and survive.
But excessive rain may result in higher water levels, high flow velocities and flooding of water impoundments which are detrimental to their survival (Martens et al. 1995, Paaijmans et al. 2007).
Temperature
Temperature regulates the rate of development and survivorship of both the vector and the parasite (Bayoh and Lindsay 2003; 2004, Beck-Johnson et al. 2013, Martens et al.
1995). According to Craig et al. (1999), the minimum temperature required for the development of Plasmodium falciparum and vivax approximates to 18
◦C and 15
◦C, respectively. High (low) temperature is reported to shorten (lengthen) the time required for mosquito and parasite maturation (le Sueur and Sharp 1991, Rueda et al. 1990).
Teklehaimanot et al. (2004) indicate that larval development may take more than 45 days at 16
◦C compared to only 10 days at 30
◦C. Craig et al. (1999) reports that the sporogonic cycle might take about 9 to 10 days at temperatures of 28
◦C but cease at temperatures below 16
◦C. Other studies (Bayoh and Lindsay 2003; 2004, Beier 1998) have suggested that the speed of the gonotrophic cycle which determines the feeding frequency of mosquitoes and the proportions of infective mosquitoes is also temperature regulated. Regarding vector survival, Craig et al. (1999) put forward that the daily vector survival is about 90% at temperatures between 16
◦C and 36
◦C with peak survival at temperatures between 28
◦C to 32
◦C. Kirby and Lindsay (2009) point out that temperatures above 40
◦C are often fatal to mosquitoes (Kirby and Lindsay 2009).
2.2.3 Environmental factors
Elevation
Malaria transmission intensity varies with altitude due to associated changes in tem-
perature (Drakeley et al. 2005). Cool temperatures at high elevations unlike at low
elevations limit malaria transmission. For instance, Bodker et al. (2003) found high
malaria transmission intensity at lowlands than at highland areas at six villages in the
Usambara Mountains in Tanzania along an altitude transect from 300m to 1700m.
Bibliography
In Papua New Guinea, Attenborough et al. (1997) established that the proportions of mosquitoes with malaria circumsporozoite antigens diminished with increasing alti- tude along a transect from 170 to 1000m. At different altitudes in western highlands of Kenya, Akhwale et al. (2004) detected that high prevalence of Plasmodium falciparum infection at lowland villages was concomitant with high anaemia than at highland ar- eas. In Tanzania, Balls et al. (2004) found in seven villages located at altitudes between 300m to 1650m a decline in splenomegaly risk with increasing height. Again in Tan- zania, Maxwell et al. (2003) found that EIR were 17 times greater at the low-elevated location than at high-elevated areas.
Population density
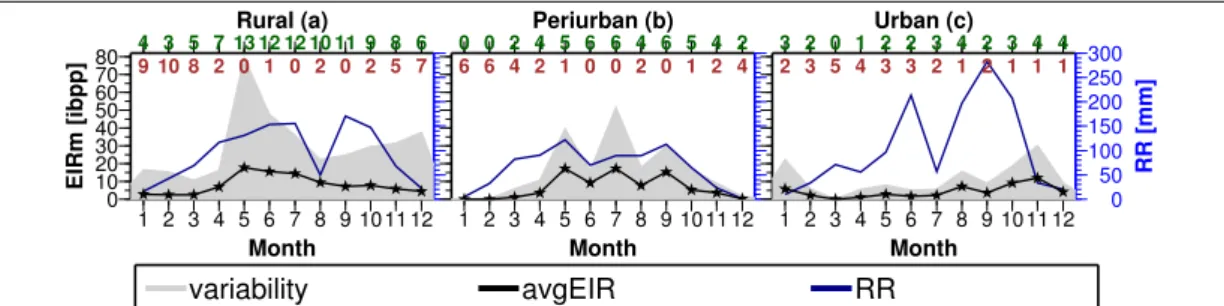
Population density differentiates malaria transmission intensity between rural, peri- urban and urban settings (Tompkins and Ermert 2013, Vercruysse et al. 1983). Among these settings, a general trend of increasing malaria transmission from urban to peri- urban and to rural centres have been reported (Hay et al. 2005, Keiser et al. 2004, Wang et al. 2005). For instance, in sub-Saharan African cities, Robert et al. (2003) found that the annual mean EIR increased from 7.1 at the city centres to 45.8 at peri-urban areas to 167.7 at rural locations. In Burkina Faso, Modiano et al. (1999) found epidemio- logical profiles and clinical malaria patterns to be high in rural settings than at urban environments. This pattern is explained by the fact that, the increase in population density from the countryside to cities result in a decrease in biting ratios (Kelly-Hope and McKenzie 2009). Additionally, polluted breedings grounds and access to public health services in urban areas also lowers transmission (Hay et al. 2005).
However, some studies reported otherwise. In Libreville, Gabon, Mourou et al. (2012) recorded high EIR in the most central and urbanized quarter than at the peripheral area.
At Cotonou in Benin, Wang et al. (2006) reported high prevalence rates of parasitemia (9.0%) in the intermediate than the center (2.6%) and periphery (2.5%). Reasons for this pattern has been blamed on localized differences in environmental settings. Ac- cording to De Silva and Marshall (2012), high malaria in urban areas may be due to low socioeconomic status and adaptation of malaria vectors to the urban environment.
Added, most African cities grow outwards with relatively under-developed or poorly serviced settlements in peri-urban areas (Byrne 2007). Such development activities are accompanied by open pits and burrows which serve as a source of vector breeding leading to high malaria. Some suburban dwellers may engage in agriculture for liveli- hood which provides breeding grounds for mosquitoes due to the formation of shallow water between seed beds (Adiamah et al. 1993, De Silva and Marshall 2012).
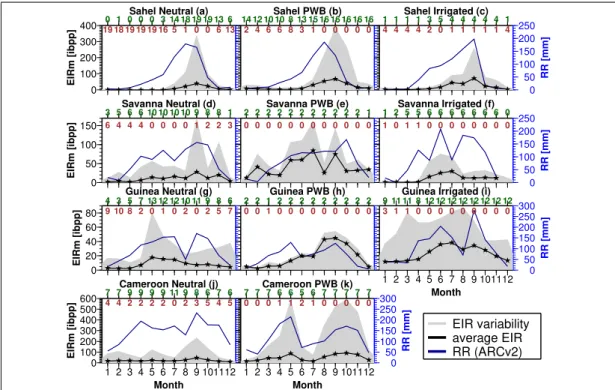
Temporal and permanent water bodies
Temporal and permanent water impoundments supposedly serve as potential habitat for water-bound stages of malaria vectors (Fillinger et al. 2009, Kar et al. 2014). Stud- ies have established the relationship between water bodies and malaria transmission.
In Kenya, Zhou et al. (2007) found that Anopheles gambiae and funestus populations
decreased with increasing distance from the Yala river. In Ethiopia, Lautze et al. (2007)
noted that malaria case rates among people living within 3km of the Koka reservoir was
1.5 times greater than those between 3-6km and 2.3 times higher than those within 6-
9km off the reservoir. Temporal breedings sites such as puddles and ponds get water for
breeding only in the rainy season. Permanent breeding sites such as rivers, lakes, and
Bibliography
streams contain water year round and tend to support a year-round malaria transmis- sion (Gianotti et al. 2009). Droughts may slow down or stop water flow in permanent water bodies, increasing their ability to support vector breeding (Haque et al. 2010).
Flooding of water bodies due to excessive rainfall could alternatively form puddles and ponds at the margins of the impoundment providing a second channel through which the disease-enhancing effect of the reservoir may operate (Lautze et al. 2007). Soil moisture at the surroundings of these permanent water bodies due to rise in ground- water level and reduction in infiltration loss may boost possible breeding grounds by increasing the lifespan of temporary puddles and ponds (Tompkins and Ermert 2013).
Irrigation
Crop irrigation schemes are said to pose considerable risk to malaria especially at epi- demic zones (Keiser et al. 2005, Kibret et al. 2014, Muturi et al. 2006). Irrigated fields are known to provide breeding sites for many species of mosquitoes, ideally members of the An. gambiae complex such as An. arabiensis which prefer to breed in open sunlit pools (Carnevale et al. 1999, Snow 1983, White 1974). Irrigated cultivation may there- fore extend the breeding season thereby increasing the annual duration of the diseases transmission. Irrigation may also elevate relative humidity in dry regions aiding vector survival (Ijumba and Lindsay 2001). There is no clear malaria transmission pattern be- tween irrigated and non-irrigated settlements. For instance, Coosemans (985b) found in Burundi that the vectorial capacity of An. gambiae s. l. was 150 times higher in rice irrigated scheme than in adjacent areas. In Bobo Dioulasso, Burkina Faso, Robert et al. (1985) determined that the number of infective bites received in a rice growing area was similar to that in a control area. In Tanzania, Ijumba (1997) detected that the number of infective mosquito bites at Lower-Moshi irrigation scheme was 2.6 times lower than at the control village. This suggests that, irrigation may frequently generate high vector numbers but does not necessarily translate into increased risk of exposure to malaria.
2.2.4 Human factors
Immunity
Human immune response to malaria infection is one of the essential features of the disease dynamics in sub-Saharan Africa (Molineaux et al. 1988). Malaria burden is high in children below 5-years of age and pregnant women than adults in the sub-region (WHO 2015). Mandal et al. (2011) explains that the differential burden of the disease is due to their immune status and time spent in the area. Doolan et al. (2009) alludes the reduced risk in older children and adults to acquired protective immunity resulting from the cumulative product of many years of heavy exposure to the antigen. Other studies (Baird et al. 1991; 2003) suggest that the acquisition of immunity by the older folks may be due to intrinsic factors linked with aged that enables a quick immune response than children below 5 years. Unlike endemic areas, the disease burden at epidemic zones where continuous exposure does not occur, cuts across all ages (WHO 2015).
Different stages of immunity to malaria have been reported namely clinical, anti-
disease and anti-parasite immunity (Doolan et al. 2009, Filipe et al. 2007). Baird
(2004) points out that clinical immunity develops after 5-15 years of continuous expo-
Bibliography
sure to malaria antigens in sub-Saharan Africa. The onset of anti-parasite immunity is however thought to correlate with adolescences (Doolan et al. 2009, Langhorne et al.
2008). In Western Kenya for instance, Kurtis et al. (2001) found the onset of anti- parasite immunity to correlate with puberty from 15years and above. The number of exposure needed to acquire resistance is uncertain. Gupta et al. (1999b) suggest that across a broad range of transmission intensities, one or two malaria infections is enough to acquire immunity. In other works (Baird 1995, Baird et al. 1991, Ciuca et al.
1934), ranges of 4-6 malaria infections is reported as the required number of exposure for immunity develop.
Just as new infections are needed to boost acquired immunity, it is however lost in the absence of exposure to new infections (Aron 1983). For instance, Struik and Riley (2004) and Jennings et al. (2006) found that clinical disease emerged only in migrants from endemic settings who remained away for at least 3-5 years. Filipe et al. (2007) found a half-life of 5 years for clinical immunity but 20 years for anti-parasite immu- nity. In another study, Färnert et al. (2015) noticed that sub-Saharan African immi- grants who lived for more than 15 years in Sweden had a similar risk as non-immune travellers.
Parasite clearance
According to White (2011), parasite clearance is a measure of therapeutic response.
Immunity enhances parasite clearance in malaria (Yorke and Macfie 1924). An in- crease in immunity lowers parasite counts and accelerate parasite clearance. Con- versely, a decline in immunity, for example, a reduction in transmission, decelerate parasite clearance rate. Parasite clearance duration is further shortened with the aid of antimalarials (Gomes et al. 2008, White et al. 1989). For instance, Tangpukdee et al.
(2008) indicated that antimalarial chemotherapy for uncomplicated and complicated malaria takes three and five days respectively. Pukrittayakamee et al. (2008) found a longer range of about 2-504 hours of gametocyte clearance time which also correlated with the asexual parasite clearance time. The resistance of the parasite to antimalarials may also dictate the clearance time. For example, a drug that will usually clear parasite within 3 days may take longer than that in the case of resistance. Self-clearance (with- out antimalarials) with antibodies alone may take a longer time (Cohen et al. 1961).
In a longitudinal study of recovery rates in Nigeria, Bekessy et al. (1976) noticed a self-clearance time of about 625 and 52 days in infants and adults (> 44 ) respectively.
Added, Macdonald (1950) found an average self-clearance time of about 200 days in a study analysing parasites rates in infants. Similar studies (Eyles and Young 1951, Jeffery and Eyles 1954) in malaria-naive adults found a mean self-clearance duration of about 200-300 days.
2.3 Entomological metrics for malaria transmission
2.3.1 Human Biting Rate
Human Biting Rate (HBR) is defined as the number of mosquito bites a person receives
per unit time Tusting et al. (2014). Mathematically, it is expressed as the product of
the Anopheline density/capture to people and the average number of persons bitten by
one mosquito at a unit time (Baird et al. 2002, Hay et al. 2000, WHO 1975). Stan-
dard methods recognised by World Health Organization (WHO) for estimating HBR
Bibliography
in the field include indoor and outdoor Human Landing Catches (HLC), Pyrethrum Spray Catches (PSC), and Light Traps Catches (LTC). Among the methods, HLC is considered the most direct technique as it directly samples human biting mosquitoes (Le Goff et al. 1997, WHO 1975). HLC is, however, both capital and labour intensive, technically difficult to replicate, unethical in areas of drug-resistant malaria, subjected to biases of collectors and their attraction to mosquito (Fontenille et al. 2001, Kilama et al. 2014, Tusting et al. 2014). Unlike HLC, PSC and LTC depend largely on the behaviour of mosquitoes rather than directly feeding on humans (Hay et al. 2000). For this reason, Tusting et al. (2014) note that PSC and HLC may likely overestimate true biting rates, particularly when scores of mosquitoes are biting. Besides, people will often devise ways to avoid a large number of mosquito bites.
2.3.2 CircumSporozoite Protein Rate
CircumSporozoite Protein Rate (CSPR) refers to the proportion of the biting mosquitoes (HBR samples) with sporozoites in their salivary glands (Baird et al. 2002, Hay et al.
2000, WHO 1975). Standard WHO methods for estimating CSPR includes Dissection (of the thorax of the mosquitoes to help reveal potential sporozoites under the mi- croscope), Enzyme-Linked Immunosorbent Assay (ELISA) and Plasmodium-specific Polymerase Chain Reaction (PCR) (Durnez et al. 2011, Hay et al. 2000). According to Durnez et al. (2011), dissection and microscopic examination of the salivary glands of individual mosquitoes are labour intensive and not practical for assaying a high number of mosquitoes. ELISA is considered more advantageous in the sense that the collected mosquitoes can be stored until processed and the method is as well able to distinguish the different human Plasmodium species by species-specific monoclonal antibodies (Burkot et al. 1984, Durnez et al. 2011). Moreover, ELISA techniques are less sensi- tive compared to Dissection, especially when small numbers of sporozoites are present in the salivary glands (Beier et al. 1990). On the contrary, others studies (Beier et al.
1990, Durnez et al. 2011) have indicated that ELISA techniques could overestimate sporozoite rate since it does not only detect sporozoites in the salivary glands, but also in other mosquito tissues. PCR assays can detect as few as ten sporozoites (Tassanaka- jon et al. 1993) in contrast to ELISA which requires at least 100 sporozoites (Beier et al. 1987). As put forward by (Durnez et al. 2011), PCR is disadvantageous in that it detects not only the sporozoites but also all the Plasmodium DNA present.
2.3.3 Entomological Inoculation Rate
EIR is expressed as the product of the number of mosquitoes attempting to feed on
humans (HBR) and the fraction of the feeding mosquitoes that are actively infective
(CSPR) (Bruce-Chwatt 1985, Macdonald 1957). In simple terms, it is the number of
infectious mosquito bites a person receives per unit time. EIR is regarded as the gold-
standard malariometric (Shaukat et al. 2010, Tusting et al. 2014). First and foremost,
it can directly quantify parasite-infected mosquitoes and their propensity to transmit
the parasites to humans (MARA 1998, Shaukat et al. 2010). For this reason, it can be
used to quantify the impact of vector control and anti gametocytocidal drugs (Shaukat
et al. 2010). Secondly, EIR satisfactorily produces an overall estimate of the exposure
of a population to malaria parasite (Beier et al. 1999, Takken and Lindsay 2003). It can
therefore be used as a legible assessor of malaria endemicity and epidemic risk (Burkot
and Graves 1995, Onori and Grab 1980). The last but not the least, Tusting et al. (2014)
Bibliography
argues that EIR estimates are easily interpreted by policymakers and national malaria control program managers alike.
On the contrary, Hay et al. (2000) point out that uncertainties in EIR estimates may be huge since the different methods for determining HBR and CSPR are not standard- ised. Besides, unskilled labour (few trained specialists) are usually involved during mosquito sampling. The number of sample mosquitoes may, therefore, be largely bi- ased and for that matter may subject estimated EIR to limited precision and accuracy (Fontenille et al. 2001, Kilama et al. 2014, Tusting et al. 2014). Also, estimated EIR does not directly translate into malaria incidence or clinical disease and does not accu- rately represent exposure when interventions are in place (Tusting et al. 2014). More- over, it fails to capture local level transmission variability determined by the habits, genetics and physiology of different vector species, spatial heterogeneity of vector habitats, immune status of the local human population or anti-mosquito strategies em- ployed by local communities (Takken and Lindsay 2003).
2.4 Weather-driven dynamical mathematical malaria models
Mathematical modelling of malaria dates back to Sir Ronald Ross (Ross 1915) as the pioneer. Macdonald (1957) and Anderson and May (1991) later reasserted Ross’ ideas.
Further studies expanded these pioneering models by including factors such as varying population size (Chitnis et al. 2006, Ngwa and Shu 2000, Torres-Sorando and Ro- driguez 1997), environment (Parham and Michael 2010), socio-economic, age and immunity (Aron 1988, Filipe et al. 2007, Yang 2000). Generally, mathematical models of malaria transmission have provided an understanding of the disease progression and transmission dynamics (Dobson and Carper 1992, Mandal et al. 2011). According to Parham and Michael (2010), they have helped address multiplicative exposure effects, non-linear feedback pathways, spatiotemporal heterogeneities and complex transmis- sion dynamics of the disease. Models of malaria can be used to quantify both current and future changes in malaria progression (Patz et al. 2003) as well as compare the effects of control strategies used individually or in packages (Chitnis et al. 2008).
Weather-driven dynamical mathematical models of malaria are championing the progress of the disease research. For instance, based on the effect of mean rainfall and tempera- ture on the biology of malaria transmission, Craig et al. (1999) proposed a fuzzy logic model of the distribution of stable malaria transmission in sub-Saharan Africa. Parham and Michael (2010) developed a simple model that allows novel insights into the ef- fects of rainfall and temperature on mosquito population and malaria transmission dy- namics. Using a simple mathematical model, Lindsay and Birley (1996) examined the influence of temperature on the ability of Anopheles maculipennis to transmit falci- parum vivax. Hay et al. (2002) employed regression approach to investigate reports on long-term meteorological trends in four high-altitude sites in East Africa.
In 2010, some fundamental processes of the weather-driven Liverpool Malaria Model (Hoshen and Morse 2004) were modified by Ermert et al. (2011a) through an exten- sive literature survey regarding entomological and parasitological malaria variables.
The calibration and validation of the modifed verstion of the model herein referred to
Bibliography
as LMM
2010are detailed Ermert et al. (2011b). More recently, Tompkins and Ermert (2013) introduced a regional scale, high resolution, dynamical malaria model in 2013 known as VECTRI. The model accounts for the impact of temperature and rainfall variability on the development cycles of both the vector and the parasite as well as en- vironmental factors such as population density and surface hydrology. Bomblies et al.
(2008) also introduced a modeling approach that explicitly incorporates hydrologic
variability into vector abundance and then malaria incidence. Bomblies et al. (2009)
represented the impacts of hydrological variability at the village scale and demon-
strated through computer model simulations the importance of high resolution hydro-
logical variability for the prediction of village-scale malaria transmission.
CHAPTER 3
The impact of climatic and environmental factors including mosquito type on seasonal malaria
transmission in Africa
Abstract
It is long understood that climate and environment influence malaria transmission in Africa. But there has been no comprehensive assessment in this regard using EIR
mdata. Previous attempts mostly relied on malaria prevalence or case data gathered from hospitals. But these metrics unlike EIR are aggregates of different windows of transmission and hence unsuitable for linking climatic and environmental drivers to a malariometric outcome. In this study, the seasonality of EIR
mwas analysed with the goal to understand how changes in the conditions of climatic and environmental factors including malaria vector type impacted on seasonal malaria transmission in Africa. A literature search for EIR
mdata across different locations over the region enabled the analysis. The results revealed that rainfall was the primary climatic factor explaining malaria seasonality at markedly seasonal rainfall areas such as Sahel and Eritrea. But at bimodal rainfall distributed and more humid zones, its impact was complex. The temperature was not a limiting factor of malaria seasonality in sub-Saharan Africa ex- cept for East Africa where it was able to delay the impact of rainfall. The peaking characteristics of seasonal malaria were mostly unimodal. In the case of bimodal rain- fall distributions, peaks were frequently associated with the first rainfall maximum of the year. Seasonal malaria intensity was anti-correlated with elevation and population density. Permanent water bodies and irrigation intensified and altered the seasonal transmission pattern from seasonal to perennial in areas of unstable transmission such as Sahel and Eritrea. Though seasonal malaria was collectively driven mainly by AG, AF and AA, they had a competing and complex individual impact on seasonality. The study is a step forward in malaria research as it demonstrated a more detailed analysis compared to existing literature. Though the utilised data was associated with some uncertainties, the findings have important implications for malaria control regarding the spatial and temporal target of malaria interventions and resource allocation. It also informs about future malaria modelling efforts and a guide on the validation and evaluation of the seasonal outcome of existing weather-driven malaria models for the region.
3.1 Background
Malaria transmission in Africa reportedly exhibits seasonality (Mbogo et al. 1995,
Shililu et al. 2003). The seasonal fluctuations of the disease are an epitome of endemic
and epidemic signals. The disease also varies both temporally and spatially especially
between climatic and ecological zones (Kasasa et al. 2013, Kelly-Hope and McKenzie
Bibliography
2009, Okello et al. 2006, Robert et al. 2003, Yeshiwondim et al. 2009). The variabil- ity and periodic signatures of malaria are mostly blamed on changes in climatic and environmental covariates over space and time (Beier 1998, Kirby and Lindsay 2009, Onori and Grab 1980, Thompson et al. 2005). Understanding malaria seasonality is, therefore, fundamental for effective planning and implementation of control activi- ties (Molineaux et al. 1988). Knowledge of the influence of climate and environment on seasonal malaria transmission facilitates the measurement and description of geo- graphic patterns, risk and burden of malaria (Gething et al. 2011, Reiner Jr et al. 2015).
Studies on malaria seasonality in Africa exist. Some studies have shown the tim- ings and duration of malaria season (Tanser et al. 2003) or predicted the number of months during which the disease transmission is possible (Craig et al. 1999, Grover- Kopec et al. 2006) using climate suitability in a given month as the hallmark. Many other works used malaria cases or prevalence data gathered from hospitals or clinics as metrics (Briet et al. 2008, Giha et al. 2005, Hay et al. 998a, Kleinschmidt et al.
2001, Mabaso et al. 2005, Teklehaimanot et al. 2004, Thomson et al. 1999, Yé et al.
2007). Others came out with working definitions for malaria seasonality (since there is no precise definition) using EIR (Ermert et al. 2011b) or both EIR and malaria cases (Roca-Feltrer et al. 2009).
But, previous works examining the impact of climatic and environmental factors on seasonal malaria transmission in sub-Saharan Africa using EIR
mas a metric are scarce.
Mabaso et al. (2007) came close to this subject but used a seasonality index (Markham 1970) that is deficient in irrigated and bimodal rainfall areas. Besides, they lumped up EIR
mdata from different climate settings in their analysis without decoupling their individual effect. Malaria cases or prevalence data on the other hand are unsuitable for linking factors of climate and environment to seasonal malaria since they are ag- gregates of different temporal transmission windows (Reiner Jr et al. 2015). Besides, health seeking behaviour of humans and health policies differ (Afrane et al. 2012).
But unlike clinical cases, EIR directly quantifies parasite-infected mosquitoes and their propensity to transmit the parasites to humans (MARA 1998). Also, EIR determinants (i.e. Human Biting Rate (HBR) and CircumSporozoite Protein Rate (CSPR) ) are de- pendent on the conditions of climate and environment (Appawu et al. 2004, Fontenille et al. 1997, Shililu et al. 2003). EIR estimates, therefore, can directly relate the human- biting activity of Anopheles vectors and the risk of humans to malaria infections to climate and environment (MARA 1998, Vittor et al. 2006).
In this study, spatial EIR
mdata were used to examine the impact of climatic and envi- ronmental factors including mosquitoes type on seasonal malaria transmission across sub-Saharan Africa. The EIR
mdata were gathered from different areas across the re- gion through a literature survey. The study then tested the hypothesis that rainfall is the primary climatic determinant of malaria seasonality and not temperature in the sub-region. The study further demonstrated that seasonal peaking characteristics of malaria have a high tendency towards single maxima than double or any other regime.
The work also verified that the influence of elevation and population density on malaria
seasonality is much to do with intensity than the timings whiles permanent water bod-
ies and irrigation impacted on both seasonal intensity and duration. The last but not
the least, the study showed that seasonal malaria transmission in sub-Saharan Africa is
Bibliography
governed by a sympatric association of AG, AF and AA.
3.2 Materials and methods
3.2.1 Materials
EIR
mdata
A review of literature for EIR
m[units: infectious mosquito bites per person (ibpp)]
data was conducted. Firstly, the entomological database (unpublished) of Swiss Trop- ical Institute of Medicine, Basel, Switzerland was consulted. This database consists mainly of EIR
mand other entomological parameters digitised from published articles on entomological surveys in Africa. The EIR
mdata obtained therein were verified from their original articles where possible for certainty. Secondly, the compiled entomolog- ical and parasitological literature archive of Ermert et al. (2011b) (their additional file 2) was utilised. EIR
mdata from articles of Ermert et al. (2011b) database that were unavailable in the Basel database were digitised using an R package (Poisot 2011).
Thirdly, an online search for more EIR
mdata was explored using search method pre- viously employed by Beier et al. (1999). Badu et al. (2013) also shared their EIR
mdata on malaria transmission intensity and dynamics in a mountainous forest region of Ghana.
The EIR
mdata gathered were then subjected to a relevancy test previously used by Beier et al. (1999) and Hay et al. (2000). Thus, EIR
mdata from a study was relevant if the study 1) employed WHO recommended methods for mosquito sampling and sporozoites detection (see section 2.3.1 a and 2.3.2) 2) period was at least one year with mosquitoes sampled every month or during the transmission season and 3) was conducted at a time where vector control measures were previously not applied.
Figure 3.2 shows the distribution (number of monthly observations in a year) of EIR
mdata considered after the relevancy test. The study analysis used EIR
mdata between the period 1983-2013 since more observations were within that period. Besides, the rainfall data (African Rainfall Climatology version 2 (ARCv2) dataset) are available from 1983 onwards. The number of locations and length of EIR
mdata observed at each zone is displayed in Table 3.1. The geographical locations of the EIR
mdata are displayed in Figure 3.1. The classification of the locations into climate zones, hydrology and population density as well as uncertainties pertaining to the observed EIR
mdata are detailed in Appendix A. Other details of the locations such as name, longitude, latitude, Start Year (SY), Start Month (SM), End Year (EY) and End Month (EM) are outlined in Table A.1 of Appendix A.
Table 3.1: Number of locations and amount of EIRmdata available at each zone Number of locations with n [year] of available data
Zone 1 [year] 2 [years] 3 [years] 4 [years] 5 [year] Total number of locations
Sahel 18 6 3 0 1 28
Savanna 16 1 0 0 0 17
Guinea 24 9 0 0 0 33
Cameroon 22 0 0 0 0 22
Eritrea 10 0 0 0 0 10
EEA 39 2 2 0 0 43