Electronic Structure and Magnetism of EuO Films on the Nanometer Scale
I n a u g u r a l - D i s s e r t a t i o n zur
Erlangung des Doktorgrades
der Mathematisch-Naturwissenschaftlichen Fakult¨ at der Universit¨ at zu K¨ oln
vorgelegt von
Dipl.-Phys. J¨ urgen Klinkhammer
aus Simmerath
K¨ oln 2013
Berichterstatter: Prof. Dr. Thomas Michely (Gutachter) Priv. Doz. Dr. Daniel B¨ urgler
Tag der m¨ undlichen Pr¨ ufung: 28.06.2013
Abstract
This thesis deals with thin films of the ferromagnetic semiconductor EuO. These are pre- pared by molecular beam epitaxy under ultra high vacuum conditions and their proper- ties are investigatedin-situby means of low energy electron diffraction, magneto-optical Kerr effect (MOKE), scanning tunneling microscopy (STM) and scanning tunneling spectroscopy (STS). The experiments are carried out in a low temperature STM appa- ratus with a base temperature of 5.3 K. The development of a highly sensitive MOKE instrument is in the technical focus of this work. EuO is grown in (100) orientation on a ferromagnetic Ni(100) single crystal as well as on single crystalline graphene on Ir(111).
An antiferromagnetic coupling between the magnetic moments of the Ni(100) and the EuO(100) film turns out. The 3.3 nm thin stoichiometric films of EuO on graphene show a Curie temperature TC = 75 K, which is increased with respect to films of the same thickness grown on other substrates and even with respect to bulk EuO [1–3].
Point defects in EuO films are analyzed with help of atomically resolved STM images.
The defect concentration can be quantified using highly-resolved STM topography im- ages. The mobility of the oxygen vacancies is shown by a series of topography STM images and a mobility of the vacancies along the EuOh011idirections is found. Investi- gations of the electronic structure of the EuO(100) surface are performed by STM and STS, which require a high sample quality, i.e, a topographically very well ordered and flat surface with a minimum of defects. The ultra thin films of EuO on graphene de- scribed in thesis are of such high quality. A local n-doping and an upward band bending is found at the oxygen vacancy sites. Tunneling spectroscopy maps of the ferromagnetic EuO(100) surface show standing wave patterns, which are the characteristic fingerprint of the surface state in EuO(100). The energy vs. momentum space of the surface state is explored by evaluating the surface state scattering patterns. A dispersion relation determined this way of the surface state is free electron like, with an effective mass of (1.09±0.10) times the mass of a free electron. The same measurements are per- formed in the paramagnetic phase of EuO at 81 K. Thereby the surface state is shifted in energy. The shift indicates indirectly the spin degeneracy of the surface state in the paramagnetic phase, which is lifted in the ferromagnetic phase of EuO. This behavior is analogous to the well known spin splitting of the EuO conduction band [4]. The spin splitting of the surface state (measured with this work) amounts to 0.66 eV.
Contents
Abstract i
Table of Contents ii
Frequently used Symbols v
1 Introduction and Motivation 1
2 Background 3
2.1 EuO Properties . . . 3
2.2 Mean Field Magnetization . . . 10
2.3 Magneto-Optics . . . 12
3 The Low Temperature Scanning Tunneling Microscopy Apparatus 15 3.1 Sample Holders and Tip Tool . . . 16
3.2 The Manipulator . . . 18
3.3 The Molecular Beam Epitaxy Station . . . 19
4 Development of a MOKE Setup 23 4.1 The Light Source . . . 24
4.2 The Magnet . . . 25
4.3 The Detector . . . 27
4.4 The Ambient Conditions MOKE Setup . . . 29
4.5 Technical Aspects of Automatization . . . 30
4.6 MOKE Test Measurements . . . 31
5 Experimental Procedures 35 5.1 Substrate Preparation . . . 35
5.2 Graphene Preparation . . . 35
5.3 EuO Growth . . . 37
5.4 LEED Measurements and Data Post Processing . . . 39
5.5 Scanning Tunneling Spectroscopy Technique . . . 40
5.6 MOKE Measurement Procedures . . . 41
CONTENTS
6 Growth and Magnetism of EuO on Graphene 45
6.1 From Single EuO Grains to Thin Films . . . 45
6.2 Magnetic Reference Measurements at the LT-STM Machine . . . 48
6.3 Magnetism of 3.3 nm Thin Films of EuO(100) on Graphene . . . 51
6.4 Easy Magnetization Direction and Superparamagnetic Limit . . . 54
7 Defects in EuO 57 7.1 Strong Electronic Corrugation . . . 57
7.2 Oxygen Vacancies . . . 59
7.3 Defect Mobility . . . 62
7.4 Work Function of EuO and Local Band Bending . . . 64
8 The Spin Polarized Surface State in EuO(100) 69 8.1 Electronic Scattering Pattern on EuO(100) . . . 69
8.2 Spin Degeneracy of the EuO(100) Surface State . . . 72
8.3 The Brillouin Zone of the Surface State and its Signature on Defect Sites . . . 75
9 Magnetic Properties of EuO(100) on Ni(100) 79 9.1 Magnetic Characterization of the Ni(100) Substrate . . . 79
9.2 Magnetic Coupling of EuO(100) and Ni(100) Moments . . . 82
10 Summary and Outlook 85
References 89
A Preparation of Tungsten Tips 105
B Calculation of Heisenberg Magnetization Functions 111
C Usage of MOKEsoft 113
D Calibration of the Electromagnet 115
E Construction Plans 123
Publications 156
Kurzfassung 158
Acknowledgements 160
Offizielle Erkl¨arung 162
Frequently used symbols and abbreviations
Φ . . . Apparent Height of Tunnel Barrier¯ Φ . . . Work Function
Θ . . . Coverage ΘKerr . . . Kerr Angle
ΘKerr(Rem) . . Remanent Kerr Angle ΘKerr(x mT) . Kerr Angle at x mT B . . . Magnetic Field EF . . . Fermi Energy E . . . Energy I . . . Current M . . . Magnetization TC . . . Curie Temperature TInt . . . Integration Time TLat . . . Latency Time TLoop . . . Time Per Loop T . . . Temperature UBias . . . Bias Voltage
z . . . Vertical Tip to Sample Distance ARMCO . . . American Rolling Mill Company BOP . . . Bipolar Operational Power CVD . . . Chemical Vapor Deposition DOS . . . Density of States
EDS . . . Electronic Defect Site ELD . . . Electronic Line Defect FM . . . Ferromagnetic
IF . . . Interference Filter LDOS . . . Local Density of States
LEED . . . Low Energy Electron Diffraction
LT-STM . . . Low Temperature Scanning Tunneling Microscopy MBE . . . Molecular Beam Epitaxy
MIT . . . Metal to Insulator Transition ML . . . Monolayer
MOKE . . . Magneto-Optical Kerr Effect PT . . . Photo Transistor
QMS . . . Quadrupole Mass Spectrometer SEM . . . Scanning Electron Microscope
SQUID . . . Superconducting Quantum Interference Device SS . . . Surface State
STM . . . Scanning Tunneling Microscopy STS . . . Scanning Tunneling Spectroscopy TPG . . . Temperature Programmed Growth UHV . . . Ultra High Vacuum
YSZ . . . Yttria-Stabilized Zirconia
CONTENTS
1 Introduction and Motivation
Since 1961 [5] scientific interest in Europium monoxide (EuO) is attracted by a variety of strong physical effects. The combination of this variety and its simple rocksalt crystal structure makes EuO a model system. EuO is famous for the strongest magneto-optical Kerr effect (MOKE) ever measured in a material, which gives rise to a Kerr rotation of of 7.1◦ for bulk samples [6]. Due to its strong coupling of light and magnetism [7], the magneto-optical Kerr effect is of importance for optical data storage media [8]. In the framework of this thesis the magneto-optical Kerr effect is utilized toin-situ investigate the magnetic properties of EuO samples.
Renewed interest in EuO came up with the rise of spintronics [9; 10] due to the almost 100% spin polarized bottom of the EuO conduction band [4]. Stoichiometric EuO is a ferromagnetic semi- conductor, two properties not often seen in one material, with a Curie temperatureTC = 69 K [5].
TC of bulk EuO is enhanced by n-doping [11–13], but no dopant managed to riseTC up to room temperature. Ultra thin EuO films show a decreased Curie temperatureTC[2; 3], which is counter- productive for applications. EuO combines the properties of a semiconductor with distinct magnetic properties. Thus, it is an attractive material for information technology since it allows to store information by its charge and additionally by spin states.
Presently EuO is very prominent as spin filter barrier [10; 14–16]. The field of spintronics is intrin- sically a nanotechnology and thus nanostructures of EuO are of most interest. The fabrication of EuO nanostructures requires the growth of thin epitaxial EuO films. Such high quality EuO(100) films are grown on a graphene substrate [17]. The properties of thin films can be tuned by their substrate [18]. For instance intercalation enables a tuning of the graphene’s properties [19] and thus of EuO grown on top.
Further, the combination of EuO on top of graphene is attractive from the spintronic point of view.
A gating of the EuO induces spin polarized charge carriers in graphene by a proximity effect [20].
The large spin relaxation times of spin polarized charge carriers in graphene [21–23] make it one of the most promising spin conductor materials.
Topic of many experiments, theories, and discussions with open questions is the metal to insu- lator transition (MIT) in EuO. The MIT occurs simultaneously with the ferromagnetic transition through the coupling of magnetism and electronic properties in EuO induced by n-doping [2; 24–
32]. Mainly EuO n-doped by oxygen vacancies [12; 33–40] and gadolinium [12; 25; 32; 41–45]
were investigated in the past. Discussions occurred, whether an oxygen off-stoichiometry alone can cause the MIT, or if the inclusion of impurities is needed [46]. The two most prominent theories explaining the MIT in EuO are the Helium-model [24] and the bound magnetic polaron (BMP)
1. Introduction and Motivation
model [26; 30]. The idea of the BMP is that the MIT is a spatial inhomogeneous percolation phase transition.
Thin films of EuO are an ideal benchmark system for the experimental techniques of surface science.
The nature of the MIT can be solved by measurements which are sensible to the electronic struc- ture with a sub-nanometer spatial resolution. Such a technique is scanning tunneling spectroscopy (STS). STS can be applied around dopant sites to map conducting areas in a semiconducting ma- trix at the onset of the MIT.
An autonomous motivation for spectroscopy on EuO surfaces can be gained by the present re- search on topological insulators [47] which exhibits two dimensional electron systems on surfaces of semiconductors. This also leads to a renewed interest in spin-polarized surface states of topo- logically trivial materials. Of specific interest are spin-polarized surface states in the band gap of semiconductors or insulators, as these states will contribute significantly to the transport in such systems. A prediction for an exchange-split surface state in a semiconducting oxide was made for EuO(100) more than ten years ago by R. Schiller and W. Nolting [48], but withstood experimental observation until now [45].
This thesis now looks at the electronic structure of EuO(100) on the nanometer scale with tun- neling spectroscopy and its connection to ferromagnetic order. A MOKE apparatus is developed for this purpose. Tunneling spectroscopy is based on a tunneling current, and therefore requires conductive samples. EuO is grown by MBE under UHV conditions on conductive substrates and is in-situ investigated since it is not stable under ambient conditions. This thesis therefore continues the work initiated in the PhD project of D. F. F¨orster [17].
2 Background
2.1 EuO Properties
Figure 2.1: “Ball and stick model of the rock- salt crystal structure of EuO. Red balls repre- sent O atoms and blue balls Eu atoms.” [17].
Taken from reference [17].
EuO is a purely divalent ionic compound of Eu2+ and O2− ions. The electronic configuration of the Eu2+ ion is [Xe]4f75d06s0 [17], which means that the 4f orbital is half filled. It belongs to the rare class of ferromagnetic semiconductors [49; 50] with a Curie temperatureTC of about 69 K [51; 52]. It was first investigated by B. T. Matthiaset al. in 1961 [5]. As already mentioned EuO is very interesting with its almost 100% spin polarized charge charriers in the conduction band as first shown by P. G. Steeneken and L. H. Tjeng et al. [4; 13]. The magneto-optical Kerr effect (MOKE) in EuO [6] is the strongest ever measured. Further strong effects observed in EuO are photoconductivity [53–55], a colossal magneto-resistance (CMR) [26; 41] and a metal to insulator transition (MIT) in n-doped EuO [2; 24–32; 48; 56].
Crystalline and Electronic Structure
EuO grows in a simple face centered cubic (fcc) rocksalt structure (see figure 2.1) with a lattice constant of 5.144 ˚A [57]. The EuO(100) surface exhibits a checkerboard like arrangement of eu- ropium and oxygen atoms. This surface is of considerable interest for STS and STM measurements, because both chemical species are accessible. This is not the case for EuO(111) which is an alter- nating stacking of oxygen and europium layers. Since the oxidation state of the oxygen is 2- and of the europium is 2+ an EuO(111) film is polar. Due to the cost of electrostatic energy it is not possible to grow polar films thicker than a few atomic monolayers without the formation of (100) facets [17].
2. Background
Figure 2.2: “Band structure of EuO calculated using an LSDA+U(U= 7 eV) method” [58]. Taken from refer- ence [58].
In the 1970s the band structure of bulk EuO has been investigated by first optical absorption measurements [50]. In the paramagnetic state a band gap EG = 1.10 eV is determined. Thereby the highest occupied valence band level belongs to the 4f level and the lowest unoccupied EuO level is at the bottom of the Eu 5dt2g conduction band [11]. Optical measurements in the ferromagnetic state (at 20 K) reveal a red shift of the adsorption edge of 0.26 eV [33]. This effect is called the red shift, because optical light of longer wavelengths is absorbed by the band gap upon the paramagnetic to ferromagnetic transition. The red shift corresponds to an exchange splitting of the conduction band of 2·0.26 eV = 0.52 eV [33]. In 2002 spin resolved x-ray absorption studies in the ferromagnetic state of EuO reveal an exchange splitting of the conduction band of 0.60 eV [4].
Even more important is the spin polarization that way determined of the lower conduction band edge of almost 100% [4].
Figure 2.3: “The spin resolved den- sity of states of bulk EuO in the FM configuration with optimized bulk lattice parameters, a=5.1578 ˚A. The bands are labeled and the zero of energy is at the Fermi energy” [59].
Modified from reference [59].
Early [60; 61] and later photoemission studies [62; 63] show that “the energy levels of EuO which are important for the understanding of the low energy features, i.e., those which are near the chemical potential, are the O 2p orbitals, the Eu 4f orbitals, and the Eu 5d - 6s conduction band”
[62]. Band models derived from the optical 4f7→4f65d transition [64] suggest that the 4f levels
2.1 EuO Properties
are located directly below the Fermi energy EF, though this is not confirmed by photoemission measurements where the peak of the one electron 4f7→4f6 removal spectrum is not directly below EF [62]. “On-site correlation effects at the Eu 4f states make the existence of a 4f density of states at the Fermi level to be meaningless. Instead, one should see a f7→f6 peak at about 2 eV below the Fermi level, and a f7→f8peak above the Fermi level at about 7 eV” [62]. Angle-resolved photoemis- sion studies on EuO thin films in combination with density functional theory (DFT), see figure 2.2, (in the code WIEN2K [65] by H. Miyazakiet al.) reveal that “the Eu 4f states have sizable energy dispersion at both the G and X points” [58]. Therefore they conclude that hybridization of the Eu 4f states with other states like O 2p or Eu 5d takes place [58]. This is important for the mediation of magnetic exchange interactions, as explained in the next section 2.1.
Both band structure calculations shown in figure 2.2 and figure 2.3 are “calculated with the fullpo- tential linearized augmented plane-wave DFT code WIEN2K [65]” [59] and strong correleation between the 4f electrons are treated with the LSDA+U method. In both calculations the “on-site Coulomb repulsion energyU in the Eu 4f states is set to 7 eV” [58]. Figure 2.2 shows the momen- tum dependent band structure of bulk EuO with the 5d conduction band, the weakly dispersive 4f band at the Fermi edge and the O 2p valance band [58]. The relative energies in this plot are more reliable than the absolute values. This is the same for figure 2.3 where the spin resolved density of states (DOS) is presented for each atomic species in the EuO compound as well as for the whole compound.
Extra charge carriers are often introduced in EuO by n-doping [9; 13; 27; 33; 34; 42; 45; 66–77]. The most prominent n-doping mechanisms are the creation of oxygen vacancies and the substitution of Eu by gadolinium (Gd). Since the oxidation state of the oxygen ion in EuO is 2- the creation of an oxygen vacancy supplies two doping electrons [33; 78]. In the case of the substitution of Eu through Gd one extra electron is supplied per dopant atom, since the valence state of Gd contains one electron more as Eu [59].
Doping affects the electronic properties as well as the magnetic properties of EuO, such as the metal to insulator transition (MIT) with a drop of resistivity by 13 orders of magnitude [26] and an enhancement ofTC. TC was increased up to 200 K by La doping [67]. The Ruderman-Kittel- Kasuya-Yosida (RKKY) coupling mediated by doping induced charge carriers is one mechanism, responsible for theTC enhancement [11; 32]. The exact mechanisms of the MIT and TC enhance- ment are not fully understood and cannot be explained with doping alone [79]. “The compression of the crystal lattice due to the incorporation of the smaller Gd3+ ions plays a crucial role” [79; 80].
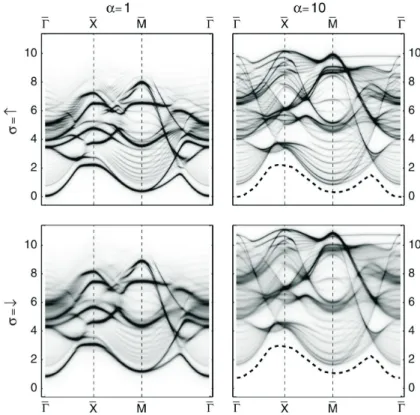
In 2001 R. Schiller and W. Nolting performed ferromagnetic Kondo-lattice model (FKLM) band structure calculations of a 20 ML thin EuO(100) film [48]. They calculated the layer dependent band structure in the ferromagnetic phase of EuO as presented in figure 2.4. Their calculations show a band in the surface layer additional to the bands in the center layer. The obvious inter- pretation of this additional density of states in the surface layer is the existence of a surface state
2. Background
Figure 2.4: Ferromagnetic Kondo-lattice model (FKLM) calculations on 20 ML of EuO(100). The local density of states of the surface layer (α=1) is presented in the left column and of the center layer (α=10) in the right column forT=0 K. “The dashed lines in the spectral densities for the center layers (right hand side) reproduce the positions of the lower band edges of the surface state bands as given by the spectral densities of the surface layers (left hand side). The energy zero refers to the Fermi energy.”
[48]. Taken from reference [48].
(SS). According to the KFLM calculations the SS shows a parabola-like dispersion relation with an effective mass of 0.6 ×me, whereby me is the mass of a free electron. The SS is spin split by 0.78 eV (extracted from figure 3 of reference [48]) and spin polarized in the ferromagnetic (FM) phase [48]. “The lower band edge of these surface state bands lies at the ¯Γ point about 0.8 eV and at the ¯M point about 0.45 eV below the lower conduction-band edge of the “bulk” bands” [48].
The ¯Γ point of the spin up SS Brillouin zone is claimed to be at the Fermi energy EFermi, which leads to the idea of an MIT in the EuO(100) surface.
For a general theoretical introduction to surface states the book “Physics at Surfaces” by A. Zang- will [81] is recommended. Additional see historical important experimental work on this topic by M. F. Crommie et al. [82; 83].
Magnetism of Bulk EuO and Ultra Thin Films of EuO
The magnetism in EuO originates from the magnetic moment of the Eu 4f electrons. For these 4f electrons a “strong screening by other closed electron shells keeps the Hund’s rules valid.” [56].
According to Hund´s rules the half filled Eu 4f orbital in EuO gives rise to a pure spin angular
2.1 EuO Properties
momentum J of J=S=7/2, with no component of an orbital angular momentum L. So with a Land´e factor of g=2, the magnetic moment amounts to 7µB per Eu atom. The macroscopic magnetization of an EuO crystal is gained by parallel alignment of the single atomic magnetic moments through the effective ferromagnetic exchange interaction. Because the EuO ground state is spherical symmetric8S7/2 the magnetic exchange interactions are isotropic and can be described by a simple Heisenberg model [11]. In this model the exchange interaction is described by the Hamiltonian in Eq. (2.1) with the exchange constantJij, between spin momentsS~i andS~j at the sitesi and j
H=−X
i,j
JijS~iS~j. (2.1)
Since the 4f electrons are highly localized, a direct exchange mediated by overlapping 4f wave functions between neighboring Eu2+ ions can be neglected [79; 84] and an indirect exchange mech- anism must be taken into account. Famous for the mediation of an indirect long range exchange coupling between localized magnetic moments is the Ruderman-Kittel-Kasuya-Yosida (RKKY) in- teraction, for example in gadolinium [85], or in heavy-fermion systems like CeCu6−xAux [86]. But since the RKKY interaction is based on the spin polarization of conduction electrons it does not hold for the semiconductor EuO. For a long time the exchange mechanism in EuO was not un- derstood, but many models on this topic evolved [11; 29; 56; 87–91] since EuO is considered as a Heisenberg model ferromagnet and its Hamiltonian [Eq. (2.1)]is easy to treat. Nevertheless the Heisenberg model cannot be solved exactly in an analytical way, but in good approximation the exchange mechanism can be described by two indirect interactions, one between Eu2+ nearest neighbors (NN) and another between Eu2+ next nearest neighbors (NNN) [79; 92].
The exchange constant J1 represents the NN exchange, which is a virtual transition of Eu2+ 4f electrons via a 5d or 6s state to an NN Eu site where it polarizes the 4f spin [11; 91]. Of courseJ1
is the sum over all NN Eu atoms exchange interactions of an Eu sitei. J1 is found to be positive and therefore to mediate a ferromagnetic coupling with the coupling strength ofJ1=5.22·10−5eV [93; 94].
The 4f exchange coupling to an Eu2+ ion on site i originating from a NNN site j mediated by an oxygen p state [11], also called superexchange mechanisms, is rather complex and can be separated into three contributions as proposed by T. Kasuya [84]:
1. The Kramers-Anderson mechanism: A 4f electron is transfered to an NNN 4f state via the O p bands where it forms a pair of Eu3+ and Eu1+ ions. Just a small antiferromagnetic exchange is given by this contribution.
2. An O2− p electron ion is transferred to the 5d or 6s states of the NNN Eu2+ site by the d-f exchange interaction. On the NNN Eu2+ site “it aligns the 4f spins through the d-f or s-f exchange interaction leads also to an antiferromagnetic coupling” [79].
2. Background
3. The third therm is “a cross term between Kramers-Anderson mechanism and the d-f exchange interaction is considered with p-d, f-p, and d-f transitions involving an inter atomic exchange”
[79].
These complex exchange mechanisms determines the exchange constantJ2, for which the sum in Eq. (2.1) over all NNN sites must be considered. J2 has been investigated experimentally by neutron scattering and specific heat measurements and found to be ferromagnetic in total and amounts to the value of J2=1.03 · 10−5eV [93; 94]. Since the sum over J1 and J2 is positive, the magnetic coupling in EuO is effectively ferromagnetic. NMR studies found the EuOh001i axes to be the hard magnetization axis and the EuOh111i axis to be the axis of easy magnetization [95]. For films of EuO “the magnetization will always be in the film plane” [36]. Despite plenty of theoretical and experimental studies on the exchange mechanism in EuO there are still a lot of open questions [96]. The ferromagnetic character of J2 depends strongly on the Eu-Eu distance as revealed by the other Eu chalcogenides which have a weaker ferromagnetic coupling due to the larger anion radius. For the case of EuS this results in aTC of 40 K [11], which is lower than the TC of EuO. For EuSe and EuTe it results in an antiferromagnetic coupling.
Figure 2.5: “Layer-dependent magnetizations hSzαi of EuO(100) films as functions of temperature for various thicknesses n. hSαialways increases monotonously from the surface layer towards the film center.
Inset: Curie temperature as a function of film thickness”[48]. Taken from reference [48].
Work on the magnetic properties in thin EuO films is summarized in the following. Especially the influence of the film thickness on the magnetization and therefore on the Curie temperature TC(n) of EuO is presented in this section, where n is the film thickness in atomic monolayers
2.1 EuO Properties
(ML) of EuO(100). In 2001 R. Schilleret al. performed calculations on thin films of stoichiometric EuO(100) as the ideal Heisenberg ferromagnet with S=7/2 in the thickness regime from 1 ML to 25 ML [48; 56]. They treated these layers with a “combination of a multiband Kondo lattice model with first-principles tight-binding linear muffin-tin orbital band-structure calculations” [56]. The Curie temperature isTC=15 K for a single atomic layer of EuO(100) and increases up to the bulk value with increasing film thickness, see figure 2.5. The bulk value of TC =69 K [5] is reached at about n=25 ML, which corresponds to a thickness of 6.43 nm. Figure 2.5 also reveals a decreased magnetization of the surface layer of the film compared to the center layer of the film. This effect can be explained by the lower coordination number of the surface Eu2+ ions and therefore missing magnetic exchange partners compared to these of Eu2+ ions in the bulk. So in case of the surface layer the magnetic exchange coupling of less neighboring sites is summed up.
In 2008 T. S. Santos et al. [1] and in 2009 M. M¨uller et al. [2] contributed to in this field with experimental work. T. S. Santoset al. utilized ultra thin films of EuO as tunnel barriers. TC(n) is displayed in figure 2.6, it follows qualitatively the behavior calculated by R. Schilleret al.. Besides this, “a large exchange splitting of the conduction band” [1] and nearly fully spin-polarized tunneling current is found when using the films as tunnel barriers, which demonstrates the feasibility of spin filter devices based on ultra thin EuO films.
Müller et al.
Figure 2.6: TC vs. film thickness of different EuO samples normalized to the bulk value ofTC. The blue data originated from stoichiometric EuO samples. The data for the blue tri- angles is taken from reference [1] and for the blue circles are taken from reference [2]. The red curve repre- sents a function from reference [3]
fitted to the maximum value of TC. The black data points represent the TC(n) dependence of Eu1O0.96 thin films. Figure modified from refer- ence [3].
M. M¨ulleret al. [2] claim that beside the major role of the reduced Eu2+ coordination number in the surface and interface layer a “reduced magnetic ordering at interfaces due to structural and chemical intermixing becomes particularly relevant in the low thickness regime” [2]. Therefore they take “layer-dependent magnetic moments and the effect of non-ideal interfaces” [2], into account.
The magnetization is suppressed especially by the intermixing effect compared to a perfect interface to the substrate. Oxygen deficient sputtered ultra thin films of Eu1O0.96 are investigated by M.
Barbagallo et al. [3]. These films also show a thickness dependent TC(n) behavior in which the Curie temperature of bulk Eu1O0.96 is reached at a layer thickness of about 140 ML EuO(100), see figure 2.6. The degraded magnetization is explained in terms of partially depopulated 4f states
2. Background
upon band bending at the interface to a platinum capping layer [3]. Summarizing this section the Curie temperature TC of ultra thin EuO films is lowered by finite size effects, interface effects and imperfections.
2.2 Mean Field Magnetization
This section summarizes the Weiss model of a ferromagnet and the effect of an external magnetic field on a ferromagnet as explained in the book “Magnetism in Condensed Matter” by S. Blundell [97].
What a ferromagnet and a paramagnet have in common are unpaired electrons resulting in effec- tive magnetic moments per atom. These can be aligned in an external magnetic field resulting in a macroscopic magnetization. The character of a ferromagnet is to align those moments spon- taneously without an applied external magnetic field. All magnetic moments are aligned in one direction, at least within one magnetic domain [97; 98]. This spontaneous magnetization is due to the exchange interactions Jij, as discussed for the case of EuO in section 2.1. The Hamiltonian which describes a ferromagnet in an external magnetic fieldB~ (see Eq. (2.1)) expands to [97]
H =−X
i,j
JijS~iS~j+gµBX
j
S~jB~ (2.2)
where g is the Land´e factor and µB the Bohr magneton. To solve this Hamiltonian a molecular field at the ith site is defined by [97]
B~mf =− 2 gµB
X
j
JijS~j. (2.3)
B~mf is considered as a field in the material that mediates the magnetic order. Because the exchange interaction is replaced by the effective molecular field B~mf, the effective Hamiltonian [97] can be written as
H =g·µB
X
i
S~i·(B~ +B~mf). (2.4) Equation (2.4) has the form of the Hamiltonian of a paramagnet in an applied field B~ +B~mf, therefore the materials magnetization should follow the Brillouin function BJ(y), wherebyy(B,T) is an order parameter depending on temperature and magnetic field. The Brillouin functionBJ(y) emerges from the quantum mechanical description of a paramagnet and can have values between 1 and -1. Therefore the magnetization M of a paramagnetic sample with saturation magnetization MS is given by [97]
M =MS·BJ(y). (2.5)
2.2 Mean Field Magnetization
Figure 2.7: Plot of Brillouin function BJ(y) (curved line) and Eq. (2.7) for different values of T and B=0. Taken from figure 5.2 of refer- ence [97] by courtesy of Oxford University Press.
Figure 2.8: Plot of Brillouin function BJ(y) (curved line) and Eq. (2.7) for different values of T and B6=0. Taken from figure 5.4 of refer- ence [97] by courtesy of Oxford University Press.
The Brillouin function for a paramagnet should not be confused with the Heisenberg mean field magnetization for a ferromagnet. The order parametery is [97]
y= g·µB·J(B+λ·M)
kB·T (2.6)
where λ · M=Bmf with the positive order parameter λ, the Boltzmann constant kB and the to- tal angular momentum J. Equation (2.6) differs from the paramagnetic case with the λ·M term.
Equation (2.6) can be transformed to
M = kB·T ·y g·µB·J·λ−B
λ. (2.7)
Since both equations Eq. (2.5) and Eq. (2.7) give an expression for the magnetizationM(y) as the function of the order parametery the Weiss model of a ferromagnet is solved where Eq. (2.5) equals Eq. (2.7). This equation is solved graphically for each temperatureT. First the graphical solution in the case of zero applied field B=0, (only the mean field B~mf has to be taken into account) is performed in figure 2.7.
Eq. (2.5) and Eq. (2.7) are plotted qualitatively in figure 2.7 vs. the order parameter y for some arbitrary value of the total momentum J and zero applied field B=0. The ferromagnet’s magnetization is the value of M/MS where the plots of Eq. (2.5) and Eq. (2.7) intersect, see figure 2.7. In the case of high temperatures, i.e., T≥TC, no graphical solution can be found and therefore no spontaneous magnetization occurs.
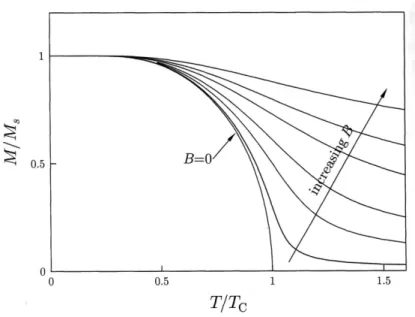
As can be seen in figure 2.8, a non-zero external magnetic field B6=0 in Eq. (2.7) results in a graphical solution ofM withM6=0 for all temperatures because the plots of Eq. (2.7) are shifted to the right in figure 2.8. The larger the applied field the higher the magnetization, of course with the limit of the saturation magnetizationMS. Figure 2.9 shows the effect of an increasing applied field B on the M(T) behavior qualitatively. The magnetic phase transition between the ferromagnetic
2. Background
Figure 2.9: Mean field magnetization vs. tem- perature for various ap- plied magnetic fields B.
Taken from figure 5.5 of reference [97] by cour- tesy of Oxford University Press.
and paramagnetic phase does not occur for B6=0. In other words the magnetization is enhanced by the applied external field, which is important for magnetization measurements in high external fields in chapter 6. Thus experiments to determine the ferromagnetic transition temperature TC have to be performed in zero field in an ideal case, otherwise one has to compensate for the effect of an enhanced magnetization.
2.3 Magneto-Optics
In 1877 J. Kerr first reported on the “rotation of the plane of polarization by reflection from the pole of a magnet” [7], which was the discovery of magneto-optical effects. Magneto-optical [99–105]
materials manifest themself in the change of polarization of polarized light at reflection or trans- mission at a sample [101]. One speaks of the Faraday effect in the geometry of light transmitted through a material and of the Kerr effect in the case of reflection geometry. In this thesis only the Kerr geometry is utilized.
“On a microscopic level the Kerr effect is a consequence of the interaction between the radiation field and the electrons which under exchange lead to magnetization of the solid”[101]. This means that magneto-optical effects originate in materials from the coupling of an elastical electron mo- tion, excited by light, to a static sample magnetization. As a macroscopic approach at optical wavelengths magneto-optical effects can be described in a dielectric tensor ˆ[106]. The matrix ele- mentsij of ˆare introduced for the presence of a magnetic fieldH~ to satisfy the Onsager relations [99; 106]:
ˆ
ij(−H) = ˆ~ ji(H).~ (2.8)
2.3 Magneto-Optics
One can expand ˆto a scalar term 0 and a matrix ˆH [99; 106] with components linear inH:~
ˆ H=
0 12 −13
−12 0 23
13 −23 0
The matrix ˆH is found to be antisymmetric, with non vanishing magneto-optical coefficients on its off diagonal elements. Different indices of refraction for different circular polarizations of light, of which linear polarized light is composed of, are revealed by ˆH. This is the origin of the Kerr rotation of linear polarized light ΘKerr [99]. Since ˆH is supposed to be linear in H~ the Kerr rotation ΘKerr is proportional to the sample magnetization. Additionally a Kerr ellipticity, which is also linear inH, emerges in the case of different absorption probabilities of different circular light~ polarizations [99].
The capability of MOKE is demonstrated in magnetic measurements on bulk samples, thin magnetic layers and even on magnetic monoatomic thin layers [105]. Due to the big magneto-optical effects in EuO, such as a Kerr rotation of 7.1◦ for bulk EuO [6], which is the largest known Kerr effect for any material, the magnetism of EuO has often been investigated by means of MOKE [9; 62; 70; 107–
112; 112–120]. While magneto-optical effects are customarily utilized in data storage media [8] a
“rotation device” device based on the Faraday effect in EuO has also been invented [117].
2. Background
3 The Low Temperature Scanning Tunneling Microscopy Apparatus
The low temperature scanning tunneling microscopy (LT-STM) ultra high vacuum (UHV) setup is constructed by SPS-CreaTec GmbH [121] and consists of three UHV chambers, namely a load lock, a preparation chamber with a base pressure of 1.0×10⁻¹⁰ mbar and an STM chamber with a Cryovac helium bath cryostat. The vacuum in the UHV system is generated with turbo molecular pumps, ion getter pumps, titanium sublimation pumps and cooling traps.
Several types of sample holders are available at the LT-STM system for processing different types of samples, for instance metal single crystals and wafer samples. Details on the sample holders are presented in section 3.1. In the following the equipment and modifications of the UHV system are explained.
The load lock serves for the transfer of sample holders into / out of the preparation chamber.
It has been improved by an extended sample transfer rod which now can carry two sample holders instead of one in the original design in order to allow more efficient sample transfers.
In the preparation chamber sample holders can be stored in a sample storage. The prepara- tion chamber is equipped with the following devices for sample preparation and characterization:
A four pocket electron beam (e-beam) evaporator, a quartz microbalance, an ion sputter gun, a hydrogen atomic beam source (HABS), gas supply pipes, a quadrupole mass spectrometer (QMS), and a multi channel plate low energy electron diffraction (MCP-LEED) device. Knudsen effusion cells are added to the preparation chamber within the work of this thesis. As the most important upgrade a home-built magneto-optical Kerr effect (MOKE) apparatus is added, as described in the next chapter. The samples can be moved through the UHV system with a manipulator. Details on the manipulator are explained in section 3.2.
The in-situ preparation of STM tips can be performed in the preparation chamber by ion bom- bardment and annealing. Therefore, a circular shaped filament formed from 0.18 mm tungsten wire is added at the downside of the sample storage. The STM tips are positioned in the center of the filament and annealed with it. The circular shape is established to supply the power of the filament uniformly to the tip during annealing.
The whole STM and STS measurements presented in this thesis are performed with a Besocke beetle type STM. The STM is mounted electrically isolated on three springs at the bottom side
3. The Low Temperature Scanning Tunneling Microscopy Apparatus
of the helium bath cryostat and is surrounded by a radiation shield to avoid heating by thermal radiation. The STM is stabilized at 5.3 K at normal operation [122]. The whole STM, including the sample holder, can be heated up to 300 K during cooling by reverse biasing a Zener diode on the STM base plate. In thermal equilibrium of the STM a very low lateral and vertical drift of the STM tip with respect to the sample allows spectroscopy measurements for hours. Since the helium cooled cryostat acts as an effective cooling trap the sample surfaces are found to stay free from atomic adsorbates for weeks.
Nonmagnetic tungsten STM tips are used as local probes. The preparation of these STM tips is explained in great detail in section A of the appendix. STM and STS measurements are performed at 5.3 K, if not stated otherwise. The bias voltage UBias is applied to the sample via the thermo- couple wires which are spot welded to the metal single crystal. The STM tip is on ground potential.
By applying a positive voltage to the sample electrons tunnel from the tip into unoccupied sample states. The tunneling current is amplified by a Femto DLPCA-200 preamplifier, used at 109 gain in its low noise mode, and converted to a direct current (DC) signal in the range of -10 V to +10 V.
The output signal of the preamplifier is adjusted to zero out of tunneling contact. STM images and STS maps are measured in constant current mode if not stated otherwise and are analyzed and post processed using WSxM [123].
An excellent vibration isolation and damping of the STM is crucial. Therefore, the whole LT-STM setup was first hung on the ceiling with large metal springs. Since the setup has to be aligned exactly horizontal, but the center of mass of the whole setup changes with the filling level of the He bath cryostat, we changed the external damping system to pneumatic laminar flow vibration isolator feet. Therefore the screed has been cut away from the lab floor and the damping feet are mounted directly on the concrete.
3.1 Sample Holders and Tip Tool
The sample holders of the LT-STM system can carry different types of samples. All kinds of sample holders have the same type of base body in common, but differ in buildups. Here we present a metal sample holder and an electron beam (e-beam) sample holder. A sample heating and a type K thermocouple are integrated in both types of sample holders. Since the utilized temperature sensor has to cover the whole temperature range from low temperatures (cooling with liquid helium) for MOKE measurements on EuO to high temperatures (1500 K) for substrate preparation a type K thermocouple is the tool of choice. The disadvantage of a type K thermocouple is its poor resolution and a small thermo voltage in the low temperature range compared to a Zener diode.
During the technical part of this work one e-beam and two metal sample holders have been build up.
Some extrusions have been milled away on the sample holders base bodies (compare figure E.10) to make it fit into the slot of the MOKE-magnet (see Sec. 4.2). All parts of the sample holders, which
3.1 Sample Holders and Tip Tool
a b
c d
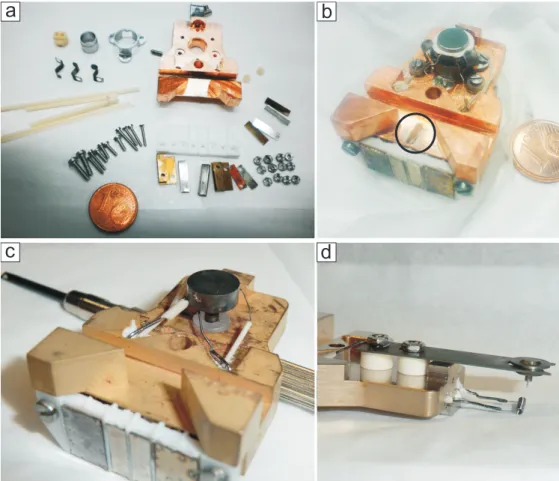
Figure 3.1: a) Photograph the home-built e-beam sample holder parts before assembly. b) Assembled e-beam sample holder with an Ir(111) single crystal mounted. An additional contact is added to the sample holder (marked by black circle). c) Picture of metal sample holder without a sample. d) Photo of tip tool with tip heating station and mounted tip holder.
get hot during sample preparation, have been degassed before assembling in UHV. Two standard metal sample holders are assembled and modified. The sample holders are optimized by home-built contact plates which allow the feeding of a type K thermocouple to the sample without cut. These metal sample holders serve for the investigation of low melting metal single crystals such as Ni(100) and Au(111). Temperatures up to 1170 K are achieved by applying 6.0 V and up to 3.0 A to the used HeatWave UHV button heater. One of such sample holders is displayed in figure 3.1 c). The sample is put directly on the button heater and attached to it with tungsten clamps. The heater is clamped to the sample holder body between two sapphire U-profiles for electrical isolation and for reasons of thermal isolation of the sample surroundings at high temperatures and a good thermal connection to the helium vaporization cryostat (of the manipulator) at low temperatures.
For preparations at higher temperatures an e-beam sample holder, as displayed in figure 3.1 a) and b), is also set up. (Parts and technical drawing for this sample holder were developed previously in our group). The e-beam sample holder design has been optimized by means of an additional contact (figure 3.1 b)) putting the sample on ground potential if the sample holder is grabbed with the manipulator, but leaves the sample isolated when it is put into the STM. This enables us to use
3. The Low Temperature Scanning Tunneling Microscopy Apparatus
the e-beam heating and measure the sample temperature via the type K thermocouple at the same time as needed for the preparation of EuO films. Also the contact plate of the e-beam sample holder is supplemented by type K thermocouple contacts and optimized to fit into the slit of the MOKE-magnet yoke. A cylindrical filament is handmade out of 0.13 mm tungsten-rhenium wire.
Due to its small cross section low filament currents of 1.80 A are sufficient to operate the filament in the sense of e-beam heating, which is reasonable because the supply cables on the manipulator side are only desired to carry a maximum current of 3.5 A. Sapphire balls with a diameter of 1.0 mm are used to isolate the sample for the same reasons as explained above. We achieved temperatures of 1500 K easily with this sample holder. When cooling the sample holder with the vaporization cryostat of the manipulator a sample temperature down to 50 K can be reached with the e-beam sample holder and 44 K with the metal sample holder. These lowest achievable temperatures are measured after optimization and calibration of the thermocouple the in June 2012.
A tip tool serves to transfer and exchange STM tips into or out of the STM. A special tip tool with an integrated filament allows for the annealing of the STM tips directly at the tip tool by electron beam heating, see figure 3.1 d). This serves as an alternative tip heating stage to the filament mounted on the downside of the sample storage. A typical tungsten tip after annealing with the tip tool is presented in the appendix (figure A.5 a)). The tip annealing with this tool works well even though its filament is not circular shaped.
3.2 The Manipulator
Figure 3.2: Photograph of the front of the manipulator head showing modified contact springs. The contact springs are the counter- piece to the contact plate of the sample holders.
Type K thermocouple wires are spot welded
onto the CuBe springs.
4mm
The sample holders (see previous section) can be used with a VAB [124] PM 25 - 500 precision manipulator, which is mounted to the preparation chamber. Cooling down can be performed with a type HVK-STM helium vaporization cryostat. The manipulator enables the transfer, movement and electrical contact of sample holders. It is delivered by SPS-CreaTec GmbH [121] with six CuBe
3.3 The Molecular Beam Epitaxy Station
springs which serve as electrical contacts to the sample holder for the sample heating (integrated on each sample holder) and for measurements of the sample temperature. The middle contacts number three and number four, as marked by the box in figure 3.2, serve as contacts for the type K thermocouple. An Alumel (Ni95Mg2Al2Si1) and a Chromel (Ni90Cr10) wire was originally fed to these springs but did not go on continuously over the springs to the sample. This configuration is only suitable for temperature measurements if there is no temperature gradient at the contact springs, since otherwise also a thermovoltage occurs at the contact springs. As a consequence wrong temperature measurements occurred. This problem is technically solved in December 2010 by spot welding type K thermocouple wires onto the contact springs as visualized in figure 3.2. With this modification the thermocouple wires are fed to the sample without cut-off. As an incidental remark the Alumel wire must not be mistaken with a pure nickel wire which causes an error of 10 % in the high temperature measurements as shown in work of D. Pollock [125].
In June 2012 the contacts of the manipulator are re-designed in a mechanical and electrical more sophisticated way by S. Runte.
3.3 The Molecular Beam Epitaxy Station
(1)
(2) (3)
(4) (5) (6)
(8) (7)
(9)
(10)
(11) (12)
(14)
(13)
(2) e-beam Evaporator
c (1) Knudsen ell
(Gadolinium)
( )O
xygen supp
ly 4
(5) E thylen
supply e (6) Microbalance
Sample on manipulator Linear translation stage
a b
e-e- e-
0° -24°
-48°
24°
48°
72°
(3) Knudsen cell (Europium)
Figure 3.3: a) Sketch of the MBE station in the preparation chamber of the LT-STM system. The sketch corresponds to the A-A cut of the constructional drawing in figure E.32. b) Labeled photograph of the preparation chamber taken along the chamber’s long axis. The following devices are mounted to the LT-STM preparation chamber as labeled by numbers: (1) Knudsen cell (gadolinium) WEZ40-20-16-KS, (2) e-beam evaporator Specs EBE-4, (3) Knudsen cell (europium) NTEZ40-2-16-KS, (4) oxygen supply pipe, (5) ethylene supply pipe, (6) Sycon [126] STM-100/MF quartz microbalance, (7) PrismaTM QMS 200, (8) Kremer IS 10 ion sputter gun, (9) HABS-40-A, (10) Bayard Alpert gauge, (11) sample storage, (12) home-built electromagnet, (13) OCI MCP LEED BDL800IR, and (14) a VAT valve to the STM chamber.
3. The Low Temperature Scanning Tunneling Microscopy Apparatus
Samples investigated in this thesis are grown in-situ by chemical vapor deposition (CVD) and molecular beam epitaxy (MBE) in the preparation chamber. A set of DN40CF flanges equipped with evaporators, gas inlet pipes and a quartz microbalance are arranged concentrically around the manipulator axis. This geometrical arrangement allows the simultaneous deposition of different materials as visualized in figure 3.3. For the growth of thin doped, or stoichiometric films of EuO two Knudsen effusion cells and two gas inlets are mounted to the chamber, see figure 3.3. High purity europium (Eu) from the Ames laboratory [127] is evaporated from an Al2O3 crucible at temperatures between TKnudsen=670 K and 710 K in a low temperature effusion cell NTEZ40-2- 16-KS made by the Dr. Eberl MBE Komponenten GmbH [128]. The Knudsen cell including its crucible and Eu wrapped in tantalum were degassed before at 870 K in UHV. The base pressure of the LT-STM preparation chamber does not rise above 1.0×10⁻¹⁰ mbar during evaporation of europium. The cell is mounted in a distance of 10 cm to the sample and evaporation rates around 1.0 ˚A Eu/min are reached at TKnudsen≈700 K. The dopant gadolinium (Gd) is evaporated in the same way as Eu, but at evaporation temperatures from 1350 K to 1420 K from a high temperature effusion cell WEZ40-2-16-KS from an Al2O3 crucible. Gd doped samples are not presented in this thesis, but the evaporator is listed here for the sake of completeness. The base pressure of the preparation chamber rises up to 5.0×10⁻¹⁰ mbar at usage of the high temperature effusion cell.
The distance to the sample amounts to 14 cm. The molecular beams of both Knudsen cells enclose an angle of 72◦, as can be seen in the sketch. The evaporation rates of both cells are measured with a quartz microbalance STM-100/MF from Sycon instruments [126] which can be moved to the later sample position prior to film growth with help of a linear translation stage. So the evaporation rates are measured directly without further calculations. Molecular oxygen (O2) is dosed with help of a leak valve and leaded via a gas inlet pipe to the sample, which is positioned in front of the pipe. The O2 partial pressure pO2 in the preparation chamber is checked during growth with a Pfeiffer PrismaTM QMS 200. The QMS is always used with following settings to control pO2: a dwell time of 0.2 s, a resolution of 50 an SEM voltage of 1.4 kV and mass of 31.81 amu.
The QMS signal, in numbers of IQMS−O2, has to be calibrated to the local molecular oxygen pressure pO2 at the sample position. A first attempt was done by the adsorption of O2 on Ni(100) at 400 K. Molecular oxygen dissociates at the metallic Ni(100) surface and forms oxygen adsorbate superstructures, namely a p(2 ×2) superstructure at low O2 doses which converts to a c(2 × 2) superstructure at higher O2 doses [129]. A more precise calibration followed by the number of oxygen atoms in an EuO film, under the assumption that all oxygen reacts (with europium) to EuO.
Thereby the gas inlet pipe was found to enhance the local pressure at the sample by a factor of 85±10 compared to the background pressure. A oxygen background QMS signal of 1.5×10⁻¹⁰IQMS−O2
(always used to grow EuO) corresponds to a local oxygen pressure of pO2 = 1.6×10⁻⁸ mbar at the sample.
The ethylene dosing pipe is of the same geometrical dimensions as the oxygen one and therefore also
3.3 The Molecular Beam Epitaxy Station
its enhancement factor is the same. The mass spectrometer signal of the ethylene partial pressure is IQMS−Ethylene. To utilize IQMS−Ethylene as a process parameter one must note that the following mass spectrometer settings are used for measuring the ethylene signal: mass of 28 amu, an SEM voltage of 1400 V, a dwell time of 0.2 s, and a resolution of 10.
The chamber pressure is decreased quickly after dosing gases by connecting an ion getter pump with an integrated liquid nitrogen filled cooling trap to the preparation chamber. The ion getter pump is never connected to the chamber during dosing gases.
Last a SpecsTMEBE-4 four pocket e-beam evaporator is mounted to the MBE station. It serves for the evaporation of aluminum (from a molybdenum crucible with a boron nitride liner) as a capping layer for EuO films or for the evaporation of cobalt for example.
3. The Low Temperature Scanning Tunneling Microscopy Apparatus
4 Development of a MOKE Setup
eN L H
e as er
Glan-Thompson-prism analyzer
Convex lens
Retardation plate
Interference filters Photo transistor
Glan-Thompson-prism polarizer
Reflective ferromagnetic sample in changing magnetic field B
BOP -36V to 36V
Agilent Multimeter PC
B M
Electromagnet
Channels through magnet Linea
rly p olarized
light pola
rizatio n la
ne f x ed p
i
Light source Detector
UHV
Figure 4.1: Arrangement of the longitudinal MOKE setup. The figure is assembled with drawings and with photographs of the used optical components in their mechanical mountings. The construction aims on the determination of a samples magnetic properties under UHV conditions.
The main technical project of this thesis is the construction, realization, and optimization of a magneto-optical Kerr effect (MOKE) setup. This setup investigates the magnetic properties of samples by the magneto-optical Kerr effect on linear polarized light: the change in polarization upon reflection on a sample is measured. The project contains the development of different parts:
a stiff holder for a HeNe laser light source, a electromagnet for applying magnetic fields to a sample, a detector which can resolve the rotation of linear polarized light with high sensitivity and a computer software to support MOKE measurements and data logging. The global arrangement of the setup is visualized in figure 4.1. The base design of the setup is inspired by MOKE instruments of H. P. Oepen [130]. The guiding principle is to put as many components as possible outside the vacuum chamber, namely the laser, coils of the magnet and the detector with all its optical components. These components are mounted onto DN40CF view ports. Consequently the magnetic flux generated by the coils of the magnet has to be fed through into UHV with help of a yoke (see Sec. 4.2), which is welded into a flange.
4. Development of a MOKE Setup
a b
c d
La se r De t ct or
e Magnet
St f i fen er
o Y e k
p M an i
ula tor
Figure 4.2: a) The LT-STM preparation chamber with the laser mounted on the left side, the magnet in the middle and the MOKE detector to the right. The lasers optical path is indicated by the red lines.
b) View into the preparation chamber with a sample in the slot of the magnet and illuminated by the laser beam, which passes through the channels drilled into the yoke.
All parts of the MOKE setup, except for the yoke of the magnet, are constructed from nonmagnetic materials, i.e., aluminum or 1.4429 ESU steel. Also special non-magnetic UHV view ports with Fused Silica Spectrosil 2000R and a tantalum glass-to-metal sealing instead of a magnetic KovarR sealing have been used for the MOKE setup. In magnetic view ports a Faraday rotation in the order of 0.1 mrad at maximum coil current superimposes the sample’s Kerr signal. The improvement by nonmagnetic view ports compared to normal UHV view ports is shown experimentally in section 4.6.
The MOKE setup is designed and optimized to be embedded into the preparation chamber of the LT-STM apparatus. It is mounted to the B-B cut of the design drawing in figure E.32 displayed in the appendix. The DN150CF flange in the cut is designated to host the magnet and the DN40CF flanges to host view ports for inlet and outlet of the laser beam. The geometry of the available flanges at the UHV chamber predetermine an incidence angle of 45◦ of the light onto the sample.
The geometry of the cross section of the LT-STM chamber was replicated using a massive aluminum construction as a development and test stage, as can be seen in figure 4.5 and figure E.9. This test setup is later developed to a separate ambient conditions MOKE setup.
4.1 The Light Source
The magneto-optical Kerr effect causes a rotation of the polarization vectors of light upon reflection at a ferromagnetic sample. Therefore, a source of linear polarized light with a spatially fixed polarization plane and a constant intensity is needed. Since the magneto-optical Kerr effect in EuO is strong for red light [111] a Melles Griot [131] 25-LHP-151-230 HeNe laser is chosen as suitable the light source. This laser emits linear polarized light with an extinction ration of 1:500,
4.2 The Magnet
meaning that every 500th emitted photon shows the wrong polarization. A high resolution and a very low noise level are desired for the MOKE measurements of this thesis. Therefore a high quality Glan-Thomson prism manufactured by Halle Nachfolger [132] with an extinction ratio of 106 is used to highly polarize the light of the laser, which is emitted to the sample. The emitted power of the laser amounts to 5 mW in thermal equilibrium, i.e., after warm up of the laser. Since mechanical vibrations of the laser have to be avoided a stiff mounting of the laser to a DN40CF view port is constructed. The laser holder construction allows for mechanical adjustments on the alignment of the laser and the polarizer prism at the same time. Also the laser to sample distance is kept as short as possible to reduce the influence of mechanical vibrations by a leverage effect.
Upon test measurements on a non magnetic reflective aluminum mirror measurement artifacts are found, which are caused by stray fields of the MOKE-magnet (see Sec. 4.2) on the laser. These artifacts (data not presented) are caused by a Faraday rotation which occurs in the head of the laser. The stray fields are in the order of 1.6 mT. Only stray fields of 1.0 mT are acceptable for proper operation of the laser. As a technical solution a µ-metal shielding tube is built to fully surround the laser, except for a 2 mm hole for the out coming light beam and a feed through for the power cable. Hall probe measurements reveal a shielding of magnetic fields by a factor of 20 inside the µ-metal tube, which turned out to be sufficient to eliminate stray field induced effects on the emitted laser light.
At this point it should be mentioned that the polarization plane of the laser light needs to be adjusted exactly parallel, or perpendicular to the plane of incidence, otherwise one measures some kind of ellipsometry instead of MOKE.
4.2 The Magnet
The magnet is needed to generate constant magnetic fluxes of 0.1 T. This is sufficient to drive most ferromagnets into the magnetic saturation. The magnetic fields are created by two coils. We decided to leave the coils out of the vacuum to cool them with the ambient air. The magnetic flux is carried to the sample by an ARMCO pure iron yoke as presented in figure E.1. The yoke is composed of two legs, two pole shoes and a connection part between the legs. Taking into account the available flanges on the UHV chamber for the laser path and the geometry of the manipulator leads to the realized yoke design. The sample is put in the yokes slit, whose width was first designed to put the utilized sample holders (see figure 3.1) horizontally and vertically inside to measure the longitudinal as well as the polar Kerr effect. Channels are drilled through the yoke for the optical path of the laser light (which penetrates to the sample and is reflected to the detector). Calculations taking into account the yokes susceptibility, a slit dimension of 32 mm and the length of the yoke legs are performed to determine the number of windings on each coil to reach the desired magnetic field of 0.1 T. A current of 6 A running through two coils with about
4. Development of a MOKE Setup
a b
c
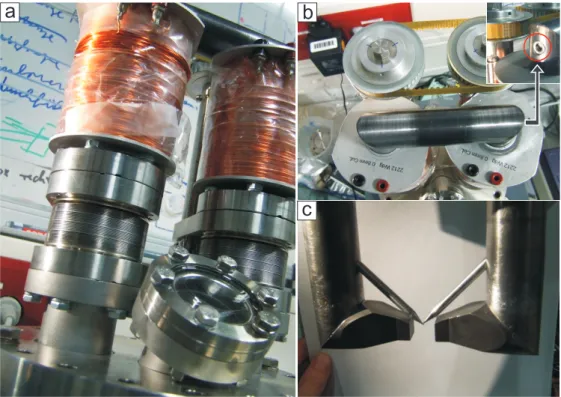
Figure 4.3: Photographs of the electromagnet of the UHV MOKE setup. a) Ambient side of the magnet.
Displayed are the coils, linear translation shifts and the top side of the DN15CF host flange. b) Top view on the magnets ambient side. The drive belt which synchronizes the motion of both yoke legs is visible. Red circle in inset: Stiffening of the yoke by screw connection. c) UHV side of the magnet with the sample slot of 14 mm width. Two aluminum rods, representing the laser beam for demonstration purpose, are stuck through the channels for the laser path and demonstrate where the laser hits the sample. The pole shoes are attached by a tungsten inert gas weld spot.
1500 windings each should generate the desired magnetic flux. We decided to but as much windings as possible on the coils winding former, namely 2212. Both coils have the same winding direction.
It turned out that the envisaged magnetic flux was not reached because the yoke is magnetically saturated by the coils priorly. The reached magnetic flux with a slit of 32 mm mounting the pole shoes displayed in figure E.4 just amounts to 0.043 T. To enhance the magnetic flux new pole shoes, which result in a smaller slit width of 14 mm are designed. Due to this restriction the used sample holders can only be put into the magnet horizontally, so only the longitudinal Kerr effect can be measured. More detailed considerations about the magnet are worked out in the bachelor thesis of A. Jacobi [133]. The pole shoe design, as presented in figure E.5, is rather complex to let the optical path undisturbed, but to generate spatially homogeneous magnetic fields. Finally with this configuration magnetic fluxes of 0.117 T (measured with a hall probe) are obtained. Calibration curves of the desired magnetic flux B vs. the coil current I are recorded for different maximum coil currents, as presented in figure 4.4. The magnetic fluxB is found to be spatially homogeneous in the slit middle, it varies about 1 mT per millimeter.
The sample must be positioned in the center axis of the UHV chamber to utilize certain flanges for MOKE measurements, but since the flanges used for the MOKE devices are on the same UHV
4.3 The Detector
- 6 - 4 - 2 0 2 4 6
- 1 2 0 - 8 0 - 4 0
0
4 0 8 0 1 2 0
- 1 . 0 - 0 . 5 0 . 0 0 . 5 1 . 0
- 4 0
0
4 0
Magnetic field (mT)
C o i l c u r r e n t ( A )
- 1 0 1
- 4 0
0
4 0
Magnetic field (mT)
C o i l c u r r e n t ( A )
m a x . 6 . 0 A m a x . 0 . 5 A m a x . 0 . 2 A
Magnetic field (mT)
C o i l c u r r e n t ( A )
Figure 4.4: Magnetic fieldBvs. coil currentIcharacteristic for the UHV-MOKE magnet and two coils with 2212 coil windings each, measured with a hall probe in the middle of the 14 mm wide magnet slot.
The inset shows a zoom in.
chamber cross section as the LEED device and the load lock the magnet has to be moveable.
Therefore VAB linear translation shifts LDK40-100 are used, as is visualized in figure 4.3 a). As one translation module is used for each yoke leg and the modules have some clearance against lateral twisting the yoke needed some extra stiffener. So the yoke legs are connected on the vacuum side by a thick aluminum bar, see figure 4.2 b) and the out of vacuum ARMCO iron cross part is connected with screws to the legs, see figure 4.3 b). Of course the drive of the two translation stages must be synchronized, as realized by a drive belt. The pole shoes are each connected by two welding spots to the yokes legs and adjusted previously exactly with help of installation tools. The exact alignment of all yoke components is important to let the optical path of the laser undisturbed.
The right alignment is checked with help of aluminum rods which have to meet in the sample slot of the magnet, see figure 4.3 c).
4.3 The Detector
After reflection at a sample’s surface the light beam shines into the detector, which consists of an active NPN silicon photo transistor (PT) BPX 38 operated with a low-noise FET input operational amplifier OPA657 and a high quality Glan-Thomson prism, with an extinction ratio of 106 as an analyzer. As the PT is just able to detect a signal intensity, but the aim is to detect a rotation in