Individuals, Teams and Organizations:
A multilevel analysis of individual, team and organizational level factors on performance
Inauguraldissertation zur
Erlangung des Doktorgrades der
Wirtschafts- und Sozialwissenschaftlichen Fakultät der
Universität zu Köln
2016
vorgelegt von
M.Sc. Tessa Karcisky aus
Osnabrück
Referent: Jun.-Prof. Dr. Thorsten Semrau
Korreferent: Univ.-Prof. Dr. Mark Ebers
Tag der Promotion: 24.01.2017
I would like to thank Prof. Dr. Thorsten Semrau, my dissertation supervisor, for his profound knowledge as well as his guidance and support. Also, I am greatly indebted to Prof. Dr. Mark Ebers for serving as the second reviewer of my thesis.
In addition, I want to thank my co-authors Torsten Biemann and Armita Atabaki as well as my colleagues for providing guidance and valuable feedback.
Furthermore, I would like to thank my parents Karin and Ulrich Karcisky as well as my sister Nina Karcisky for their support and encouragement.
Finally, my deepest thanks go to my future husband Daniel Willmann. His indefinite support and commitment to me throughout the process encouraged me to finish the dissertation. Without him this thesis would not exist.
You are the most important person in my life.
Table of Contents
1
Introduction ... 1
1.1
Organizational Behavior Research ... 2
1.2
Multilevel Organizational Behavior Research ... 8
1.3
Thesis Outline ... 10
2
Too Much of a Good Thing? Risk Propensity, Need For Achievement and Performance among Franchisees ... 14
2.1
Introduction ... 14
2.2
Theory and Hypotheses ... 16
2.2.1
Risk Propensity and Franchisees’ Performance ... 18
2.2.2
Franchisees’ Need for Achievement and Performance ... 19
2.3
Sample and Method ... 22
2.3.1
Sample ... 22
2.3.2
Measures ... 23
2.3.3
Analytical Approach ... 26
2.4
Results ... 27
2.5
Discussion ... 31
2.6
Limitations and Avenues for Future Research ... 34
2.7
Conclusion ... 34
3
Taking Empowerment to a Higher Level: A Three-Level Model of Psychological Empowerment and Employee Performance ... 35
3.1
Introduction ... 35
3.2
Theory and Hypotheses ... 36
3.2.1
Individual-Level Psychological Empowerment and Employee Performance ... 38
3.2.2
Team-Level Psychological Empowerment and Employee Performance ... 38
3.2.3
Organizational-Level Psychological Empowerment and Employee Performance ... 40
3.3
Method ... 41
3.3.1
Sample and Procedure ... 41
3.3.2
Measures ... 42
3.3.3
Analytical Approach ... 44
3.4
Results ... 44
3.5
Discussion ... 47
3.5.1
Theoretical and Practical Implications ... 48
3.5.2
Limitations and Research Directions ... 49
3.6
Conclusion ... 50
4
Team Conscientiousness Diversity and Team Performance – The Moderating Effect of Empowering Leadership ... 51
4.1
Introduction ... 51
4.2
Theory and Hypotheses ... 55
4.2.1
Diversity in Team Conscientiousness and Team Performance ... 57
4.2.2
Moderating Effect of Leader’s Empowering Leadership ... 60
4.3
Method ... 62
4.3.1
Sample and Procedure ... 62
4.3.2
Measures ... 63
4.5
Discussion ... 69
4.5.1
Theoretical and Practical Implications ... 72
4.5.2
Limitations and Research Directions ... 74
4.6
Conclusion ... 74
References ... 76
List of Tables
Table 2.1: Means, Standard Deviations, and Correlations ... 28
Table 2.2: Results from Multilevel Analyses ... 29
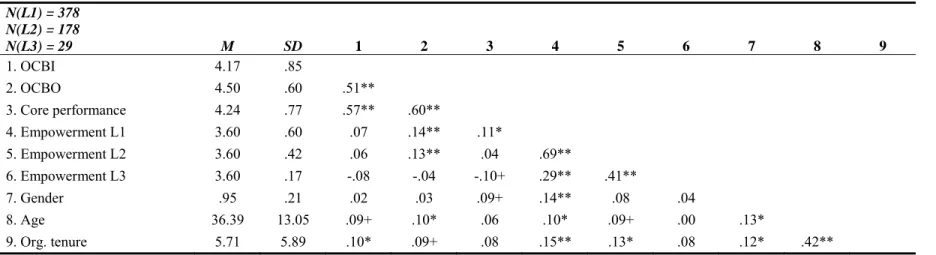
Table 3.1: Means, Standard Deviations, and Correlations ... 45
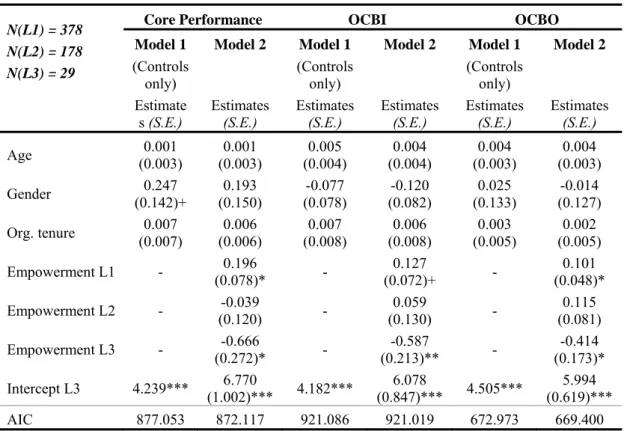
Table 3.2: Results from Multilevel Analyses ... 46
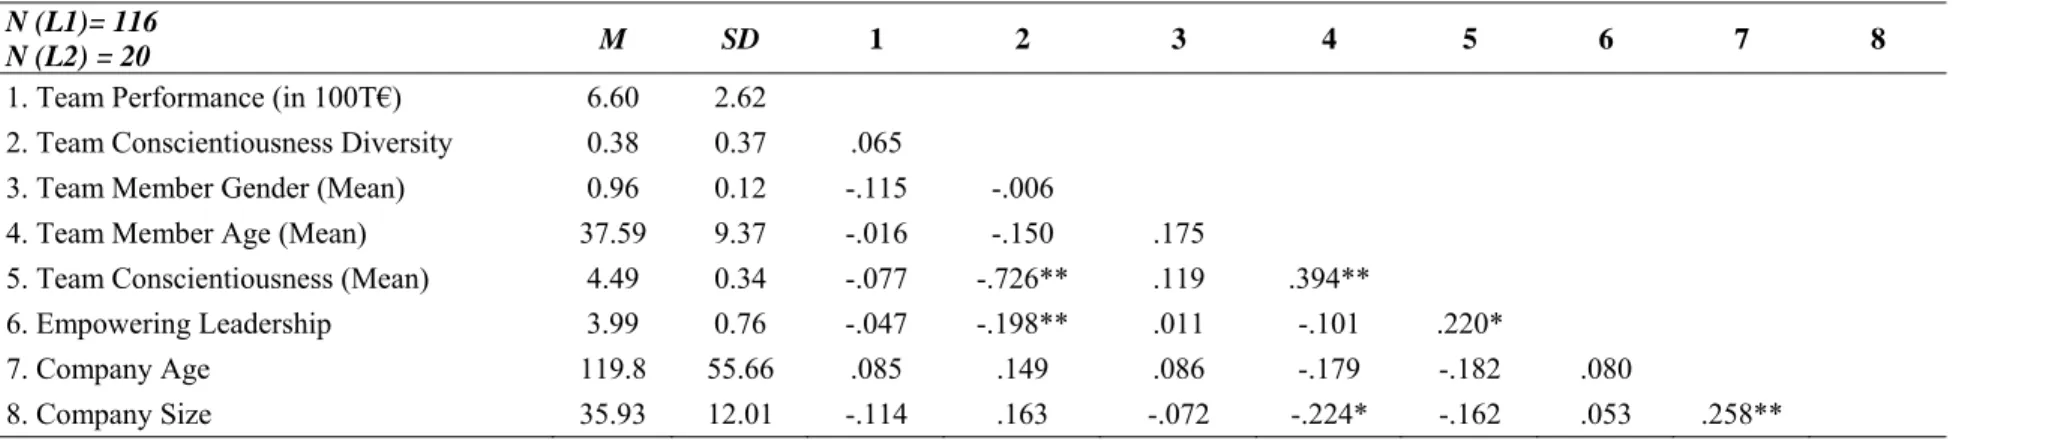
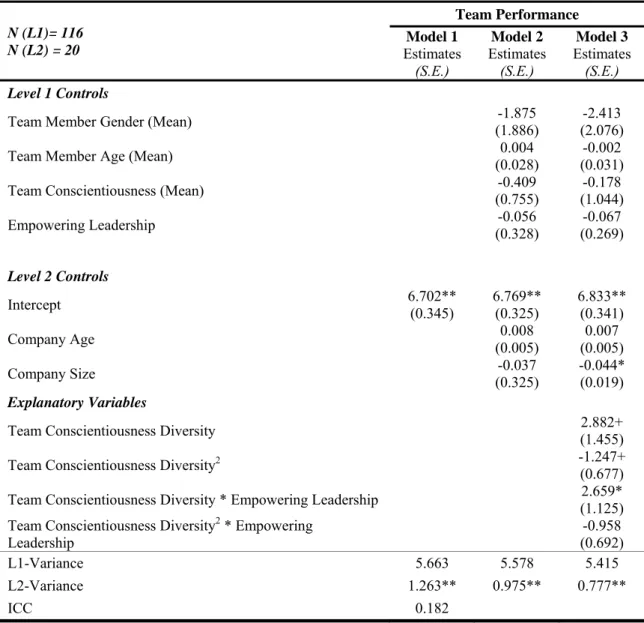
Table 4.1: Means, Standard Deviations, and Correlations ... 66
Table 4.2: Results from Multilevel Analyses ... 67
Table 4.3: Results from Simple Slope Analyses for Hypothesis 2 ... 68
Figure 1.1: Input-Process-Outcome Model in Organizational Behavior Research ... 3
Figure 1.2: Input-Process-Outcome Model – Thesis Overview ... 11
Figure 2.1: Risk Propensity and Franchisees’ Performance ... 30
Figure 2.2: Need for Achievement and Franchisees’ Financial Performance ... 31
Figure 2.3: Need for Achievement and Franchisees’ Performance ... 31
Figure 4.1: Team Conscientiousness Diversity and Team Performance moderated by
Empowering Leadership ... 69
1 Introduction
This thesis deals with the relationships between individual, team, and organizational level factors and performance using multilevel analyses. The thesis consists of four chapters. The purpose of this first chapter is to provide a brief overview of the three determinants of organizational behavior (inputs, processes and outcomes) at three key levels of analysis (micro, meso and macro level) and to highlight multilevel organizational behavior analysis. Moreover, a summary for each study is provided. The following three chapters present my studies.
The manuscript underlying Chapter 2 is an article authored by me and my coauthors Thorsten Semrau and Torsten Biemann. Both coauthors contributed to the data collection. The manuscript is prepared by Thorsten Semrau and me. Torsten Biemann commented on various versions of the manuscript. It was presented at the Annual Meeting Academy of Management 2014 in Philadelphia, USA and nominated as best paper. A previous version was published in the Academy of Management Proceedings (Vol. 2014, No. 1, p. 13573). The manuscript is prepared for submission to the Journal of Work and Organizational Psychology.
The manuscript underlying Chapter 3 is currently under review at the Journal of Applied Psychology and coauthored by Armita Atabaki, Thorsten Semrau and Torsten Biemann. The data collection was solely done by me. Armita Atabaki and I prepared the manuscript. Moreover, Thorsten Semrau contributed to the theoretical idea and conception and Torsten Biemann provided guidance on the methodological approach.
An earlier version was presented at the Academy of Management 2015 in Vancouver,
Canada.
The manuscript underlying Chapter 4 is a single-author paper and prepared for submission to the Journal of Applied Psychology. Guidance and comments were provided by Thorsten Semrau.
1.1 Organizational Behavior Research
Organizational behavior is “a field of study that investigates the impact that individuals, groups, and structure have on behavior within organizations for the purpose of applying such knowledge toward improving an organization's effectiveness"
(Robbins, 2001, p. 6). Practitioners as well as researchers are mostly interested in understanding which and how factors from individuals, groups and organizations drive processes that in turn affect performance (Colquitt, LePine, & Wesson, 2015;
Huczynski & Buchanan, 2013; Robbins, Judge, & Campbell, 2013).
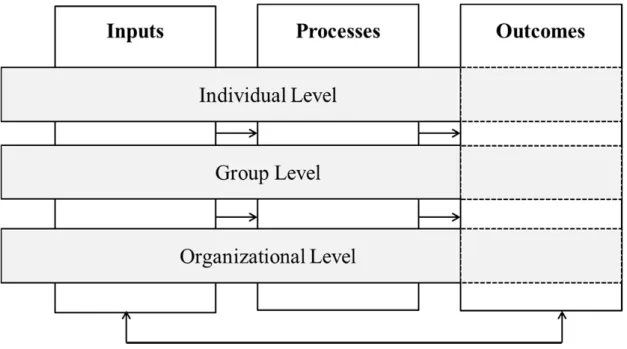
Organizational behavior can be classified by the Input-Process-Outcomes model
(Mathieu, Maynard, Rapp, & Gilson, 2008; Robbins et al., 2013), which describes the
linkages in organizational behavior through inputs, processes and outcomes (Mathieu et
al., 2008). These three variables exist at three levels: the micro level relating to
individuals, the meso level relating to groups/teams and the macro level relating to
organizations (Robbins et al., 2013). Individual, team and organizational inputs drive
and influence specific processes, which in turn influence outcomes, such as individual,
team and organizational performance (Colquitt et al., 2015; Huczynski & Buchanan,
2013; Mathieu et al., 2008). First, inputs are antecedent factors, for example personality
at the micro/individual level and structure at the macro/organizational level, that drive
specific processes (Colquitt et al., 2015). Second, processes are the linkages between
inputs and outcomes. Example at the micro/individual level are motivation and decision
making, and at the meso/group level communication and conflict. Third, outcomes, the
variables organizational behavior research aims to explain and predict, result from processes initiated by inputs. Examples are individual performance at the micro/individual level and team performance at the meso/group level (Robbins et al., 2013). With respect to the Input-Process-Outcomes model, it is important to consider that, first, outcomes may also influence inputs. Second, individual, team and organizational inputs as well as processes do not only influence outcomes at the respective individual, team and organizational levels but may also have an impact on lower or higher level outcomes (visualized by the dotted line in Figure 1.1). In the following the three key levels of analysis in organizational behavior are explained in more detail.
Figure 1.1: Input-Process-Outcome Model in Organizational Behavior Research Own representation based on Mathieu et al. (2008, p. 413); Robbins et al. (2013, p. 25).
Organizational Behavior at the Micro Level
The organizational behavior at the micro level relates to inputs and processes at
the individual level that affect performance (Robbins et al., 2013). Individual inputs
refer to characteristics defined as “structures and propensities inside people that explain
their characteristic patterns of thought, emotion, and behavior” (Colquitt et al., 2015, p.
278). These characteristics, such as personality and values, result in specific thinking processes, for example motivation or perception, that in turn influence performance (Anderson, Spataro, & Flynn, 2008; Barrick & Mount, 1991; Cable & DeRue, 2002;
Wright & Nishii, in press).
Values and interests are the basis for understanding people’s attitudes and motivation because they influence perception and “convey what is important to people in their lives” (Bardi, Lee, Hofmann-Towfigh, & Soutar, 2009, p. 913). For example, Van Iddekinge, Putka, and Campbell (2011) found support for a positive relationship between interests and job performance. Another important individual characteristic having a major impact on performance is the employee’s personality. “Personality encompasses a person’s relatively stable feelings, thoughts, and behavioral patterns”
(Carpenter, Bauer, & Erdogan, 2010, p. 70). Personality traits have been investigated by scholars for many years as predictors of work performance (Barrick & Mount, 1991;
Carter et al., 2014; Hough, 1998). Researchers explained differences in employees’
performance based on differences in personality traits. Findings suggest that personality traits are related to various work-related outcomes such as job performance (Barrick &
Mount, 1991; Bono & Judge, 2004). The Big Five Model is the most widely used model
to evaluate personality traits (Barrick & Mount, 1991). It assumes that the five basic
dimensions: neuroticism, conscientiousness, agreeableness, openness to experience and
extraversion, underline most human personalities (Costa & McCrae, 1992). In this
regard, Judge and Ilies (2002) found neuroticism, that is being emotionally unstable and
tending to be anxious, to be a valid predictor of performance motivation; whereas
openness, being open-minded with respect to new ideas and thoughts, and extraversion,
being talkative and likely to socialize, were significant predictors of goal-setting and
self-efficacy. Many studies have identified conscientiousness, that is being determined
and dependable as well as resourceful, to be a valid predictor of job performance for several occupational groups and criterion types (Barrick & Mount, 1993; Hough, 1998;
Judge & Ilies, 2002; McHenry, Hough, Toquam, Hanson, & Ashowrth, 1990). In addition, Collins, Hanges, and Locke (2004) confirmed a significant positive relation between success entrepreneurs’ need for achievement, that is, being motivated to achieve goals, utilize skills and knowledge, excel personal standards, and rival and surpass others (Fineman, 1977; McClelland, Atkinson, Clark, & Lowell, 1953; Murray, 1938).
Organizational Behavior at the Meso Level
The meso level relates to group/team-level inputs and processes that influence performance (Bell, 2007; Colquitt et al., 2015). A team has “some level of interdependence and operates in an organizational context that influences their functioning” (Mathieu et al., 2008, p. 411) and can be described by a number of characteristics, including team personality, diversity and group structure (Robbins et al., 2013). In the last decades, team work has increased due to advances in technology and an increasing requirement for contributions from multiple people across the organization (Cannon-Bowers & Salas, 2001; Robbins & Judge, 2012). This makes an examination of team characteristics on performance highly relevant to today’s work environment (Jackson, Joshi, & Erhardt, 2003).
For example, team structure, described as relationships that drive the allocation of tasks, responsibilities and authority, was identified to be related to team performance (Stewart & Barrick, 2000). Further, Saavedra, Earley, and Van Dyne (1993) found support for the impact of complex group interdependences on group performance.
Complex interdependencies directly affected intragroup conflict, although varying by
task condition. In addition, this relationship between group interdependencies and
performance was partially mediated by intragroup conflicts. That is, the process of intragroup conflict negatively affected group performance. Besides team structure, leadership, the act of influencing others to work towards a certain goal, has an important impact on outcomes (Cohen, 1990, p. 9). Teams are able to perform successfully when their tasks are being managed, either by a leader or by self-managed teams (Robbins &
Judge, 2012). For example, Srivastava, Bartol, and Locke (2006) found that empowering leadership has a positive impact on performance. In addition, transformational leaders are assumed to be capable of aligning team goals by establishing team identification processes and collective optimism, which in turn increases team performance (Kearney & Gebert, 2009).
Besides the increasing importance of team work in organizations (Lawler, Mohrman, & Ledford, 1995; Mohammed & Angell, 2004), teams have become more and more diverse (Choi, 2007; Sung, Choi, & Kim-Jo, 2014). This makes the examination of relationships between diversity in teams and performance more important than ever (Barrick, Neubert, Mount, & Stewart, 1998; Barry & Stewart, 1997;
Van Knippenberg & Schippers, 2007). In terms of surface-level diversity, researchers found support for a positive relationship between demographic diversity and team performance (Bantel & Jackson, 1989). Others identified the relationship between both gender diversity (Gonzalez & Denisi, 2009) and nationality diversity (Earley &
Mosakowski, 2000) and performance to be an inverted U. In terms of deep-level
diversity, informational diversity is known to be positively related to group performance
(Jehn, Northcraft, & Neale, 1999). In contrast, the relationship between value diversity
and group performance was identified to be negative (Harrison, Price, Gavin, & Florey,
2002). With respect to team personality, some researchers found supporting evidence
for a linear positive effect on team performance (Barrick et al., 1998; Bell, 2007;
Neuman, Wagner, & Christiansen, 1999).
Organizational Behavior at the Macro Level
The macro level deals with organizational-level inputs such as organizational structure as well as culture (Robbins & Judge, 2012). These organizational inputs drive processes such as the implementation of human resource management and change practices. The examination of organizational characteristics is of particular importance as they have a substantial impact on the employees’ and teams’ behavior, and in turn on performance (De Meuse, Bergmann, Vanderheiden, & Roraff, 2004; Mumdziev &
Windsperger, 2011).
Organizational structure can be characterized by centralization, the extent to
which decisions are made in one central point in an organization, or formalization, the
extent to which jobs and tasks are standardized (Robbins et al., 2013). Organizational
structure affects the link between individual and team characteristics and performance
(Hirst, Van Knippenberg, Chen, & Sacramento, 2011; Robbins & Judge, 2012). A
centralized organization may be more beneficial than a decentralized organization for
performance (Mumdziev & Windsperger, 2011). Furthermore, organizational
downsizing, the planned approach to make an organization leaner by staff reduction or
business selling, is an important organizational characteristic having an impact on
performance. De Meuse et al. (2004) found that when organizations implement
downsizing, it has a positive impact on organizational financial performance three years
after the announcement in comparison to non-downsizing companies. In contrast,
Guthrie and Datta (2008) suggested downsizing to be negatively related to firm
profitability, and that the effects are even stronger for industries with high research and
development intensity. In addition, the organizational type, for example a start-up
company versus a franchise organization, also may have a significant impact on the relationship between individual- and team-level characteristics and performance.
Moreover, organizational culture, characterized by the four traits, involvement, consistency, adaptability and mission, is identified to be positively related to performance (Dension & Mishra, 1995).
1.2 Multilevel Organizational Behavior Research
Researchers and practitioners agree that individual, team and organizational characteristics play an important role for performance (Colquitt et al., 2015; Robbins &
Judge, 2012). As a consequence, they are interested in understanding which and how factors and characteristics at these three levels affect performance (Colquitt et al., 2015). As outlined in Chapter 1.1, a great number of studies made attempts to answer these questions. However, research gaps still exist regarding the aforementioned relationships and many research questions relevant for theory and practice remain unanswered (Hersey, Blanchard, & Johnson, 2007). This makes the assessment of characteristics at the individual, team and organizational level in the workplace an essential part of today’s research. Based on theoretical as well as methodological reasons, researchers claim the need to apply multilevel analysis at the three levels of organizational behavior to account for the embeddedness of each level in a higher-level context (Klein & Kozlowski, 2000; Kozlowski, Chao, Grand, Braun, & Kuljanin, 2013).
With respect to the theoretical reasons, two aspects are important. First, in
organizations, top-down as well as bottom-up processes take place that span the
multiple levels of an organization (Klein & Kozlowski, 2000). Top-down processes
relate to the contextual effects of higher levels (e.g. organizational level) that shape
lower level processes (e.g. individual- or team-level) such as strategic decisions, which
are implemented by teams and individuals. Bottom-up relates to lower level phenomena (e.g. individual or team level) that manifest at higher levels (e.g. organizational level) (Kozlowski et al., 2013). This multilevel emergence in organizational behavior needs to be addressed in order to provide valuable insights, including the impact of specific individual or team inputs on performance. In sum, it is important to account for organizational behavior at all levels and the embeddedness of each level in a higher- level context in order to identify the relevant mechanisms and processes that influence performance outcomes (Sawyer, 2001).
Second, researchers as well as practitioners are interested in identifying the actual impact of individual, group or organizational characteristics on performance.
However, this is challenging when individuals are nested within teams or in an organization. This embeddedness may result in additional effects from the other levels that influence the processes and outcomes (Kozlowski et al., 2013). The embeddedness makes it necessary not to examine solely individual, team or organizational characteristics but also to account for the resulting effects of being nested in a team or organization. For example, analyzing characteristics at the macro level does not take into account individual and team characteristics, whereas looking solely at the micro level does not take into account contextual effects of organizational characteristics that can constrain the effects of individual differences (Klein & Kozlowski, 2000).
Multilevel research is able to conceptualize the embeddedness of individuals in an organization and the influence of lower and higher levels. Multilevel research allows researchers to specify how phenomena at different levels are linked, thereby bridging the different perspectives (Mathieu & Chen, 2011).
From a methodological point of view, multilevel analysis is able to solve the
major challenge to identify both the direct effects of specific inputs and to conduct an
empirical analysis of contextual and emergent effects (Kozlowski et al., 2013). The development of multilevel analysis has made the investigation of system phenomena possible. Multilevel analysis enables researchers to solve the statistical problems resulting from hierarchical data structures, allowing a more integrated understanding of processes across levels in organizations (Klein & Kozlowski, 2000). For example, multilevel analysis is able to remove the between-group variation from lower level predictors by centering the variables. As a consequence, it allows the interpretation of the direct effects of the explanatory variables (Aguinis, Gottfredson, & Culpepper, 2013; Enders & Tofighi, 2007a). Although multilevel analyses has clear advantages, due to theoretical and methodological reasons as highlighted before, many research questions still remain unanswered (Kozlowski et al., 2013).
1.3 Thesis Outline
The main contribution of this thesis is the investigation of relationships between performance and characteristics at the individual, team, and organizational level applying multilevel analyses. The three studies analyze the impact of various individual, team and organizational inputs on individual and team performance through underlying processes. Each study contributes to closing specific research gaps and answering research questions that are of particular interest to practitioners as well as researchers and have not been examined so far.
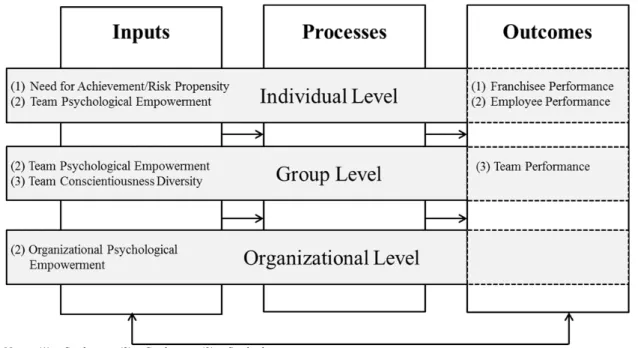
Figure 1.2 provides an overview of the variables analyzed in my three studies
based on the Input-Process-Outcomes Model. In study one (1), the impact of two
individual characteristics such as need for achievement and risk propensity on employee
performance is analyzed. Study two (2) examines the relationship between employee
performance and individual (psychological empowerment), team (team empowerment),
as well as organizational characteristics (organizational empowerment). In study three (3) the focus lies on a team characteristic such as team personality diversity. In the next section, the current states of research, the research gaps and the research questions for each study are briefly described.
Figure 1.2: Input-Process-Outcome Model – Thesis Overview
Own representation based on Mathieu et al. (2008, p. 413); Robbins et al. (2013, p. 25).
Notes: (1) = Study one; (2) = Study two; (3) = Study three.
Study one (Chapter 2) investigates the effects of two individual-level personality traits, need for achievement and risk propensity (the micro level), on franchisees’
performance in franchise organizations, based on multilevel analyses with 276
franchisees nested in 47 franchise organizations. A considerable body of research
focuses on franchising, which accounts for a large proportion of economic activity all
over the world (Combs, Ketchen, Shook, & Short, 2011; Ketchen, Short, & Combs,
2011). However, most studies have focused on franchisors and the impact of their
strategic decisions on performance (Combs et al., 2011) and little is known about the
influence of franchisees. Specifically, researchers call the investigation of individual
characteristics because these inputs may have a potential impact on performance and
help to understand why some franchisees are more successful than others (Combs et al.,
2011; Combs, Michael, & Castrogiovanni, 2004). The study one contributes to closing the research gap and answering the research question of how franchisees’ individual characteristics, such as need for achievement and risk propensity, relate to performance as selecting the right franchisees is crucial for the franchise organization’s success (Combs et al., 2011; Ketchen et al., 2011).
In study two (Chapter 3), the relationships between employee performance and psychological empowerment at the individual (the micro level), team (the meso level) and organizational level (the macro level) are examined, using a sample of 430 employees nested in 180 teams from 29 organizations. In this study, the characteristics at the micro, meso and macro organizational behavior level are analyzed simultaneously. The concept of psychological empowerment has received considerable academic attention as a main driver of employee performance (Conger & Kanungo, 1988; Kanter, 1977; Seibert, Wang, & Courtright, 2011). More recent studies have begun to examine the generalizability of empowerment theory across multiple levels (Chen, Kirkman, Kanfer, Allen, & Rosen, 2007; Seibert, Silver, & Randolph, 2004).
Although the individual and team level implications of psychological empowerment on performance have been examined in prior research, no study so far has addressed the organizational effects of psychological empowerment on employee performance (Maynard, Gilson, & Mathieu, 2012). Therefore, the research question is how and whether psychological empowerment at the individual, team and especially the organizational level affects employee performance.
Study three (Chapter 4) analyzes the effect of team conscientiousness diversity
on team performance by applying multilevel analysis, using a sample of 116 teams
(with 327 employees) nested in 20 companies. Moreover, the moderating impact of
empowering leadership (the meso level) is examined while controlling for the
embeddedness of teams in organizations. Due to increased teamwork and increasingly diverse teams, an understanding of diversity in teams is important for organizations and societies (Choi, 2007; Lawler et al., 1995; Mohammed & Angell, 2004). However, due to inconsistent research findings, the questions of how differences between team members affect performance, and whether diversity in teams may have positive or negative effects on team performance, remain to be solved (Jackson et al., 2003;
Milliken & Martins, 1996; Van Knippenberg & Schippers, 2007; K. D. Williams &
O’Reilly, 1998). In this study, the research questions are: What are the effects of deep- level diversity, such as team conscientiousness diversity, on team performance? Is the relationship inverted U-shaped, and does a contextual condition such as empowering leadership moderate the relationship?
In sum, this dissertation contributes to closing the research gaps that call for an
understanding of the relationship between specific characteristics at the individual, team
and organizational level and performance, while applying multilevel analyses.
2 Too Much of a Good Thing? Risk Propensity, Need For Achievement and Performance
among Franchisees
2.1 Introduction
Franchising accounts for a large proportion of economic activity all over the world and has attracted a considerable body of research (Combs et al., 2011; Ketchen et al., 2011). So far, however, most of this research has focused on franchisors, their decision to use franchise as a strategy and the consequences of this decision (Combs et al., 2011). In contrast, we know much less on why, within the very same franchise organization, some franchisees are more successful than others and there is a particular dearth of research shedding light on how individual characteristics may contribute to answering this question (Combs et al., 2011; Combs et al., 2004).
The present study contributes to closing this gap by examining how franchisees’
risk propensity and their need for achievement contribute to explaining franchisee performance. Addressing this question seems fruitful for several reasons: First, a considerable body of research among independent entrepreneurs shows that these two individual characteristics may have a significant impact on success in exploiting a business opportunity and running a new business (Collins et al., 2004; Fahed-Sreih &
Morin-Delerm, 2012; Johnson, 1990). When considering that franchisees also run a
venture to locally exploit a business opportunity, it seems plausible to assume that risk
propensity and need for achievement may potentially also help to explain why some
franchisees are more successful than others. Second, however, researchers have rightly
pointed to significant differences regarding other aspects of the occupational contexts in
which independent entrepreneurs and franchisees are embedded. The former are largely
autonomous in managing and running their business and reap the monetary rewards of
their efforts and achievements (Lévesque, Shepherd, & Douglas, 2002). The latter are embedded in a franchise organization, expected to follow rules and standards set by the franchisor, which limits their autonomy (Combs et al., 2004; Ketchen et al., 2011). With the franchisor typically receiving a considerable percentage of franchisees’ revenues, franchisees also never reap the full benefits from their efforts (Combs et al., 2004;
Ketchen et al., 2011). Taking into account that person-environment fit theory suggests occupational context differences to have an effect on the relationship between individual characteristics and performance (Kristof-Brown, Zimmerman, & Johnson, 2005) it thus seems likely that individual factors affecting the performance of independent entrepreneurs may not necessarily have similar performance implications among franchisees.
Against this backdrop, the present study develops theoretical arguments on how risk propensity and need for achievement will relate to performance among franchisees.
In particular, we propose that among franchisees there will be a) an inverted U-shape relationship between risk propensity and performance as well as an inverted U-shaped relationship between need for achievement and performance. We test our hypotheses using multilevel analyses based on a dataset comprising 276 franchisees nested in 47 franchise organizations and find evidence supporting our theoretical reasoning.
The study at hand makes several contributions. First, our study narrows a
substantial gap in the franchise literature (Combs et al., 2011; Combs et al., 2004) by
highlighting how risk propensity and need for achievement can help to answer the
question why some franchisees are more successful than others. Additionally, our study
contributes to the discussion on the differences between entrepreneurs and franchisees
(Kaufmann & Dant, 1999; Ketchen et al., 2011), as it points to the fact that while the
similar individual-level characteristics may be relevant for the performance of
franchisees and independent entrepreneurs, these characteristics may differ in how they relate to performance across the two groups. Finally, we believe that our study also has clear practical implications.
2.2 Theory and Hypotheses
Franchising involves a long-term contractual agreement between a franchisor and a group of franchisees (Combs et al., 2004; Ketchen et al., 2011). The franchisor collects fees and receives a percentage of franchisees’ revenues in exchange for allowing franchisees to market goods or services under their brand name and use their business practices and processes (Combs et al., 2004; Ketchen et al., 2011). For the franchisor, this arrangement bears the opportunity to quickly grow a businesses and profit from franchisees’ resources and their understanding of local markets. For franchisees, it provides the opportunity to run their own firm within the boundaries defined by the franchisor.
Based on these characteristics of franchising, there is an ongoing debate on the extent to which franchisees are entrepreneurs (Kaufmann & Dant, 1999; Ketchen et al., 2011). On the one hand, franchisees are considered to be similar to independent entrepreneurs as both set up and run their own businesses to realize financial achievements (Clarkin & Swavely, 2006; Kaufmann & Dant, 1999; Ketchen et al., 2011). In doing so, both also take considerable levels of risk (Kaufmann & Dant, 1999;
Ketchen et al., 2011), including investing their own money, dedicating time and energy,
and most likely devoting themselves, at a personal level, to the new venture without
knowing in advance whether the business will be profitable or if they have the
capabilities and skills needed to succeed. Thus, failure is quite common among
independent entrepreneurs (Holmes, Hunt, & Stone, 2010; Ucbasaran, Shepherd,
Lockett, & Lyon, 2013), as well as franchisees (Combs et al., 2004; Michael & Combs, 2008).
In contrast to independent entrepreneurs, franchisees typically do not need to identify the business opportunity they exploit, can rely on a tried-and-true business model as well as an existing brand name and established business practices and processes (Combs et al., 2011; Ketchen et al., 2011; Pizanti & Lerner, 2003; Shane, 1996). The franchising arrangement thus limits the risks involved in setting up a new business and lowers the degree to which franchisees are personally responsible for their work outcomes (Ketchen et al., 2011). At the same time, the franchise arrangement does not allow franchisees to reap the full benefits from their own abilities, efforts, and achievements, as the franchisor collect an initial entry fee and typically receives a certain percentage of franchisees’ revenues as royalty payments (Combs & Ketchen, 2003; Combs et al., 2004; Michael & Combs, 2008). Additionally, and even though franchisees typically have substantial latitude, they have less autonomy and flexibility than independent entrepreneurs (Kaufmann & Dant, 1999; Ketchen et al., 2011). Acting as agents of a principal, franchisees are also obliged to follow their franchisor’s rules and requirements (Combs et al., 2011; Pizanti & Lerner, 2003; Shane, 1996). In particular, franchisees are expected to act on behalf of their franchisors, comply with the rules and standards set, nurture the franchisor’s brand name, and facilitate cross-buying within the franchise system (Combs et al., 2004; Davies, Lassar, Manolis, Prince, &
Winsor, 2011; Kidwell, Nygaard, & Silkoset, 2007).
When considering these similarities and dissimilarities between franchisees and
independent entrepreneurs, it seems plausible to assume that personality characteristics
shown to contribute to explaining differences in the performance of independent
entrepreneurs may also help explain why some franchisees are more successful than are
others. Considering differences in the occupational contexts in which franchisees and independent entrepreneurs are embedded, however, it seems likely that the performance implications of such individual characteristics may not necessarily be equivalent.
Based on this notion, we subsequently develop and test hypotheses on how risk propensity and need for achievement––two personality traits that are closely related to entrepreneurial activity and founding a business from a conceptual perspective (Brockhaus, 1982; Johnson, 1990; McClelland et al., 1953)––contribute to explaining differences in franchisees’ performance.
2.2.1 Risk Propensity and Franchisees’ Performance
Risk propensity is a personality trait indicating individuals’ readiness to take risks and their willingness to take actions that involve uncertainty in order to potentially get higher returns (Zuckerman, 1994). With these characteristics in mind, risk taking is considered to be a key predictor of becoming an entrepreneur and has repeatedly also been addressed as a factor relevant for explaining differences in entrepreneurs’ success (Caliendo, Fossen, & Kritikos, 2009; Lumpkin & Dess, 1996). In fact, previous research has shown that entrepreneurs are typically more willing to take higher risks than non- entrepreneurs (Kihlstrom & Laffont, 1979; Zheng & Prislin, 2012), and that individuals’
risk propensity predicts individuals’ decision to eventually become an entrepreneur (Caliendo et al., 2009). Previous research has also found a relationship between risk propensity and entrepreneurs’ success which seems to be best described by an inverted U (Caliendo, Fossen, & Kritikos, 2010; Chell, Harworth, & Brearly, 1991).
Among franchisees, for which this link has––to the best of our knowledge––not
been addressed so far, we also suggest an inverted U-shaped relationship between risk
propensity and performance. Specifically, we posit that franchisees with both low and
high risk propensity realize lower performance than will those with medium risk
propensity. Initially, increases in risk propensity should be beneficial for franchisees’
performance, as individuals with higher levels of risk propensity tend to be more comfortable in dealing with situations involving risk and uncertainty and, thus, are better able to deal with the tasks involved in setting up and running a business (Nieß &
Biemann, 2014). Additionally, individuals with higher risk propensity have shown to be more self-confident, tend to exhibit a greater self-efficacy, and are more resistant to stress than their counterparts with lower risk propensity (Zhao, Seibert, & Hills, 2005).
These characteristics are helpful for franchisees to overcome the challenges involved in setting up and running a new business in new and untried markets (Baum & Locke, 2004; Kaufmann & Dant, 1999).
However, there are also reasons to believe that––after a certain threshold is reached––further increases in risk propensity result in a decrease in franchisees’
performance. Similar to independent entrepreneurs, franchisees have to manage their resources carefully to succeed (Ketchen et al., 2011). A high risk propensity may lead franchisees to gamble with their resources. Specifically, franchisees with a high risk propensity may more likely follow their own entrepreneurial ideas on how to run their business instead of sticking to the tried-and-true procedures and processes established by the franchisor. With compliance to standards set by the franchisors being crucial to secure franchisees’ performance (Davies et al., 2011; Fenwick & Strombom, 1998;
Kidwell et al., 2007), we thus propose:
Hypothesis 1: The relationship between franchisees’ risk propensity and performance is inverted U-shaped.
2.2.2 Franchisees’ Need for Achievement and Performance
Need for achievement is another personality trait considered to be highly
relevant for individuals’ inclination to become an entrepreneur as well as performance
(Barrick & Mount, 2005; Fahed-Sreih & Morin-Delerm, 2012; Hogan, 2007). Need for achievement describes individuals’ drive to achieve goals, as well as their motivation to use their skills and knowledge, excel personal standards, and rival and surpass others (Fineman, 1977; McClelland et al., 1953; Murray, 1938). Individuals who are highly achievement motivated strive to succeed in relatively demanding tasks where outcomes are based on their skills and efforts and results are easily measurable (Davidsson, 1989;
Johnson, 1990). They likely engage in activities that entail clear responsibilities for task outcomes and that allow a high level of independence and competence assessment (Amit, Glosten, & Muller, 1993; Collins et al., 2004)
Need for achievement has a long tradition of being associated with entrepreneurial activity (Collins et al., 2004; Johnson, 1990) and several studies suggest a positive relationship between need for achievement and success among independent businesses. Miner, Smith, and Bracker (1994), as well as Lee and Tsang (2001), for example, showed that businesses founded by individuals with a high need for achievement grow significantly faster than do those of their counterparts with a lower need for achievement. A meta-analysis conducted by Collins et al. (2004) confirmed a significant positive relation between founders’ need for achievement and their success.
Based on the notion that need for achievement is a relevant predictor of the performance
of entrepreneurs, we believe that it may also be relevant for explaining differences in
franchisees’ performance. In contrast to what research on need for achievement among
entrepreneurs suggests, however, we posit that the relationship between need for
achievement and performance among franchisees follows an inverted U. Similarly to
our hypothesis on the relationship between franchisees’ risk propensity and
performance, we propose that franchisees with a low, as well as franchisees with a high
need for achievement will realize a lower performance than franchisees with a medium level of need for achievement.
As outlined above, individuals scoring high on need for achievement desire to accomplish challenging tasks whose outcomes are easily measurable, strive for a high level of autonomy, and are motivated by task outcomes based on their skills and efforts (Lee & Tsang, 2001). Being responsible for setting up and developing a franchise outlet implies a considerable level of responsibility. Moreover, immediate feedback on success is provided in terms of financial outcomes (Davidsson, 1989). To at least some extent, becoming a franchisee should thus fit with relatively higher levels of need for achievement and, according to person-environment fit theory, thus result in a willingness to invest time and energy that facilitates performance (Kristof-Brown et al., 2005). Additionally, a higher need for achievement should increase franchisees’ abilities to overcome the challenges involved in setting up and running their franchise outlet. As previous research suggests, individuals with higher need for achievement are more likely able to engage in the instrumental activities necessary for success in setting up and running a business, as scoring high on achievement motivation implies the use of productive and active strategies to overcome problems (Frese, Fay, Hilburger, Leng, &
Tag, 1997).
However, we also expect that, after a certain threshold, further increases in need
for achievement will likely result in decreases in franchisees’ performance. In contrast
to independent entrepreneurs, who are autonomous and may act on their own behalf in
managing and running their business, franchisees are agents of their franchisors and
constrained by their obligations to follow the rules, business practices and processes
defined (Davies et al., 2011; Kidwell et al., 2007). Additionally, franchisees’ business
outcomes are not solely based on their skills and efforts, but also on their franchisors’
and other franchisees’ actions (Ketchen et al., 2011). Moreover, franchisees have to share the benefits from their efforts and achievements with their franchisor (Kaufmann
& Dant, 1999; Ketchen et al., 2011). Based on these arguments, we suggest that a high rather than moderate level of need for achievement aligns less coherently with being a franchisee. According to person-environment fit theory (Kristof-Brown et al., 2005), further increases in need for achievement beyond a certain threshold will thus likely result in a decrease in motivation and effort among franchisees that is detrimental for their performance. Additionally, tendencies to strive to excel in existing standards, and rival and surpass others that are associated with high levels of need for achievement (Fineman, 1977; McClelland et al., 1953; Murray, 1938) may motivate franchisees to behave competitively toward other franchisees within the system, deviate from the standards set by the franchisor, which can ultimately decrease their performance (Davies et al., 2011; Fenwick & Strombom, 1998; Kidwell et al., 2007). Therefore, we propose:
Hypothesis 2: The relationship between franchisees’ need for achievement and performance is inverted U-shaped.
2.3 Sample and Method
2.3.1 Sample
Data were gathered in a survey study comprising three parts. First, we designed
an online questionnaire that assessed franchise systems’ characteristics and was to be
answered by the franchisor. Franchisors invited to participate in the study were
identified and contacted with the help of a cooperating internet portal that specialized in
franchising. As part of the survey, franchisors also listed contact information on at least
five of their franchisees. Second, we sent out survey invitations to the franchisees that
were identified by franchisors. From a total of 581 franchisees, we received 276 questionnaires (response rate of 47.5%) from 47 franchise organizations located in Germany. Third, franchisors evaluated participating franchisees’ performance on a questionnaire. We then matched franchisor and franchisee data. On average, franchisors in our data set had been in business for 16.58 years, and their systems comprised 88.22 franchisees. Their distribution in industry categories is fairly similar to the one the German Franchising Association (DFV) reports for the German franchising industry (DFV, 2013). Specifically, 51.1% of our franchisors were active in the service sector (48% for the German franchising industry), 23.4% in the trading sector (27% for the German franchising industry), and 23.4% in hotel and food services (17% for the German franchising industry). The mean age of franchisees in our sample was 44.19 years, and 21% were female. On average, franchisees had 13.20 years of formal education and 7.21 years of industry experience before entering their respective franchise organizations.
2.3.2 Measures
Our study is based on survey data obtained from either franchisors or franchisees. The surveys were conducted in German. All scales adapted from English versions were translated and back-translated to ensure equivalency (Brislin, 1980).
Franchisee Performance. We relied on two different measures to capture franchisees’ performance. First, we followed earlier research among entrepreneurs (Chandler & Hanks, 1993, 1998; Honig, Lerner, & Raban, 2006; Lee & Tsang, 2001;
Semrau & Sigmund, 2012) and asked franchisees to indicate recent revenue and profit
growth rates of their franchise outlets using broad categories. Response categories
ranged from 1 (up to 0%) to 9 (more than 200%). We chose this scale format as it helps
to overcome problems caused by unwillingness to disclose detailed financial
information (Zahra, Neubaum, & El-Hagrassey, 2002). Revenue and profit growth rates were highly interrelated (r = .730, p < .01)
1, and were combined into a single index to represent franchisees’ financial performance.
2Second, we adapted a scale developed by Janssen and Van Yperen (2004) to assess franchisees performance from the perspective of the franchisor. This scale comprised of five items with a 7-point Likert scale (1 = strongly disagree, 7 = strongly agree) that were answered by the franchisor (Cronbach’s alpha = .95). Sample items are
“This franchisee meets all the performance requirements” and “This franchisee fulfills all his/her responsibilities.” In contrast to the measure described above, relying on this scale also allowed us to capture aspects of franchisees’ behaviors, such as free-riding or deviating from the rules set by the franchisor, which may not have immediate negative consequences for franchisees’ financial performance, but may be detrimental for the franchise organization (Lado, Dant, & Tekleab, 2008; Loughry & Tosi, 2008).
Risk Propensity. To measure franchisees’ risk propensity, we relied on seven items that previous research has validated to capture individuals’ general tendencies to take risks (Meertens & Lion, 2008; Zhao et al., 2005). Specifically, we made use of five items developed by Meertens and Lion (2008) and added two items established by Zhao et al. (2005) to ensure that our scale was sufficiently reliable. Sample items are “I prefer to avoid risks (reverse coded)” and “I enjoy the excitement of uncertainty and risk.”
Franchisees rated their agreement with each statement using a 7-point Likert scale (1 = strongly disagree, 7 = strongly agree). Cronbach’s alpha for this scale was .79.
Need for Achievement. To gauge franchisees’ need for achievement, we used
the nine items scale developed and validated by Eisenberger, Jones, Stinglhamber, Shanock, and Randall (2005). Sample items are “I like to set challenging goals for
1 Reported is the average correlation. Across the five imputed datasets used for this study, correlations ranged from r = .708, p < .01 to r = .767, p < .01.
2 Items were logarithmized before being combined to correct for skewness.
myself on the job” and “I enjoy situations at work where I am personally responsible for finding solutions to problems.” Franchisees rated their agreement with each statement using a 7-point Likert scale (1 = strongly disagree, 7 = strongly agree). Cronbach’s alpha for this scale was .85.
Controls. At the franchisee level, we controlled for gender, which was previously found to be related to succeeding in developing a business (Langowitz &
Minniti, 2007; Renzulli, Aldrich, & Moody, 2000). We also accounted for franchisee age because older individuals have had more opportunities to accumulate experiences and expertise (Colombo & Grilli, 2005; Lee & Tsang, 2001). In addition, we controlled for franchisees’ highest level of formal education (Frese et al., 2007; Wiklund &
Shepherd, 2003) and industry experience in terms of the number of years they were active in the respective industry prior to becoming a franchisee for their current franchisor (Delmar & Shane, 2006; Lee & Tsang, 2001), as both may effect franchisee performance. We further controlled for franchisees’ working hours per week for their franchise outlets to control for part-time franchisees.
At the franchisor level, we controlled for several variables that earlier research has shown to be related to franchisors’ and franchisees’ performance. We followed earlier research to control for the age of the franchise organization and its size in terms of the total number of franchisees (Kalnins & Mayer, 2004; Pizanti & Lerner, 2003;
Windsperger, 2004). To control for potential effects of the industry sectors in which franchise organizations operate, we included dummy variables that indicated whether the franchise organizations were active in trading or accommodation and food services.
Recognizing that initial fees may prevent franchisees’ opportunistic behaviors
(Windsperger, 2001), we also included a dummy variable that indicated whether a
franchisor collected initial fees from franchisees. In addition, we controlled for the
extent to which decision rights were centralized in a franchise system using the scale developed by Windsperger (2004) and for the level of formalization in a franchise system by relying on a scale developed by Boulay (2010). Finally, we considered differences in franchise systems’ strategic postures. To capture this variable, we made use of an adapted version of the strategic posture scale based on Covin and Slevin (1989), which was previously used by Stam and Elfring (2008).
2.3.3 Analytical Approach
Our data had a hierarchical structure with two levels of analysis (276 franchisees nested in 47 franchise systems). We first checked whether our data required multilevel analyses and estimated a null model and the corresponding intraclass correlation (ICC1) (Aguinis et al., 2013). Confirming the need for multilevel analyses, the null model (see Models 1 and 4, Table 2) revealed that 90% of the variance in franchisees’ growth in financial performance (ICC1 = 0.90) and 45% of the variance in franchisees’ agent performance (ICC1 = 0.45) resided between franchise systems. Thus, we applied a multilevel model reflecting that the franchisees in our sample were nested in franchise systems and entered variables at those two levels of analysis (Bliese, 2000; Hofmann, 1997). We centered our controls at the grand mean and our explanatory variables (risk propensity and need for achievement) at the group means. Group-mean centering removes all between-group variation from lower level predictors and yields pure estimations of their effects, which allows us to directly interpret the performance effects of our franchisee-level explanatory variables (Aguinis et al., 2013; Enders & Tofighi, 2007a).
There were missing data in our variables that varied between zero (e.g., gender)
and 5.4% (risk propensity). To avoid the loss of information and statistical power
inherent in the procedure of listwise deletion (Graham, 2009; Roth, 1994; Schafer &
Graham, 2002), we applied multiple imputation (Rubin, 1987; Sinharay, Stern, &
Russell, 2001). Specifically, we applied an imputation algorithm described by Schafer (2001) and Schafer and Yucel (2002) designed specifically for clustered data.
Imputations were conducted with the PAN extension package using the R language for statistical computing (Team, 2008). Following Sinharay et al. (2001), we created m = 5 imputations. Datasets were stored and analyses were performed on each of the five datasets before the results were combined following the rules suggested by Rubin (1987). We reran all analyses based on the dataset with listwise deleted cases and obtained similar results.
2.4 Results
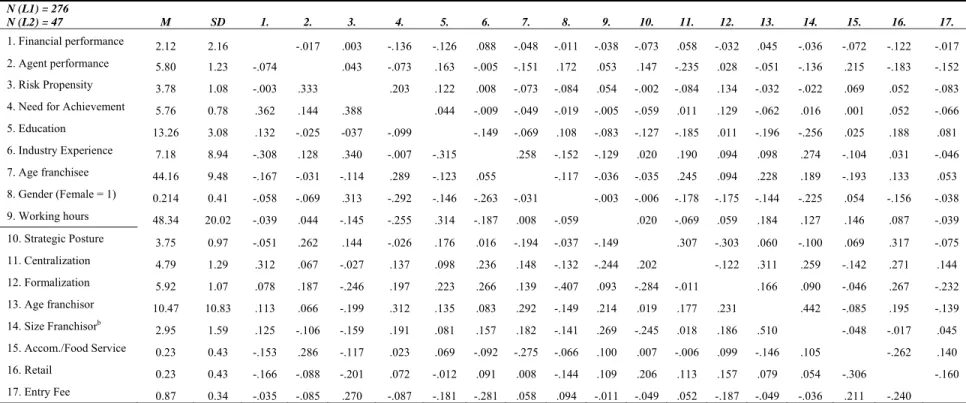
The means, standard deviations, and correlations of our variables are depicted in
Table 2.1.
Table 2.1: Means, Standard Deviations, and Correlations
N (L1) = 276
N (L2) = 47 M SD 1. 2. 3. 4. 5. 6. 7. 8. 9. 10. 11. 12. 13. 14. 15. 16. 17.
1. Financial performance 2.12 2.16 -.017 .003 -.136 -.126 .088 -.048 -.011 -.038 -.073 .058 -.032 .045 -.036 -.072 -.122 -.017 2. Agent performance 5.80 1.23 -.074 .043 -.073 .163 -.005 -.151 .172 .053 .147 -.235 .028 -.051 -.136 .215 -.183 -.152 3. Risk Propensity 3.78 1.08 -.003 .333 .203 .122 .008 -.073 -.084 .054 -.002 -.084 .134 -.032 -.022 .069 .052 -.083 4. Need for Achievement 5.76 0.78 .362 .144 .388 .044 -.009 -.049 -.019 -.005 -.059 .011 .129 -.062 .016 .001 .052 -.066 5. Education 13.26 3.08 .132 -.025 -037 -.099 -.149 -.069 .108 -.083 -.127 -.185 .011 -.196 -.256 .025 .188 .081 6. Industry Experience 7.18 8.94 -.308 .128 .340 -.007 -.315 .258 -.152 -.129 .020 .190 .094 .098 .274 -.104 .031 -.046 7. Age franchisee 44.16 9.48 -.167 -.031 -.114 .289 -.123 .055 -.117 -.036 -.035 .245 .094 .228 .189 -.193 .133 .053 8. Gender (Female = 1) 0.214 0.41 -.058 -.069 .313 -.292 -.146 -.263 -.031 -.003 -.006 -.178 -.175 -.144 -.225 .054 -.156 -.038 9. Working hours 48.34 20.02 -.039 .044 -.145 -.255 .314 -.187 .008 -.059 .020 -.069 .059 .184 .127 .146 .087 -.039 10. Strategic Posture 3.75 0.97 -.051 .262 .144 -.026 .176 .016 -.194 -.037 -.149 .307 -.303 .060 -.100 .069 .317 -.075 11. Centralization 4.79 1.29 .312 .067 -.027 .137 .098 .236 .148 -.132 -.244 .202 -.122 .311 .259 -.142 .271 .144 12. Formalization 5.92 1.07 .078 .187 -.246 .197 .223 .266 .139 -.407 .093 -.284 -.011 .166 .090 -.046 .267 -.232 13. Age franchisor 10.47 10.83 .113 .066 -.199 .312 .135 .083 .292 -.149 .214 .019 .177 .231 .442 -.085 .195 -.139 14. Size Franchisorb 2.95 1.59 .125 -.106 -.159 .191 .081 .157 .182 -.141 .269 -.245 .018 .186 .510 -.048 -.017 .045 15. Accom./Food Service 0.23 0.43 -.153 .286 -.117 .023 .069 -.092 -.275 -.066 .100 .007 -.006 .099 -.146 .105 -.262 .140 16. Retail 0.23 0.43 -.166 -.088 -.201 .072 -.012 .091 .008 -.144 .109 .206 .113 .157 .079 .054 -.306 -.160 17. Entry Fee 0.87 0.34 -.035 -.085 .270 -.087 -.181 -.281 .058 .094 -.011 -.049 .052 -.187 -.049 -.036 .211 -.240
Notes: Numbers above/below the diagonal represent franchisee-/franchisor-level correlations; b logarithm because of skewed distribution; all correlations at franchisee-level above |.119| and at franchisor-level above |.288| are significant at p < .05.
With respect to our hypotheses, franchisee-level correlations revealed that our explanatory variables were significantly and positively related (r = .203, p < .01). Franchisee-level correlations also reveal that our measures for franchisees’ performance were not significantly interrelated, which indicates that both measures indeed capture distinct dimensions of franchisees’
performance.
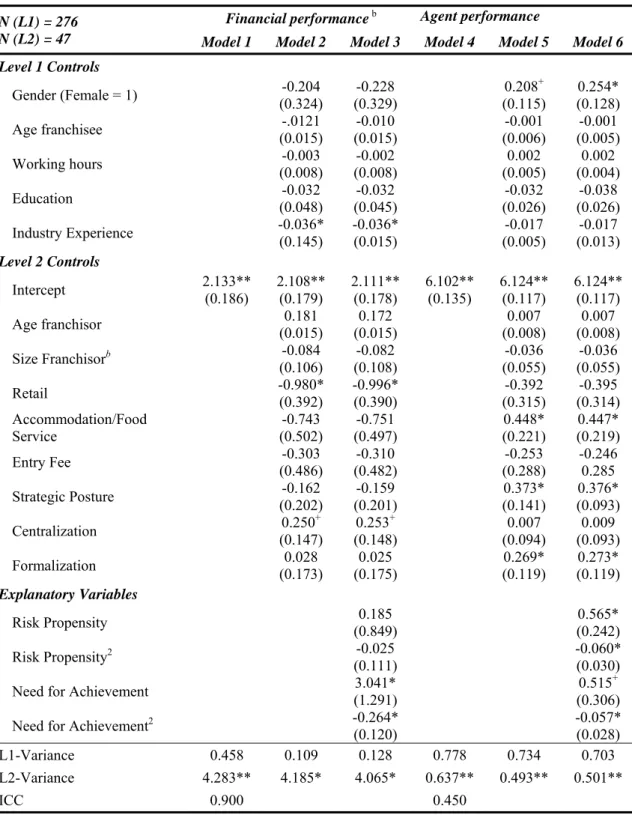
Table 2.2 displays the results of our multilevel analyses.
Table 2.2: Results from Multilevel Analyses
N (L1) = 276 N (L2) = 47
Financial performance b Agent performance
Model 1 Model 2 Model 3 Model 4 Model 5 Model 6 Level 1 Controls
Gender (Female = 1) -0.204
(0.324) -0.228
(0.329) 0.208+
(0.115) 0.254*
(0.128)
Age franchisee -.0121
(0.015) -0.010
(0.015) -0.001
(0.006) -0.001 (0.005)
Working hours -0.003
(0.008) -0.002
(0.008) 0.002
(0.005) 0.002 (0.004)
Education -0.032
(0.048)
-0.032 (0.045)
-0.032 (0.026)
-0.038 (0.026) Industry Experience -0.036*
(0.145) -0.036*
(0.015) -0.017
(0.005) -0.017 (0.013) Level 2 Controls
Intercept 2.133**
(0.186) 2.108**
(0.179) 2.111**
(0.178) 6.102**
(0.135) 6.124**
(0.117) 6.124**
(0.117)
Age franchisor 0.181
(0.015)
0.172 (0.015)
0.007 (0.008)
0.007 (0.008)
Size Franchisorb -0.084
(0.106) -0.082
(0.108) -0.036
(0.055) -0.036 (0.055)
Retail -0.980*
(0.392)
-0.996*
(0.390)
-0.392 (0.315)
-0.395 (0.314) Accommodation/Food
Service -0.743
(0.502) -0.751
(0.497) 0.448*
(0.221) 0.447*
(0.219)
Entry Fee -0.303
(0.486) -0.310
(0.482) -0.253
(0.288) -0.246 0.285
Strategic Posture -0.162
(0.202) -0.159
(0.201) 0.373*
(0.141) 0.376*
(0.093)
Centralization 0.250+
(0.147)
0.253+ (0.148)
0.007 (0.094)
0.009 (0.093)
Formalization 0.028
(0.173) 0.025
(0.175) 0.269*
(0.119) 0.273*
(0.119) Explanatory Variables
Risk Propensity 0.185
(0.849) 0.565*
(0.242)
Risk Propensity2 -0.025
(0.111)
-0.060*
(0.030)
Need for Achievement 3.041*
(1.291) 0.515+
(0.306)
Need for Achievement2 -0.264*
(0.120)
-0.057*
(0.028)
L1-Variance 0.458 0.109 0.128 0.778 0.734 0.703
L2-Variance 4.283** 4.185* 4.065* 0.637** 0.493** 0.501**
ICC 0.900 0.450
Notes: Full information maximum likelihood estimation; Reported are average gamma coefficients with robust standard errors;
standard errors in parentheses; b logarithm because of skewed distribution.
p < 0.10; * p < 0.05; ** p < 0.01.
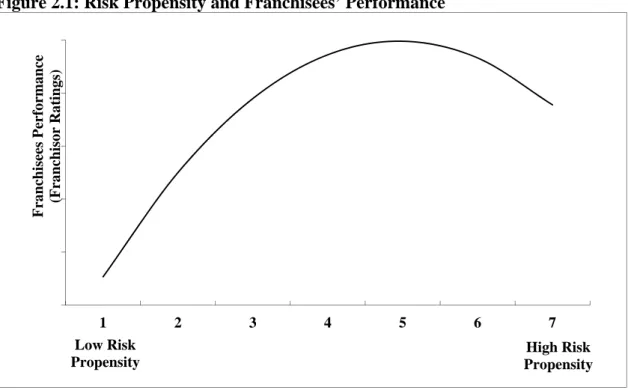
Our first hypothesis stated that the relationship between franchisees’ risk
propensity and their performance would follow an inverted U. Model 3 showed no
significant relation between franchisees risk propensity and their financial performance,
thus, provided no support for Hypothesis 1. In contrast, Model 6 revealed a significant and positive relation between the linear term representing risk propensity (γ = 0.565, p <
.05) and a significant and negative association between its squared term (γ = -0.060, p <
.05) and franchisees performance rated by their franchisor, which supported Hypothesis 1. The corresponding slope illustrating this relationship is depicted in Figure 2.1.
Figure 2.1: Risk Propensity and Franchisees’ Performance
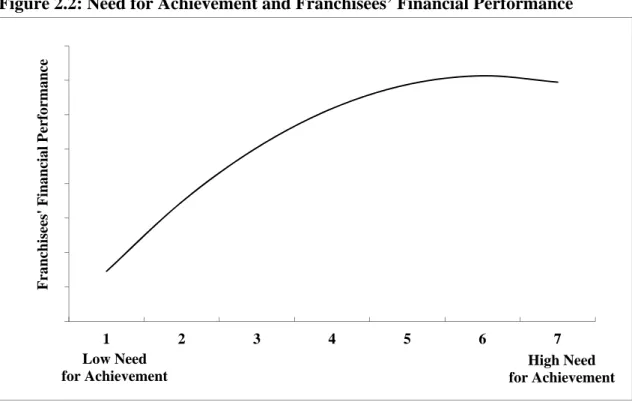
Hypothesis 2 suggested that the relationship between franchisees’ need for achievement and performance would follow an inverted U. Model 3 showed a significant and positive relationship between franchisees’ financial performance and the linear term representing need for achievement (γ = 3.041, p < .05), as well as a significant and negative relation between the squared term representing need for achievement (γ = -0.264, p < .05). Similarly, Model 6 revealed a marginally significant positive link between the linear term representing need for achievement (γ = 0.515, p <
.10) and a significant negative link between the squared term representing need for achievement (γ = -0.057, p < .05) and franchisees’ performance rated by their franchisor. Figure 2.2 and 2.3 illustrate these results.
1 2 3 4 5 6 7
Franchisees Performance (Franchisor Ratings)
High Risk Propensity Low Risk
Propensity
Figure 2.2: Need for Achievement and Franchisees’ Financial Performance
Figure 2.3: Need for Achievement and Franchisees’ Performance
2.5 Discussion
This study aimed to shed light on how risk propensity and need for achievement, two personality traits that are considered highly relevant for the performance of
1 2 3 4 5 6 7
Franchisees' Financial Performance
Low Need for Achievement
High Need for Achievement
1 2 3 4 5 6 7
Franchisees' Performance (Franchisor Ratings)
Low Need for Achievement
High Need for Achievement