Acta Physiologica. 2021;0:e13592. | 1 of 15
https://doi.org/10.1111/apha.13592 wileyonlinelibrary.com/journal/apha
R E G U L A R PA P E R
Mesangial cells regulate the single nephron GFR and preserve the integrity of the glomerular filtration barrier: An intravital multiphoton microscopy study
Vera Ziegler1 | Katharina Fremter1 | Julia Helmchen1 | Ralph Witzgall2 |
Hayo Castrop1
This is an open access article under the terms of the Creative Commons Attribution-NonCommercial-NoDerivs License, which permits use and distribution in any medium, provided the original work is properly cited, the use is non-commercial and no modifications or adaptations are made.
© 2020 The Authors. Acta Physiologica published by John Wiley & Sons Ltd on behalf of Scandinavian Physiological Society 1Institute of Physiology, University of
Regensburg, Regensburg, Germany
2Institute of Molecular and Cellular Anatomy, University of Regensburg, Regensburg, Germany
Correspondence
Hayo Castrop, Institute of Physiology, University of Regensburg, Universitätsstr.
31, 93040 Regensburg, Germany.
Email: hayo@castrop.com Funding information
Deutsche Forschungsgemeinschaft, Grant/
Award Number: 387509280 and SFB1350
Abstract
Aim: The intraglomerular mesangial cells are located between the glomerular capil- laries. Here we hypothesized that mesangial cells regulate the single nephron glo- merular filtration rate (snGFR) and that mesangial cells support the integrity of the glomerular filtration barrier.
Methods: We assessed the function of mesangial cells in vivo by multiphoton mi- croscopy. Mesangial cells were depleted in Munich Wistar Froemter rats using the Thy1.1 antibody model.
Results: The Thy1.1 antibody caused the cell- specific loss of 82 ± 3% of mesangial cells. After mesangial cell depletion, the baseline snGFR was reduced to 12.0 ± 1.2 vs 32.4 ± 3.2 nL/min in controls. In control rats, the snGFR decreased after angio- tensin II infusion by 61 ± 3% (P = .004), whereas it remained unchanged in Thy1.1- treated rats. The changes in the snGFR after angiotensin II infusion in control rats were accompanied by the marked rotation of the capillary loops within Bowman's space. This phenomenon was absent in anti- Thy1.1- treated rats. The glomerular siev- ing coefficient (GSCA) for albumin, used as a measure of the integrity of the glo- merular filtration barrier, was low in control rats (0.00061 ± 0.00004) and increased after angiotensin II infusion (0.00121 ± 0.00015). In Thy1.1- treated rats, the GSC was elevated (0.0032 ± 0.00059) and did not change in response to angiotensin II.
Electron microscopy revealed the increased thickness of the glomerular basement membrane after mesangial cell depletion.
Conclusion: Our data suggest that mesangial cells actively contribute to the regu- lation of the snGFR. Furthermore, mesangial cells are crucially involved in main- taining the integrity of the glomerular filtration barrier, in part by modulating the thickness of the glomerular basement membrane.
K E Y W O R D S
glomerular basement membrane, glomerular sieving coefficient of albumin, intravital microscopy, mesangial cells, regulation of glomerular filtration rate
1 | INTRODUCTION
Renal mesangial cells are located within the glomerulus (intraglomerular mesangium) and adjacent to the glomer- ulus (extraglomerular mesangium, Goormaghtigh cells).1- 3 The intraglomerular mesangial cells are partially attached to the glomerular capillaries. Based on their localization within the glomerulus, mesangial cells may support the structure and function of the glomerulus.4- 6 The relevance of mesangial cells for the function of the glomerulus is most apparent in states of glomerular disease.7 Thus, increased mesangial cell proliferation and mesangial extracellular matrix production are the main pathological features of diabetic nephropathy, which is the single most common cause of terminal renal insufficiency in the Western hemi- sphere.8,9 Similarly, dysregulation of mesangial cell prolif- eration and function is also involved in the pathogenesis of IgA nephropathy.10,11
The role of mesangial cells in normal physiology is less well defined. Studies of cultured mesangial cells indicated that they have a contractile phenotype.6,12,13 Thus, mesangial cells respond in vitro to constrictor agents, such as angioten- sin II.12,13 Accordingly, mesangial cells express angiotensin II subtype 1 (AT1) receptors.12,14,15 Furthermore, functional data obtained from micropuncture studies suggest that me- sangial cells are involved in the regulation of the single nephron glomerular filtration rate (snGFR) by modulating glomerular capillary haemodynamics.16,17
In this study, we used intravital multiphoton microscopy to directly and noninvasively analyse mesangial cell func- tion in real time in living animals.18,19 For this purpose, we depleted mesangial cells using the anti- Thy1.1 model.20 Upon injection of an anti Thy1.1 antibody into rats, the an- tibody binds to the Thy1.1 antigen on the surface of me- sangial cells. Eventually, complement- dependent mesangial cell lysis is induced, which results in the depletion of ap- proximately 72%- 95% of all mesangial cells, depending on the duration of antibody exposure.4,5 The depletion of me- sangial cells in this model has proven to be highly specific, as other organs and adjacent glomerular cells remaining unaffected.21
In this study, we hypothesized that contractile mesangial cells actively regulate glomerular haemodynamics and, con- sequently, are involved in the control of the single nephron glomerular filtration rate (snGFR). Furthermore, we hy- pothesized that mesangial cells may support the integrity of the glomerular filtration barrier, potentially by influencing the thickness and density of the glomerular basement mem- brane.22 To test this hypothesis, we assessed the function of mesangial cells in vivo in Munich Wistar Froemter (MWF) rats using intravital multiphoton microscopy and ex vivo ul- trastructural electron microscopy.
2 | RESULTS
2.1 | Thy1.1 antibody application
specifically depletes glomerular mesangial cells
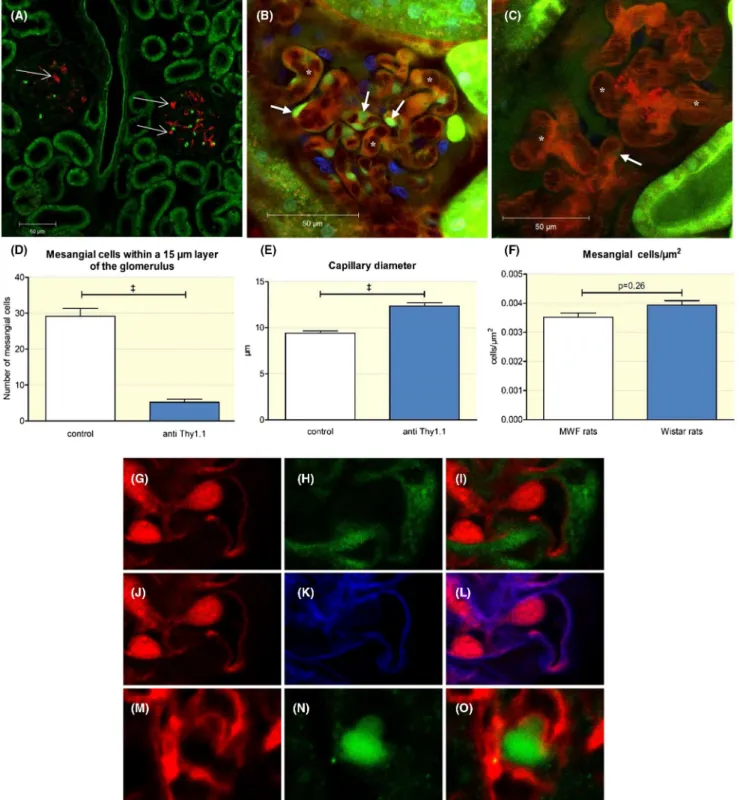
To determine the specificity of Thy1.1 antibody- mediated mesangial cell depletion, we performed immunostaining of anti- Thy1.1 after its injection into MWF rats. Immunostaining showed that the injected anti- Thy1.1 antibody specifically bound to the glomerulus with no apparent binding to ex- traglomerular structures (Figure 1). Costaining for podocin suggested no apparent binding of the Thy1.1 antibody to podocytes (Figure 1). The number of mesangial cells within a 15- µm- thick layer of the glomerulus was determined after Lucifer yellow infusion in control and anti- Thy1.1- treated rats. The specificity of Lucifer yellow uptake was analysed by immunohistochemistry for podocin (to co- stain podocytes) and wheat germ agglutinin, WGA (to identify endothelial cells by co- staining of the endothelial glycocalyx). As shown in Figure 1, there was no significant overlap between Lucifer yellow and podocin and WGA respectively. Based on the up- take of Lucifer yellow by mesangial cells, we estimated that 24 hours after application of the antibody, 82 ± 3% of the me- sangial cells was depleted (Figure 1). To compare the base- line number of mesangial cells in MWF with another strain of rats, we performed an additional cell count in female Wistar rats of the same age. The baseline number of mesangial cells was similar in MWF and Wistar rats, averaging 3.5 ± 0.16 and 3.9 ± 0.15 × 10⁻³ cells/µm2 respectively (Figure 1).
The depletion of mesangial cells was accompanied by al- terations in the glomerular structure. Thus, the loss of me- sangial cells resulted in the enlargement of the glomerular capillaries and an apparent ballooning effect (Figure 1). After 24 hours, the average width of the glomerular capillaries in- creased significantly from 9.4 ± 0.2 µm to 12.4 ± 0.3 µm (n = 89 capillaries; P < .0001). Furthermore, the total area of all glomerular capillaries, as determined in vivo for random focal sections, increased from 7811 ± 410 µm2 in control rats to 10 270 ± 595 µm2 in anti- Thy1.1- treated rats (n = 15;
P = .0018).
2.2 | Mesangial cells regulate glomerular blood flow and the snGFR
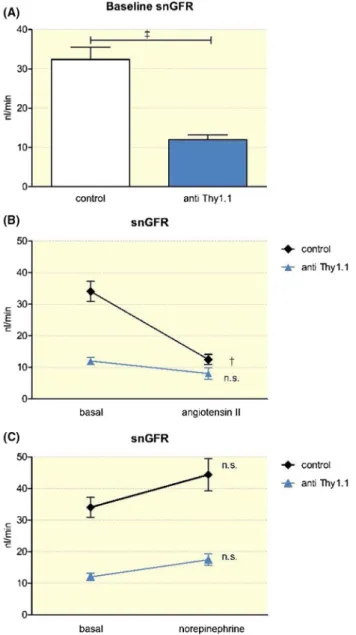
To determine the in vivo relevance of mesangial cells for the regulation of the snGFR, we next determined the snGFR in anti- Thy1.1- treated and control rats at baseline and in re- sponse to the vasoconstrictor angiotensin II using multipho- ton microscopy. The baseline snGFR was markedly reduced in anti- Thy1.1- treated rats compared with that in controls, averaging 12.0 ± 1.2 nL/min (n = 33) and 32.4 ± 3.2 nL/min
FIGURE 1 Anti- Thy1.1 antibody application. A, Immunostaining for the anti- Thy1.1 antibody. The red staining shows the exclusive binding of the anti Thy1.1 antibody within the glomerulus of an anti- Thy1.1- treated rat (thin arrows). For intravital imaging, capillaries of control (B) and anti- Thy1.1- treated rats (C) were visualized by infusion of the Alexa Flour 594 BSA conjugate. Note the capillary ballooning effect in Thy1.1- treated rats (asterisks in C). Mesangial cells were stained by Lucifer Yellow (thick arrows) in control (B) and in anti- Thy1.1- treated rats (C). D, Quantification of the depletion of mesangial cells after the application of an anti- Thy1.1 antibody and (E) effect of mesangial lysis on the glomerular capillary diameter. +++Indicates P < .0001. F, Mesangial cell count in MWF and Wistar rats. G- L, Assessment of the specificity of Lucifer Yellow as a marker of mesangial cells. Immune staining for Lucifer yellow (G), podocin (H), and overlap (I). Staining for Lucifer yellow (J), WGA (K), and overlap (L). Immune staining for Thy1.1 (M), podocin (N), and overlap (O) showed no apparent binding of the Thy1.1 antibody to podocytes
(n = 43) respectively (P < .001) (Figure 2). Similarly, total kidney GFR, as estimated by the determination of plasma creatinine was reduced after Thy1.1. Thus, plasma creatinine was 5.2 ± 1.1 mg/L in anti- Thy1.1- treated rats compared with 2.5 ± 0.4 mg/L in controls (n = 5; P < .01; not shown). An acute infusion of angiotensin II (80 ng/kg/min) increased the arte- rial pressure from 101.1 ± 2.7 mmHg to 125.5 ± 6.3 mmHg (n = 7) in anti- Thy 1.1- treated rats (P = .006). Similarly, after angiotensin II infusion, the arterial blood pressure in control rats increased from 100.1 ± 1.7 mmHg to 128.8 ± 5.0 mmHg (n = 8; P < .001). In control rats, infusion of angiotensin II led to a significant decrease in the snGFR (from 32.4 ± 3.2 nL/
min to 12.5 ± 1.6 nL/min (n = 19; P < .001). Strikingly, in
anti- Thy1.1- treated rats, the snGFR only slightly decreased during angiotensin II infusion without reaching levels of significance. Thus, the snGFR averaged 12.0 ± 1.2 nL/min before and 8.0 ± 1.8 nL/min after angiotensin II infusion (n = 15; p = n.s.) (Figure 2). To distinguish between the direct effects mediated by the activation of angiotensin AT1 recep- tors on mesangial cells and indirect haemodynamic effects, in an additional set of experiments, we titrated an infusion of norepinephrine to cause similar changes in blood pressure as those observed for angiotensin II. When norepinephrine was infused at a dosage of 160 ng/kg/min, the arterial blood pressure increased to 129.1 ± 1.9 mmHg, which was similar to that observed after angiotensin II infusion. There was a nonsignificant trend towards a reduced snGFR after norepi- nephrine infusion, with no differences between anti- Thy1.1- treated and control rats (Figure 2).
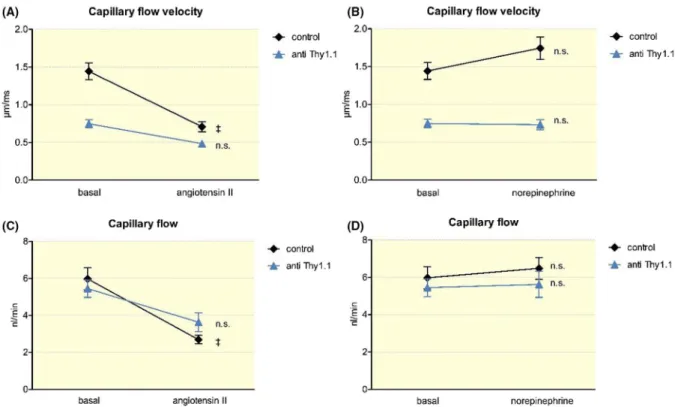
Considering the apparent abnormalities in snGFR reg- ulation in anti- Thy1.1- treated rats, we next analysed glo- merular haemodynamics in anti- Thy1.1- treated and control rats by intravital multiphoton microscopy. As shown in Figure 3, the capillary flow velocity in control rats aver- aged 1.45 ± 0.08 µm/ms and declined during angiotensin II infusion (80 ng/kg/min) to 0.71 ± 0.07 µm/ms (n = 27;
P < .001). The anti- Thy1.1- treated rats had a significantly lower capillary flow velocity at baseline that averaged 0.71 ± 0.03 µm/ ms (n = 78; P < .001). In contrast to that in control rats, the capillary flow velocity in anti- Thy1.1- treated rats remained unchanged after angiotensin II infusion (n = 21; p = n.s.) (Figure 3). In contrast, during norepineph- rine infusion (160 ng/kg/min), the capillary flow velocity of the control and anti- Thy1.1- treated rats remained unchanged compared to the respective baseline value.
The capillary flow is the product of the capillary flow velocity and the cross- sectional area of the respective cap- illary. As mentioned earlier, the depletion of mesangial cells resulted in a ballooning effect in the glomerular capillaries.
The cross- sectional area was enlarged in anti- Thy1.1- treated rats, whereas the capillary flow velocity was reduced. Thus, the calculated capillary flow of the anti- Thy1.1- treated rats did not differ from that of the control rats. During infusion of angiotensin II, the capillary flow of the control rats declined from 5.86 ± 0.38 nL/min to 2.69 ± 0.23 nL/min (n = 27;
P < .001), whereas it remained unchanged in anti- Thy1.1- treated rats (n = 21; p = n.s.) (Figure 3).
2.3 | Observation of the
rotation of the capillary loops after the infusion of angiotensin II
During the determination of the snGFR and the glomerular capillary blood flow by intravital multiphoton microscopy, we observed that the capillary loops within Bowman's space
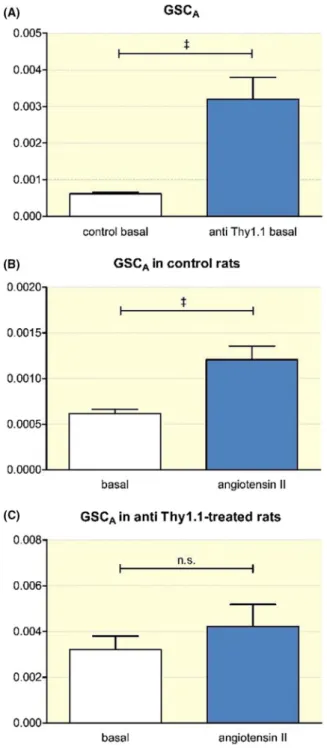
FIGURE 2 Determination of the snGFR by multiphoton microscopy. A, Effect of mesangial cell lysis on the snGFR. B, Effect of an infusion of angiotensin II (80 ng/kg/min) on the snGFR in control and anti- Thy1.1- treated rats. C, Effect of an infusion of norepinephrine (160 ng/kg/min) on the snGFR in control and anti- Thy1.1- treated rats.
++Indicates P < .001; +++indicates P < .0001
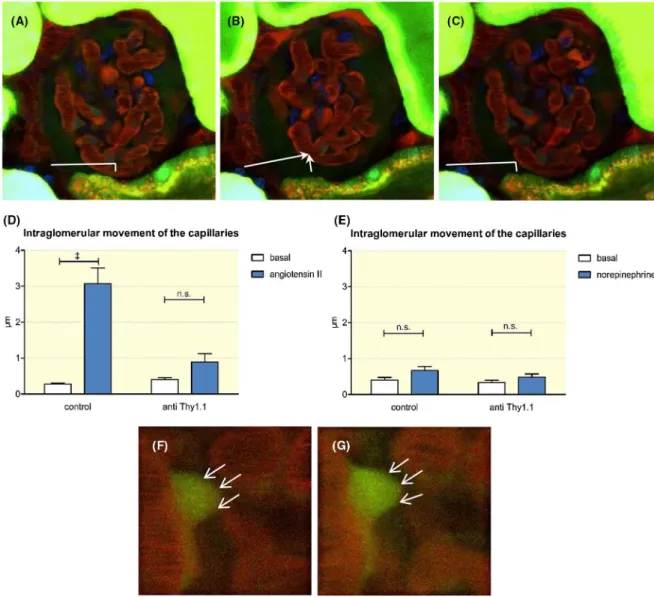
made a rotating movement during the infusion of angioten- sin II, as shown in the accompanying video. This movement resembled a contraction of the entire glomerular capillaries towards the vascular pole (video S1). Compared to the sta- ble tubular system surrounding them, the glomerular capil- laries moved approximately 3.07 ± 0.41 µm (n = 7) within the glomerulus (Figure 4). This phenomenon was restricted to control rats and was completely absent in anti- Thy1.1- treated rats (Figure 4). In contrast to those observed after the infusion of angiotensin II, no movements of the glomerular capillaries were observed after the infusion of norepinephrine despite similar increases in arterial blood pressure (Figure 4;
video S1).
To assess whether the rotation of the glomerular capillar- ies may be related to the angiotensin II- induced contraction of the afferent arteriole, we next determined the responsive- ness of the preglomerular vessels to angiotensin II. Afferent arterioles were identified by the acquisition of z- stacks and determination of the blood flow direction. As shown in Figure 5, the afferent arterioles of control rats constricted in response to angiotensin II. The diameter of the afferent arte- rioles averaged 6.41 ± 0.32 µm before and 5.11 ± 0.34 µm after the application of angiotensin II (P = .01). The afferent arteriolar diameter at baseline tended to be larger in the anti- Thy1.1- treated animals (8.43 ± 0.5 nm) and to show similar contractions in response to angiotensin II (7.17 ± 0.46 nm;
P = .01) (Figure 5). In view of the preserved afferent arteriolar
constrictor responses, we hypothesized that mesangial cell contractions account for the movement of the glomerular capillaries induced by angiotensin II. To test this hypothesis directly, changes in the shape of mesangial cells were deter- mined intravitally during the application of angiotensin II.
As shown in Figure 4, mesangial cells contracted in response to angiotensin II, as judged by the changes in the cell shape and the concentration of the accumulated Lucifer yellow dye.
2.4 | Mesangial cells are involved in the maintenance of the integrity of the glomerular filtration barrier
Although mesangial cells are not a constituent of the glomeru- lar filtration barrier, they support the structure of the glomeru- lus and may exert pulling forces on the glomerular basement membrane.5 Therefore, we next addressed the role of mesangial cells in the integrity of the glomerular filtration barrier. Using intravital multiphoton microscopy, we determined the glomeru- lar sieving coefficient for albumin (GSCA) as a measure of the function of the filtration barrier. In control rats, the GSCA was very low, averaging 0.00061 ± 0.00004 (n = 76) (Figure 6). In contrast, in anti- Thy1.1- treated rats, the GSCA was markedly increased (0.00320 ± 0.00059; n = 30; P < .001). An infusion of the known pro- proteinuric agent angiotensin II (80 ng/kg/
min) led to a significant increase in the GSCA of control rats
FIGURE 3 In vivo quantification of the glomerular capillary flow velocity and the capillary flow. Effect of an infusion of angiotensin II (80 ng/kg/min) (A) and norepinephrine (160 ng/kg/min) (B) on the capillary flow velocity in control and anti- Thy1.1- treated rats. Capillary flow in control and anti- Thy1.1- treated rats after the infusion of angiotensin II (C) and norepinephrine (D). +++Indicates P < .0001
(0.00121 ± 0.00015; n = 29; P < .001). In contrast to changes in control rats, we observed no significant angiotensin II- induced changes in the GSCA after anti- Thy1.1- mediated depletion of mesangial cells. Thus, the GSCA averaged 0.0032 ± 0.00059 before and 0.0042 ± 0.00096 after angiotensin II infusion, (n = 20; p = n.s.) (Figure 6).
In addition to the intravital measurement of the GSCA, immunostaining indicated an increase in albumin filtration in anti- Thy1.1- treated rats. Thus, we observed the upregulation of albumin uptake in anti- Thy1.1- treated rats and increased albumin staining in the proximal tubule (Figure 7). Next, urinary albumin excretion was quantified by SDS- PAGE. As shown in Figure 7, compared with that in control animals, the urinary albumin/osmolarity ratio increased 21- fold after the
depletion of mesangial cells. Thus, basal albumin excretion, which was determined as the albumin concentration/osmo- larity ratio, was 0.61 ± 0.03 [(mg/ml)/(osmol/l)] in control and 12.9 ± 0.55 [(mg/mL)/(osmol/L)] in anti Thy1.1- treated rats (P < .001; n = 14) (Figure 7).
2.5 | Assessment of the ultrastructure of the glomerular filtration barrier after mesangial cell depletion
To assess the ultrastructural consequences of mesangial cell depletion on the integrity of the glomerular filtration barrier, we next performed electron microscopy studies.
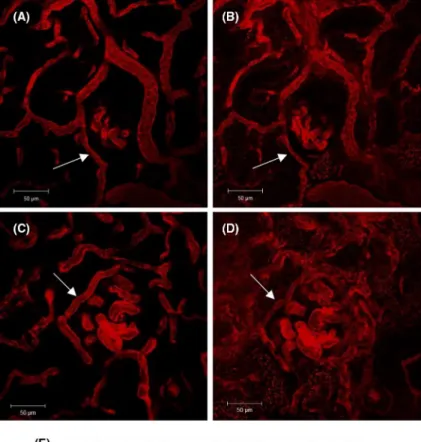
FIGURE 4 Movement of the glomerular capillaries within Bowman's space (see also the movie S1). A, The glomerular capillaries remain in a basal position during an infusion of saline (0.16 µl/g). B, During the infusion of angiotensin II (80 ng/kg/min) a rotating movement of the glomerular capillaries was observed. The movement of the capillaries was measured in relation to the stable tubular system. C, The infusion of angiotensin II was stopped, and the glomerulus returned to the initial position. The intraglomerular movements of capillaries in control and anti- Thy1.1- treated rats were quantified during the infusion of angiotensin II (D) and norepinephrine (E). A contraction of mesangial cells was also visualized by intravital microscopy. F, During an infusion of saline, the mesangial cell shape (thin arrows) remained unchanged, whereas an infusion of angiotensin II led to a contraction, which was accompanied by increased fluorescence intensities (thin arrows) (G). +++Indicates P < .0001
Transmission electron microscopy showed that mesangial cell depletion affected the ultrastructure of critical compo- nents of the glomerular filtration barrier. Thus, we observed subtle abnormalities in podocytes 24 hours after anti- Thy1.1 infusion. The anti- Thy 1.1- treated rats had enlarged pedicles in podocytes (562.7 ± 28.2 nm; n = 329) compared to those in control animals (411.4 ± 14.6 nm; n = 392; P < .0001)
(Figure 8). Similarly, the number of pedicles per micrometre decreased after mesangial cell depletion. Whereas the control animals had 2.05 ± 0.08 podocyte pedicles per micrometre, anti- Thy1.1- treated rats had 1.50 ± 0.07 pedicles per micro- metre (n = 24, P < .0001). The size of the slit diaphragm, how- ever, remained unaltered (control: 65.0 ± 1.9 nm, n = 679;
anti- Thy1.1:59.4 ± 2.5 nm, n = 482 (n.s.)). Based on a cell
FIGURE 5 Diameter of afferent arterioles: The afferent arteriole diameter was determined in control rats before (A) and after (B) a 20- minute infusion of angiotensin II (80 ng/kg/min). The same experiment was performed in anti- Thy1.1- treated rats before (C) and after (D) an infusion of angiotensin II. The impact of angiotensin II on the diameter of the afferent arterioles was quantified in control (E) and anti- Thy1.1- treated rats (F)
count after immune staining for podocin, there was no loss of podocytes. The number of podocytes averaged 1.5 ± 0.1 and 1.6 ± 0.15 × 10⁻³ cells/µm2 respectively (n.s.). Additionally, mesangial cell depletion affected the thickness of the glo- merular basement membrane. The average thickness of the basement membrane was 130.8 ± 3.1 and 170.6 ± 5.7 nm in control and anti- Thy1.1- treated rats respectively (n = 54;
P < .0001) (Figure 8).
3 | DISCUSSION
In this study, we used intravital microscopy to assess me- sangial cell functions in living rats. The use of multiphoton microscopy provided us with a noninvasive view of the intact kidney and facilitated the real- time assessment of the func- tion of mesangial cells.18
To assess the function of mesangial cells in vivo, we used a well- established depletion model. The anti- Thy1.1 antibody model has been used in several studies to deplete mesangial cells in the glomerulus.7,17,20,21,23 Similar to the results of previous studies, we observed that the anti- Thy1.1 antibody specifically bound to the Thy1.1 antigen, as de- termined by immunohistochemistry. The lysis of mesangial cells upon Thy1.1 antibody application has been shown to be complement- dependent and highly mesangial cell- specific.21 The degree of mesangial cell depletion depends on the amount of time that elapses after the application of the antibody. Thus, after 24 hours, we observed the loss of 82 ± 3% of mesangial cells, which is comparable to what was observed in previous studies.4,5
In the first step, we addressed the role of mesangial cells in the regulation of the snGFR. The snGFR is regulated by various systemic and local parameters.24- 26 The tone of the afferent and, to a lesser degree, of the efferent arteriole are generally considered the predominant effectors of this reg- ulatory system.24,27 In addition to the afferent and efferent arterioles, micropuncture studies have suggested that me- sangial cells may also regulate the snGFR based on their contractile phenotype.6,17,23 Here, we assessed the regulation of the snGFR by mesangial cells by intravital multiphoton microscopy. In contrast to the techniques used in previous mi- cropuncture studies, intravital microscopy is considered less invasive because it involves fewer manipulations of the site of interest, such as the placement of the kidney into a Lucite cup and the insertion of micropipettes. The baseline snGFR determined by multiphoton microscopy was within a simi- lar range to that reported previously for MFW rats based on micropuncture experiments.2,4,5,17,28 Similarly, the infusion of angiotensin II led to a significant decrease in the snGFR in control rats.23,29 It has been suggested that the preferential constriction of the afferent versus the efferent arteriole and a concomitant reduction in the net renal plasma flow account for the effect of angiotensin II on the snGFR.24,25 To deter- mine the contribution of mesangial cells to the regulation of the snGFR, mesangial cells were depleted by anti Thy1.1 an- tibody application. Subsequent to mesangial cell depletion, the baseline snGFR was reduced significantly. According to our data, the loss of mesangial cells caused the fusion of the glomerular capillaries and hence the formation of vascular sacs that replaced the normal capillary network.5,6 As a func- tional consequence, the glomerular capillary flow velocity
FIGURE 6 Intravital measurement of the GSCA. A, GSCA of control rats compared to the GSCA after mesangial cell depletion.
Effect of angiotensin II (80 ng/kg/min) on the GSCA in control (B) and anti- Thy1.1- treated rats (C). +++Indicates P < .0001
was reduced in Thy1.1 rats compared with that in controls.
The fusion of the glomerular capillaries presumably resulted in a reduced total filtration area and, subsequently, a reduced snGFR under baseline conditions. Regarding the effects of mesangial cell depletion on the baseline snGFR, the data in the literature are controversial, with studies reporting either a reduced or an unaltered baseline snGFR.17,23 These discrep- ancies may be related to the specific experimental conditions, including the degree of mesangial cell loss.
Strikingly, we found that after the infusion of angiotensin II, the snGFR remained largely unaltered when mesangial cells were depleted, despite the preservation of the vascular re- activity of the afferent arterioles. These data suggest that me- sangial cells directly contribute to the regulation of the snGFR in response to angiotensin II. In this context, mesangial cells have been shown to express functional angiotensin AT1 re- ceptors and show a contractile cell phenotype in vitro.6,12,13 Similar to the results of in vitro studies, we observed that mesangial cells contract in response to angiotensin II in vivo.
In line with the evidence of functionally relevant mesangial cell contractions, we found that after mesangial cell depletion angiotensin II no longer altered capillary flow. Since afferent
arteriolar reactivity was not compromised after mesangial cell depletion, this finding again suggests that mesangial cells ac- tively modulate the haemodynamics within the glomerulus. It should be noted that after mesangial cell depletion, there was a nonsignificant trend of change for all measured haemody- namic parameters in response to angiotensin II, which may be mediated by the small population of surviving mesangial cells and/or by the reactivity of preglomerular resistance vessels.
Commensurate with the evidence of the regulated contrac- tility of mesangial cells, we observed a marked movement of the glomerular capillaries within Bowman's space during the infusion of angiotensin II. This observation was restricted to control rats and was completely absent after mesangial cell depletion. Additionally, no glomerular capillary movement was observed after the infusion of norepinephrine, suggesting that it was a direct consequence of an AT1 receptor- mediated effect rather than an indirect consequence of the rise in renal perfusion pressure. Overall, these data again suggest that me- sangial cells in vivo are contractile and consequently, may actively contribute to the regulation of the snGFR.
In the next set of experiments, we addressed the role of me- sangial cells in the integrity of the glomerular filtration barrier.
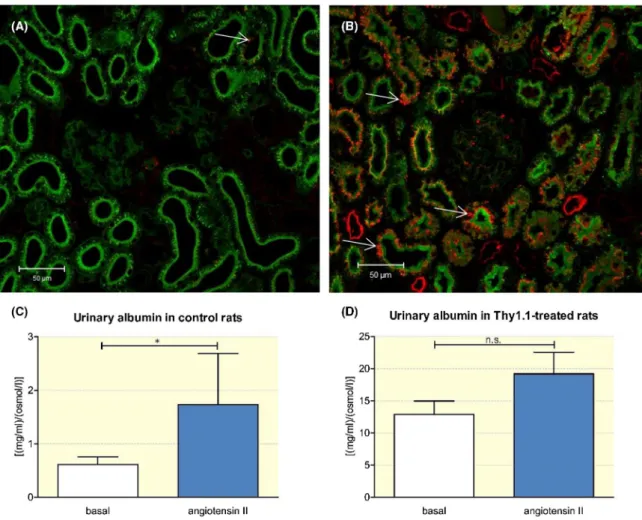
FIGURE 7 Urinary albumin excretion in control and anti- Thy1.1- treatd rats. Immunostaining illustrates the tubular uptake of albumin in control (A) and anti- Thy1.1- treated rats (B) (thin arrows). To quantify the urinary albumin excretion, SDS- page was performed. The impact of angiotensin on the urinary albumin excretion was measured in control rats (C) and Thy1.1- treated rats (D) by SDS- page. +Indicates P < .05
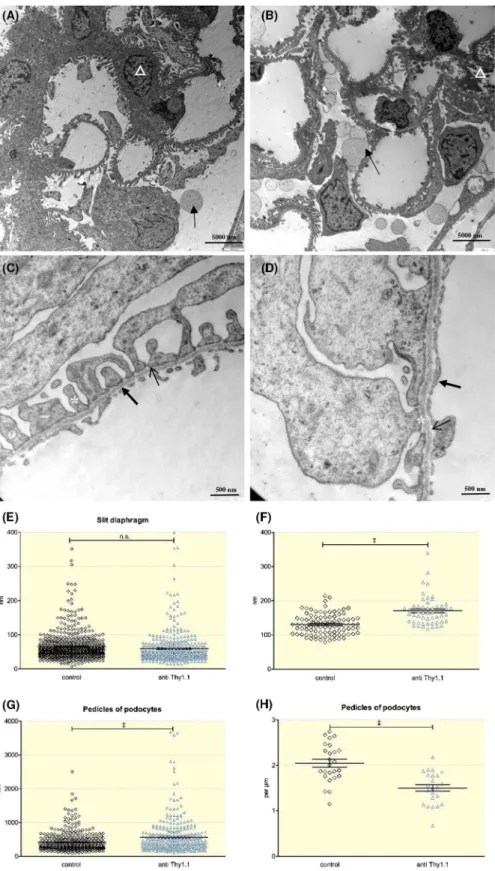
FIGURE 8 Electron microscopy studies visualize the ultrastructural consequences of mesangial cell depletion. Overview of a control (A) and an anti- Thy1.1- treated rat glomerulus (B) (magnification: 3000 x). The majority of mesangial cells (triangle) were depleted 24 h after the application of the anti- Thy1.1 antibody. Arrows indicate albumin- containing vesicles. A close- up view of a control (C) and an anti- Thy1.1- treated rat glomerulus (D) (magnification: 20 000x) with a detailed view of the glomerular basement membrane (thick arrows), the slit diaphragm (thin arrows) and the pedicles of the podocytes (asterisks). The structural consequences of mesangial cell lysis were determined for the size of the slit diaphragm (E), the thickness of glomerular basement membrane (F), the width of pedicles of podocytes (G) and the number of pedicles per micrometre (H). +++Indicates P < .0001
The glomerular sieving coefficient of large plasma proteins is an established measure of the integrity of the glomerular fil- tration barrier. In this study, the basal glomerular sieving coef- ficient for albumin, GSCA, in control rats was extremely low, similar to what was observed in previous studies using mul- tiphoton microscopy.29,30 A low GSCA was also observed in several micropuncture studies, suggesting that the GSCA in rats is in the range of 0.0003- 0.0006.31,32 Regarding the relevance of mesangial cells to the integrity of the glomerular filtration barrier, we made two key observations. First, the loss of me- sangial cells was accompanied by a marked increase in the permeability of the filtration barrier for albumin. Second, the pro- proteinuric hormone angiotensin II had no significant ef- fect on the GSCA in rats after mesangial cell depletion. The first finding is in agreement with that of other studies showing the enhancement of albumin filtration in anti- Thy1.1- treated rats, suggesting that mesangial cells play a crucial role in the main- tenance of the integrity of the glomerular filtration barrier.20,33 In addition, glomerular diseases with various aetiologies, which affect the function of mesangial cells, are usually accompanied by albuminuria.8,9,34 For example diabetic nephropathy leads to the expansion of the glomerular matrix, the loss of mesangial cells, and eventually results in increased urinary albumin excre- tion.9,35 In an attempt to address how mesangial cells support the structural integrity of the glomerular filtration barrier, we performed an ultrastructural analysis by transmission electron microscopy. One key finding was that the depletion of me- sangial cells caused an increase in the thickness of the glomer- ular basement membrane. In an intact glomerulus, mesangial cells and the glomerular basement membrane are connected in some areas by attachments and indirectly via microfibrils.36 Assuming that the glomerular basement membrane is a com- pressible ultrafilter,37 changes in the thickness of the glomer- ular filtration barrier are expected to have a direct impact on the total permeability of the filter. According to this theory, the pedicles of intact podocytes counteract the filtration pres- sure and decrease the permeability of the glomerular basement membrane.22,37 Similarly, mesangial cells may contribute to the compression of the glomerular basement membrane in its basal aspect. Consequently, a loss of mesangial cells may lead to di- minished compression and therefore to increased permeability of the glomerular basement membrane. A similar effect on the compression of the glomerular basement membrane would be expected during the contractions of intact mesangial cells, and, consequently, may contribute to the pro- proteinuric effects of angiotensin II.29
In addition to an increase in the thickness of the glomer- ular basement membrane, we observed a broadening of the podocyte foot processes in Thy1.1- treated rats, whereas the slit diaphragm remained unaffected. A fusion of foot pro- cesses as a consequence of mesangial cell injury was also described in other studies.3 Although the exact reason for this phenomenon remains unclear, one may speculate that the
fusion of the podocyte foot processes may be related to an increase in pressure stress because of the loss of the counter- acting forces provided by mesangial cells.
In this context, it should be noted that, in addition to their mechanical and haemodynamic functions, mesangial cells provide a microenvironment by the secretion of trophic factors. Trophic signalling molecules released by mesangial cells include factors such as TGF- ß1, VEGF, PDGF, FGF- 1 and FGF- 2.3 These factors may also contribute to the main- tenance of the integrity of the glomerular filtration barrier.3 Consequently, the depletion of mesangial cells may have de- prived the glomerular environment of locally acting trophic factors and may contribute to the structural abnormalities ob- served in the electron microscopy analysis.
Together, these findings suggest that mesangial cells in- teract functionally with other components of the glomerular filtration barrier and, consequently, are indispensable for maintaining a low GSC for plasma proteins.
The MWF rat strain is an excellent model for the in vivo analysis of the function of the glomerulus because it features numerous superficially located glomeruli, facilitating multi- photon microscopy. Nevertheless, as a limitation of the study, it needs to be considered that the MWF strain, as a model of low nephron number, is known for its age- and gender- dependent progression of albuminuria and hypertension. For this reason, we used young female rats for the experiments. Although most of the experiments focused on changes after anti- Thy1.1 appli- cation, that is changes within a 24 hours time frame, we cannot exclude that some pre- existing damage may have influenced the functional results, at least quantitatively. If so, the degree of preexisting renal pathology presumably was minor, as we ob- served no signs of hypertension or increased albumin excretion in young female MWF rats at baseline.
In summary, our data suggest that mesangial cells have a contractile phenotype and actively contribute to the regula- tion of the snGFR in vivo. Furthermore, mesangial cells are crucially involved in the maintenance of the integrity of the glomerular filtration barrier, in part by modulating the thick- ness of the glomerular basement membrane.
4 | METHODS
All the material submitted for this study is conformed with good publishing practice in physiology, as outlined in detail previously.38
Animals. All experiments were performed on female Munich Wistar Froemter rats (MWF) aged 7- 11 weeks with a body weight of 140- 210 g. The animals were derived from a breeding colony at the University of Regensburg and had free access to food and tap water.
Study approval. All animal experiments were approved by the local government and were performed according
to the National Institutes of Health´s Guidelines for the Use of Laboratory Animals and the recommendation of the Federation of European Laboratory Animal Science Associations (FELASA).
Anti Thy1.1 antibody. For the administration of the anti- Thy1.1 antibody, rats were sedated with isoflurane (2.5- 5.0 Vol%) for approximately 5 minutes. The anti- Thy1.1 anti- body (1 µg/g; Sino Biological) was applied by using an in- travenous catheter (26 G; Beckton Dickinson) via the lateral tail vein (0.5 µL/g). The control rats were prepared identi- cally, except that they received an injection of PBS (0.5 µL/g) instead of the anti Thy1.1 antibody. After 24 hours the rats were prepared for intravital microscopy or fixed for further histological examination.
Preparation for intravital imaging. For the intravital mi- croscopy rats were anaesthetized with isoflurane (2.5- 5.0 Vol%) and an infusion of fentanyl (5 µg/kg/h). The right ca- rotid arteria was cannulated by a hand- drawn polyethylene tube to measure the mean arterial blood pressure and the heart rate continuously. Additional tubes were inserted into the right jugular vein and connected to an infusion pump for the intravenous infusion of angiotensin II, norepinephrine or saline and for the injection of fluorescent dyes or further drugs. For the intravital imaging, the left kidney was exposed by flank incision and connected to a homemade fenestrated ring that prevented movement artifacts.
Intravital multiphoton microscopy. The intravital study was performed using a Zeiss LSM 710 NLO confocal flu- orescence microscope (Carl Zeiss Jena). A warming plate maintained the body temperature of the animal. The heart rate and the mean arterial blood pressure were measured continuously and recorded by PowerLabs (AD Instruments).
Excitation was achieved with a Chameleon Ultra- II MP laser (Coherent) at 860 nm with a laser power equivalent to 7% of 3200 mW. The resulting emissions were collected by external detectors (non- descanned detector: green channel: beamsplit- ter 500- 550, longpass (LP) 555; red channel: beamsplitter P 565- 610 mirror included). For all intravital studies, a 40x long distance (LD) C- Apochromat 40/1.1 water immersion objective was used.
The gain and offset settings were as follows:
Determination of the albumin GSC: Master Gain: green 530, red 500 Digital Gain: 10 Digital Offset: green −750; red
−1800; power: 4.0%, 800 nm.
Measurement of snGFR: Master Gain: green 700, red 566 Digital Gain: 10 Digital Offset: green −750; red 0, power:
4.5%- 7% 800 nm.
Determination of capillary flow: Master Gain: green 530, red 550 Digital Gain: 10 Digital Offset: green −2.93; red 0, power: 5%- 7% 800 nm.
To label the vasculature, a 5 mg/ml solution of an Alexa Fluor 594 BSA conjugate (Invitrogen) was dissolved in PBS and purified via Nanosep Centrifugal Devices
(30 kDa, Pall Life Sciences) before being injected intrave- nously (1.3 µL/g).
Determination of the GSCA. The GSCA is the ratio of the albumin concentration in Bowman's space and that in the plasma. Measurements were performed as reported previ- ously.29 All images were obtained at a depth of 30 µm un- derneath the kidney capsule, which was identified at the beginning of the experiment by second harmonic generation (SHG) detection. All measurements consisted of a time series of six pictures (512 × 512 dpi), which were obtained at an interval of 10 seconds. Before the Alexa Fluor 594 BSA con- jugate was injected, the background intensity was measured in 4- 5 superficial glomeruli. Afterwards, the fluorescent dye was applied, and a z- stack was recorded for the selected glomeruli, to create a three- dimensional reconstruction of each glomerulus and to ensure that the measured intensity in Bowman's space was not affected by nearby capillaries. To determine the GSCA, the initial measurements were repeated 10 minutes after the dye was applied. For the evaluation of the background intensity, three regions of interest (ROIs) were measured within the glomerulus, in each of the six pictures. Furthermore, additional measurements were made after the fluorescent dye application. At this point, three ROIs were selected within the capillaries and two ROIs within Bowman's space. The intensity of the ROIs was measured by Zen MeanROI (Zen2011; Zeiss). Based on these data, the GSCA could be calculated according to the concentration of albumin in Bowman's space minus the background intensity divided by the concentration of albumin in the plasma minus the background intensity.
Estimation of the renal blood flow. The red blood cell ve- locity is an index of renal blood flow and was determined by intravital microscopy of the glomerular capillaries according to methods described in previous studies.18 Using the Alexa 594 BSA conjugate to label the circulating plasma, the red blood cells appear as dark, non- fluorescent objects in the im- ages. A line scan was performed along the central axis of a capillary and 500 repetitive scans (125 X 125 dpi) were obtained within 0.36 seconds to determine the motion of the red blood cells in the glomerular capillaries. The motion of red blood cells became visible as dark bands in the respective data set whereby, the velocity was indirectly proportional to the slope. The time required for movement and the distance were measured by ZEN graphics (ZEN 2011; Zeiss), and the capillary flow velocity was calculated. The capillary flow was calculated as the product of the capillary flow velocity and the cross- sectional area of the respective capillary. To determine the cross- sectional area, the diameter of the capil- laries was also measured by ZEN graphics.
Measurement of snGFR and plasma creatinine.29 The single nephron glomerular filtration rate (snGFR) was quantified in four animals using multiphoton microscopy as snGFR = V[nl]/Δt[s]. In each animal, four superficial
glomeruli were selected and the first 60 μm of the proximal tubule was positioned within the same optical section. For each measurement, a movie was captured during a bolus in- jection (5 μL) of a 2.5 mg/mL LY solution. The time differ- ence between the fluorescence maximum was measured in ROI 1, which was positioned at the beginning of the proximal tubule, and in ROI 2, which was positioned 60 μm down- stream of ROI 1. For the determination of the tubular fluid volume V, a z- stack was acquired with decreased laser power (18%), and the diameter of the first 60- μm intercept was mea- sured. The tubular fluid volume was then calculated accord- ing to the formula: V = [length × (diameter/2)2 × π]. The values for the snGFR were calculated as the mean of five measurements. Changes in the snGFR during the infusion of angiotensin II were assessed as paired observations. Plasma creatinine was determined by standard protocols (IDEXX Germany, Kornwestheim, Germany).
Study design. All intravital studies were per- formed equally by control and anti- Thy.1.1- treated rats.
Measurements were made before and after a 20- minutes infusion of angiotensin II (80 ng/kg/min), norepinephrine (160 ng/kg/min) or saline. Angiotensin II (Sigma) was diluted to a concentration of 0.5 µg/mL and was infused continuously (0.16 µL/g/min) for at least 20 minutes after the basic measurements. An equivalent rise in the mean arterial blood pressure was achieved by a 20- minute infu- sion (0.16 µL/g/min) of norepinephrine (Sanofi), which was diluted to a concentration of 1 µg/mL. Control studies were performed using an infusion of saline (0.16 µL/g/min;
Braun, 0.9% saline solution).
Intravital visualization of a capillary movement. To determine the possible effects of angiotensin II or nor- epinephrine on the whole glomerulus time series were recorded (one image per 3.88 seconds) for approximately 7 minutes. At the beginning of each time series saline was infused (0.25 µL/g), which was followed by an infusion of angiotensin II (125 ng/kg/min) or norepinephrine (250 ng/
kg/min). The movement of the intraglomerular capillaries was measured in relation to that of the surrounding tubular system.
Intravital visualization of mesangial cells. To visualize the mesangial cells by intravital microscopy, an infusion of lucifer yellow (0.125 mg/min) was applied for 20- 25 minutes, which accumulated in the mesangial cells.39 To determine the fraction of antibody- induced mesangial cell lysis, the me- sangial cells were counted in the glomeruli of control and anti- Thy1.1- treated rats. For this purpose, z- stacks of glomer- uli were acquired, and the number of mesangial cells located within 15 slices (1 slice = 1 µm) was determined.
Tissue fixation. The animals were killed by pentobarbital- sodium injection (400 µg/g) and perfused by 1 mL/g of hep- arinized saline (0.9% saline solution: Braun; heparin: Roche 5000 IE/ml; diluted 1000:1), followed by 1 mL/g of a 3%
paraformaldehyde solution (pH 7.35) dissolved in PBS (para- formaldehyde: Merck; PBS: Sigma Aldrich). Perfusion was conducted at a constant perfusion pressure of 70 mmHg via the abdominal aorta. Afterwards, the fixed kidneys were pre- pared for paraffin sections or transmission electron micros- copy. Immunohistochemistry. Immunohistochemistry was performed on paraffin slices (5 µm) of the rat kidney. The following antibodies were used: goat anti- albumin antibody IgG (1:200; Abcam, Inc), mouse anti Thy1.1 antibody IgG (1:200; Sino Biological). As secondary antibody for immu- nostaining a mouse or goat Cy5- conjugated antibody IgG (1:200; Abcam, Inc) was used. The staining was examined by an Axiovert Observer microscope (Carl Zeiss).
Transmission electron microscopy. For electron micros- copy studies, the perfused kidneys were fixed in 0.1 mol/L glutardialdehyde solution dissolved in sodium- cacodylate- buffer and stained with osmium tetroxide solution. After de- hydration, the kidneys were finally embedded in Epon. Slices were made by using an ultramicrotome (UC Leica EM) and contrast staining was performed with uranyl acetate and lead citrate. For examination, a 902 transmission electron micro- scope (Carl Zeiss) was used.
Urinary albumin excretion. Spontaneous, spot urine samples were collected. Additionally, urine samples were collected after a 25- minute infusion of angiotensin II, nor- epinephrine or saline during intravital imaging. For this purpose, the urinary bladder was punctured with an insulin syringe (30 G, U 40: Beckton Dickinson). To determine the impact of the mesangial cell lysis on urinary albumin excre- tion the albumin content of the samples was quantified by SDS- PAGE. Therefore, the urine samples were diluted 1:7.5 to 1:120. The samples were separated at 100 V on a 10%
SDS gel. Subsequently, each SDS- PAGE gel was stained with Coomassie blue (Roth). To quantify the content of al- bumin, densitometry was performed (Chemi- Doc- Touch- Imaging- System) and interpolated according to a standard curve (ImageLab 6.0). Finally, the quantity of albumin was corrected for the sample dilution and the osmolarity of the urine.
Statistical analysis. Data were analysed by a paired or unpaired t- test using Prism 5 or by one- way ANOVA with a Bonferroni post hoc test (Graph Pad). The results are expressed as the mean ± SEM P < .05 was considered significant.
ACKNOWLEDGEMENTS
The expert technical assistance provided by Helga Othmen and Bernhard Gess is gratefully acknowledged. This study was in part supported by a grant from the Deutsche Forschungsgemeinschaft (387509280, SFB 1350).
CONFLICT OF INTEREST None to declare.
DATA AVAILABILITY STATEMENT
The data that support the findings of this study are available from the corresponding author upon reasonable request.
ORCID
Hayo Castrop https://orcid.org/0000-0002-0891-7900 REFERENCES
1. Christensen JA, Meyer DS, Bohle A. The structure of the human juxtaglomerular apparatus: amorphometric, light microscopic study on serial sections. Virchows Arch A Pathol Anat Histol.
1975;367(2):83- 92.
2. Schlöndorff D. Roles of the mesangium in glomerular function.
Kidney Int. 1996;49:1583- 1585.
3. Schlöndorff D, Banas B. The mesangial cell revisited: no cell is an island. J Am Soc Nephrol. 2009;20(6):1179- 1187.
4. Yamamoto T, Wilson CB. Quantitative and qualitative studies of antibody- induced mesangial cell damage in the rat. Kidney Int.
1987;32(4):514- 525.
5. Kurihara H, Sakai T. Cell biology of mesangial cells: the third cell that maintains the glomerular capillary. Anat Sci Int.
2017;92(2):173- 186.
6. Schlöndorff D. The glomerular mesangial cell: an expanding role for a specialized pericyte. FASEB J. 1987;1:272- 281.
7. Cove- Smith A, Hendry BM. The regulation of mesangial cell pro- liferation. Nephron Exp Nephrol. 2008;108(4):e74- e79.
8. Wada T, Shimizu M, Yokoyama H, et al. Nodular lesions and mesangiolysis in diabetic nephropathy. Clin Exp Nephrol.
2013;17(1):3- 9.
9. Pecoits- Filho R, Abensur H, Betônico C, et al. Interactions be- tween kidney disease and diabetes: dangerous liaisons. Diabetol Metab Syndr. 2016;8:1- 21.
10. Schmitt R, Ståhl A- L, Olin AI, et al. The combined role of galactose- deficient IgA1 and streptococcal IgA- binding M Protein in inducing IL- 6 and C3 secretion from human me- sangial cells: implications for IgA nephropathy. J Immunol.
2014;193(1):317- 326.
11. Rodrigues JC, Haas M, Reich HN. IgA nephropathy. Clin J Am Soc Nephrol. 2017;12(4):677- 686.
12. Ausiello DA, Kreisberg JI, Roy C, Karnovsky MJ. Contraction of cultured rat glomerular cells of apparent mesangial origin after stimulation with angiotensin II and arginine vasopressin. J Clin Invest. 1980;65(3):754- 760.
13. Singhal PC, Scharschmidt LA, Gibbons N, Hays RM. Contraction and relaxation of cultured mesangial cells on a silicone rubber sur- face. Kidney Int. 1986;30(6):862- 873.
14. Ernsberger P, Zhou J, Damon TH, Douglas JG. Angiotensin II re- ceptor subtypes in cultured rat renal mesangial cells. Am J Physiol.
1992;263(3 Pt 2):F411- F416.
15. Castrop H, Höcherl K, Kurtz A, Schweda F, Todorov V, Wagner C.
Physiology of kidney renin. Physiol Rev. 2010;90(2):607- 673.
16. Blantz RC, Konnen KS, Tucker BJ. Angiotensin II effects upon the glomerular microcirculation and ultrafiltration coefficient of the rat. J Clin Invest. 1976;57(2):419- 434.
17. Yamamoto T, Mundy CA, Wilson CB, Blantz RC. Effect of me- sangial cell lysis and proliferation on glomerular hemodynamics in the rat. Kidney Int. 1991;40(4):705- 713.
18. Peti- Peterdi J, Kidokoro K, Riquier- Brison A. Intravital imaging in the kidney. Curr Opin Nephrol Hypertens. 2016;25(3):168- 173.
19. Schießl IM, Castrop H. Deep insights: intravital imaging with two- photon microscopy. Pflugers Arch. 2016;468(9):1505- 1516.
20. Bagchus M, Hoedemaeker P, Rozing J, Bakker W. Acute glo- merulonephritis after intravenous injection of monoclonal Anti- Thymocyte antibodies in the rat. Immunol Lett. Elsevier Science Publishers Biomedical Division. 1985;86:109- 113.
21. Kato C, Kato A, Adachi K, et al. Anti- Thy- 1 antibody- mediated complement- dependent cytotoxicity is regulated by the distribution of antigen, antibody and membrane complement regulatory pro- teins in rats. J Toxicol Pathol. 2013;26(1):41- 49.
22. Butt L, Unnersjö- Jess D, Höhne M, et al. A molecular mech- anism explaining albuminuria in kidney disease. Nat Metab.
2020;2(5):461- 474.
23. Blantz RC, Gabbai FB, Tucker BJ, Yamamoto T, Wilson CB. Role of mesangial cell in glomerular response to volume and angioten- sin II. Am J Physiol. 1993;264(1 Pt 2):F158- F165.
24. Wilson SK. The effects of angiotensin II and norepinephrine on afferent arterioles in the rat. Kidney Int. 1986;30(6):895- 905.
25. Sraer JD, Kanfer A, Rondeau E, Lacave R. Role of the renin- angiotensin system in the regulation of glomerular filtration. J Cardiovasc Pharmacol. 1989;14(4):21- 25.
26. Navar LG, Inscho EW, Majid SA, Imig JD, Harrison- Bernard LM, Mitchell KD. Paracrine regulation of the renal microcirculation.
Physiol Rev. 1996;76(2):425- 536.
27. Blantz RC, Gabbai FB. Glomerular hemodynamics in pathophysi- ologic conditions. Am J Hypertens. 1989;2(11 Pt 2):208S- 212S.
28. Oite T. Exploring the mechanisms of renoprotection against pro- gressive glomerulosclerosis. Proc Jpn Acad Ser B Phys Biol Sci.
2011;87(3):81- 90.
29. Schießl IM, Castrop H. Angiotensin II AT2 receptor activation attenuates AT1 receptor- induced increases in the glomerular fil- tration of albumin: a multiphoton microscopy study. Am J Physiol Renal Physiol. 2013;305(8):F1189- F1200.
30. Peti- Peterdi J. Independent two- photon measurements of albumin GSC give low values. Am J Physiol Renal Physiol. 2009;296(6):F1 255- F1257.
31. Tojo A, Endou H. Intrarenal handling of proteins in rats using fractional micropuncture technique. Am J Physiol. 1992;263(4 Pt 2):F601- F606.
32. Stolte H, Schurek HJ, Alt JM. Glomerular albumin filtration: a com- parison of micropuncture studies in the isolated perfused rat kidney with in vivo experimental conditions. Kidney Int. 1979;16(3):377- 384.
33. Bagchus MW, Jeunink MF, Elema JD. The mesangium in anti- Thy- 1 nephritis.: Influx of macrophages, mesangial cell hyper- cellularity, and macromolecular accumulation. Am J Pathol.
1990;137(1):215- 223.
34. Donadio JV, Grande JP. IgA nephropathy. N Engl J Med.
2002;347(10):738- 748.
35. Saito Y, Kida H, Takeda S, et al. Mesangiolysis in diabetic glom- eruli: its role in the formation of nodular lesions. Kidney Int.
1988;34(3):389- 396.
36. Sakai T, Kriz W. The structural relationship between mesangial cells and basement membrane of the renal glomerulus. Anat Embryol. 1987;176(3):373- 386.
37. Fissell WH, Miner JH. What is the glomerular ultrafiltration bar- rier? J Am Soc Nephrol. 2018;29(9):2262- 2264.
38. Persson PB. Good publication practice in physiology 2019. Acta Physiol (Oxf). 2019;227(4):e13405.
39. Peti- Peterdi J, Sipos A. A high- powered view of the filtration bar- rier. J Am Soc Nephrol. 2010;21(11):1835- 1841.
SUPPORTING INFORMATION
Additional Supporting Information may be found online in the Supporting Information section.
How to cite this article: Ziegler V, Fremter K, Helmchen J, Witzgall R, Castrop H. Mesangial cells regulate the single nephron GFR and preserve the integrity of the glomerular filtration barrier: An intravital multiphoton microscopy study. Acta Physiol.
2021;0:e13592. https://doi.org/10.1111/apha.13592