Acid Sphingomyelinase
is a critical regulator in cytotoxic granule secretion of primary T lymphocytes
I n a u g u r a l - D i s s e r t a t i o n
zur
Erlangung des Doktorgrades
an der Mathematisch-Naturwissenschaftlichen Fakultät
der Universität zu Köln
vorgelegt von
Jasmin Herz
aus Bergisch Gladbach
Köln 2008
Berichterstatter: Prof. Dr. Martin Krönke
Prof. Dr. Jens Brüning
Tag der Disputation: 01. Juli 2008
1. Introduction ……….. 1
2. Material and Methods………. 8
2.1 Material 2.1.1 Mice……….……… 8
2.1.2 Virus………...…. 8
2.1.3 Cell lines………... 8
2.1.4 Peptide..………... 9
2.1.5 Oligonucleotides (Primer)………..…….….... 9
2.1.6 Chemicals, media, buffers and solutions.………... 10
2.1.7 Antibodies……….…..…..…. 12
2.1.8 Technical equipment..……….…. 14
2.1.9 Kits………..………..………..…… 14
2.2 Methods 2.2.1 Infection of adult mice with the LCMV……….…….. 15
2.2.2 Preparation of LCMV-specific CD8+ T cells from spleens………….……. 15
2.2.3 Cell culture………..…... 16
2.2.4 Infection or peptide loading of target cells with LCMV………..…….. 16
2.2.5 Assay for virus-specific cytotoxicity of CD8+ T cells……….……... 17
2.2.6 Stimulation or inhibition of virus-specific T lymphocytes……….…... 18
2.2.7 Flow cytometry………..… 19
2.2.8 Assays for secretion of cytotoxic granules……….……….….… 20
2.2.9 pRT-PCR analysis of perf-, gzmA- and B-specific mRNA transcripts….. 22
2.2.10 Immunoblotting………..……… 23
2.2.11 Immunological synapse formation……….. 23
2.2.12 Immunofluorescence microscopy………..… 24
2.2.13 Electron Microscopy………..……….. 24
2.2.14 Measurement of ASMase activity……….…. 25
2.2.15 Thin-layer chromatography……….………...….… 25
2.2.16 Measurement of the intracellular calcium-response………..…..….. 26
2.2.17 Measurement of intragranular pH……….. 26
2.2.18 Two-Photon vital microscopy……….….… 27
2.2.19 Radiolabeling of CD8+ T cells with [35S]-sulfate………... 27
2.2.20 Patch-clamp technique……….…… 27
2.2.21 Statistical analysis……….… 29
3. Results .……….. 30
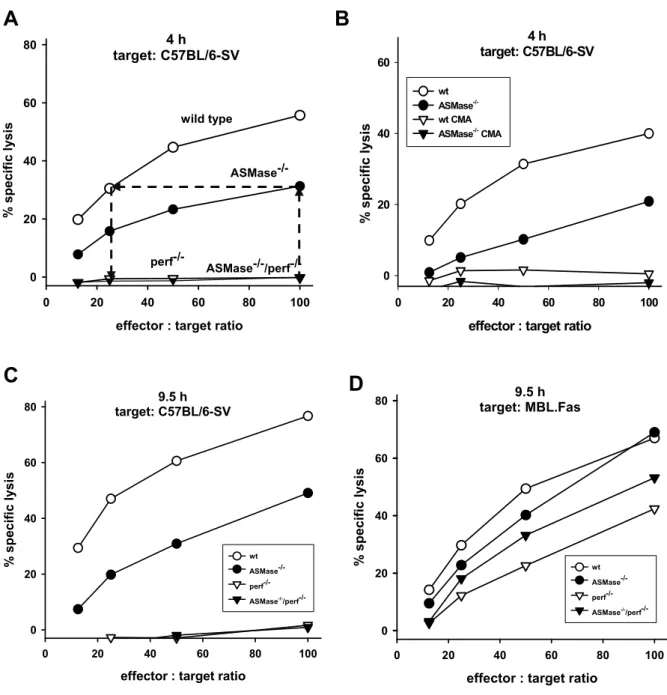
3.1 CD8+ T cells of ASMase-deficient mice are severely impaired in perforin-dependent but not in Fas Ligand-mediated cytotoxicity…… 30
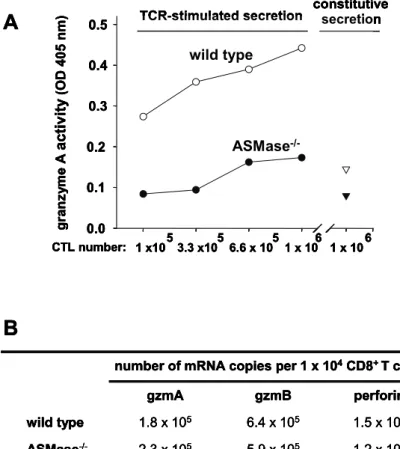
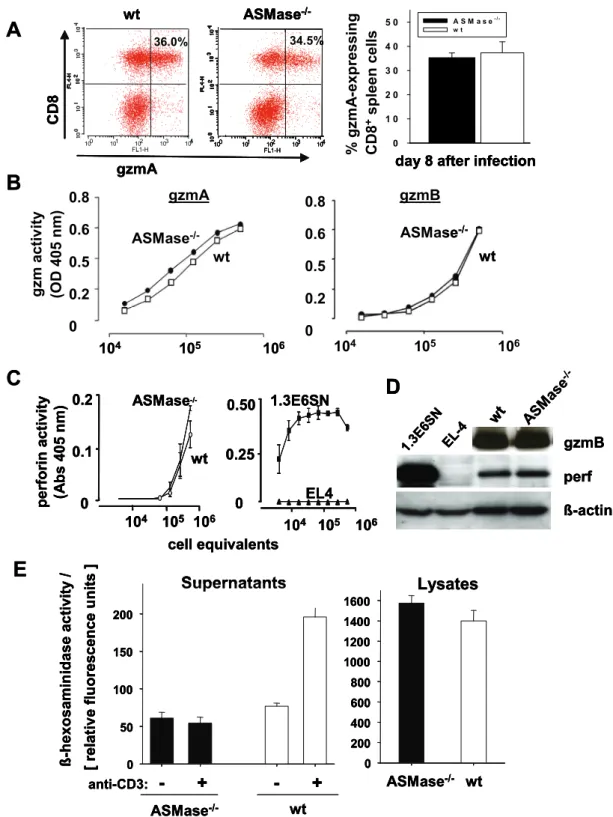
3.2 Impaired secretion of cytotoxic effector molecules by ASMase-/- virus-specific CTL……… 33
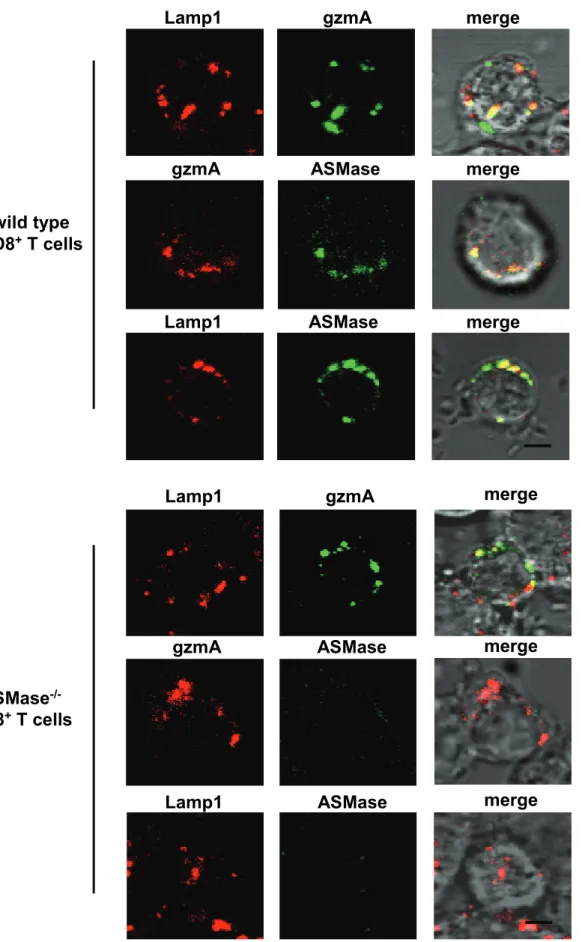
3.3 ASMase localises to lytic granules of CTL……….. 36
mimics the phenotype of ASMase-/- CTL..……….…. 43
3.6 Membrane-lipid composition is not altered in ASMase-/- CD8+ T cells………..… 46
3.7 Calcium-dependent signalling is normal in ASMase-/- T cells……….. 48
3.8 Normal intragranular pH in ASMase-/- CD8+ T cells………..… 50
3.9 Intracellular transport of cytotoxic granules: Polarisation to the immunological synapse and fusion with the plasma membrane….… 52 3.9 Characterisation of cytotoxic granule exocytosis in ASMase-/- CD8+ T cells………..… 56
3.10 Deficiency in ASMase impairs cytotoxicity of CTL independent of the molecular size of granular matrix………..… 63
3.11 Monitoring exocytosis by patch-clamp experiments reveals in ASMase-/- CD8+ T cells larger gains in membrane area than in wt T cells………..……...… 66
4. Discussion………. 68
5. References... 73
6. Abstract... 80
7. Zusammenfassung... 81
Curriculum Vitae... 82
Danksagung... 83
Erklärung... 84
Abbreviations
mAb monoclonal antibody ASMase acid sphingomyelinase
ASMase-/- acid sphingomyelinase deficient mice APC antigen presenting cell
cpm counts per minute CD cluster of differentiation
CMA concanamycin A
CTL cytotoxic T lymphocytes
DTH delayed type hypersensitivity reaction EM electron microscopy
E:T effector : target
ELISA enzyme linked immunosorbent assay FACS fluorescence activated cell sorting
FasL Fas Ligand
Fig. figure
GAG glycosaminoglycane
gzm granzyme
HPRT hypoxanthin:guanine phosporibosyltransferase IFM immunfluorescence microscopy
IFN-γ interferon-gamma
IS immune serum
IU infectious unit
kDa kilodalton
Lamp lysosome-associated membrane protein LCMV Lymphocytic Choriomeningitis virus
LPC lysophosphatidylcholine MACS magnetic cell sorting
MEF mouse embryonic fibroblasts MHC major histocompatibility complex MOI multiplicity of infection
MTOC microtubule organizing center
mRNA messenger RNA
NK cells natural killer cells
PBS phosphate buffered saline PC phosphatidylcholine
PE phosphatidylethanolamine
perf perforin
PFA paraformaldehyde
PFU plaque forming unit PS phosphatidylserine RT-PCR reverse transcriptase PCR SDS sodium dodecylsulfate
SG serglycin
SM sphingomyelin
SMase sphingomyelinase
SNARE soluble N-ethylmaleimide-sensitive factor attachment receptor protein
SRB sulforhodamine B
SV Simian virus
TCR T cell receptor
TEP two-photon extracellular polar-tracer imaging TNF tumor necrosis-factor
WB western blot
wt wild type
1. Introduction
1.1 The Acid Sphingomyelinase
Sphingomyelinases catalyse the hydrolysis of sphingomyelin into ceramide and phosphorylcholine. Seven sphingomyelinases (SMases) are currently known and classified with regard to their pH-optimum, their cellular localisation or their dependency of bivalent metal ions. The Acid Sphingomyelinase (ASMase) is the most intensely characterised among the SMases (Levade and Jaffrezou 1999).
ASMase is expressed ubiquitously in most mammalian cell types. Its name refers to its pH-optimum of about pH 5 and it localises to the extracellular leaflet of the plasma membrane and to the luminal leaflet of lysosomes, phagosomes and endosomes (Kanfer, Young et al. 1966; Krönke 1999; Grassmé, Schwarz et al. 2001; Schneider- Brachert, Tchikov et al. 2004). The ASMase is activated by a number of extracellular ligands binding to their specific cell-surface receptors, e.g. tumour necrosis-factor (TNF), Fas-ligand (FasL or CD95L) or interleukin (IL)-1ß (Schütze, Potthoff et al.
1992; Cifone, Roncaioli et al. 1995). Deficiency in ASMase results in accumulation of sphingomyelin in multilamellar bodies in a variety of cells, among them macrophages and neuronal cells of the cerebellum (Otterbach and Stoffel 1995). Loss of cerebellar cells leads in ASMase-/- humans to Niemann-Pick Disease, type A or B, lethal in early childhood or late and adolescence, respectively. In ASMase-/- mice first clinical symptoms of Niemann-Pick Disease show up at about three months and the mice die at about 9 month of age (Horinouchi, Erlich et al. 1995; Lozano, Morales et al. 2001).
Agonist-induced sphingomyelin hydrolysis by SMases is a major source of ceramide in cells. During recent years, ceramide has received great attention as a possible mediator of various cellular signalling pathways, e.g. programmed cell death, cell differentiation and proliferation (Futerman and Hannun 2004), which, however, has been disputed (Hofmann and Dixit 1998; Hofmann and Dixit 1999;
Kolesnick and Hannun 1999; Perry and Hannun 1999; Watts, Aebersold et al. 1999).
In fact, although direct ceramide interacting partners have been identified in vitro including protein kinases, protein phosphatase 2A, phospholipase A2, and cathepsin D (Zhang, Yao et al. 1997; Huwiler, Fabbro et al. 1998; Heinrich, Wickel et al. 2000;
Chalfant, Szulc et al. 2004), the respective physical interaction has not been demonstrated in intact cells. In light of both, the biophysical properties of ceramide
predicting strict association with the membrane bilayer and the subcellular topology of ceramide generation, the functional consequences of possible interactions of ceramide with specific signalling proteins, especially interactions with cytosolic proteins, remained elusive.
1.2 Effects of ASMase on lipid bilayers
In consideration of the biophysical impact of sphingomyelin hydrolysis on membrane bilayers, the involvement of ASMase in cellular signalling is likely to be indirect. Sphingomyelin and cholesterol interact with each other to form detergent- resistant domains in the plasma membrane, also known as lipid rafts, which are central for the spatial organization of cell-surface receptors. Sphingomyelin hydrolysis within lipid rafts alters the composition of lipid rafts, because ceramide spontaneously self-associates and has the tendency to form ceramide-enriched membrane microdomains (Holopainen, Subramanian et al. 1998). Ceramide generation by ASMase may thus indirectly and non-specifically impact on many signalling pathways through reorganization of cell-surface receptors and their signalosomes (Bollinger, Teichgraber et al. 2005).
Moreover, for comprehensive appreciation of the impact of ASMase activity, it is important to stress that its substrate, sphingomyelin, is an important component of the outer leaflet of the plasma membrane or the intraluminal leaflet of endo- lysosomal vesicles (Futerman and Riezman 2005; Holthuis and Levine 2005). Due to this asymmetric distribution of sphingomyelin and the tendency of ceramide to separate into domains, ASMase-generated ceramide will spontaneously form negative curvatures that in turn lead to membrane invagination (Fig. 1) and budding as previously shown with synthetic liposomes (Holopainen, Angelova et al. 2000).
The impact of ASMase activity and ceramide generation on basic membrane architecture has been implicated by our workgroup as well as by others as a possible mechanism modifying cellular signalling (Krönke 1999; Goni and Alonso 2002;
Bollinger, Teichgraber et al. 2005) and was the conceptual framework of the present study.
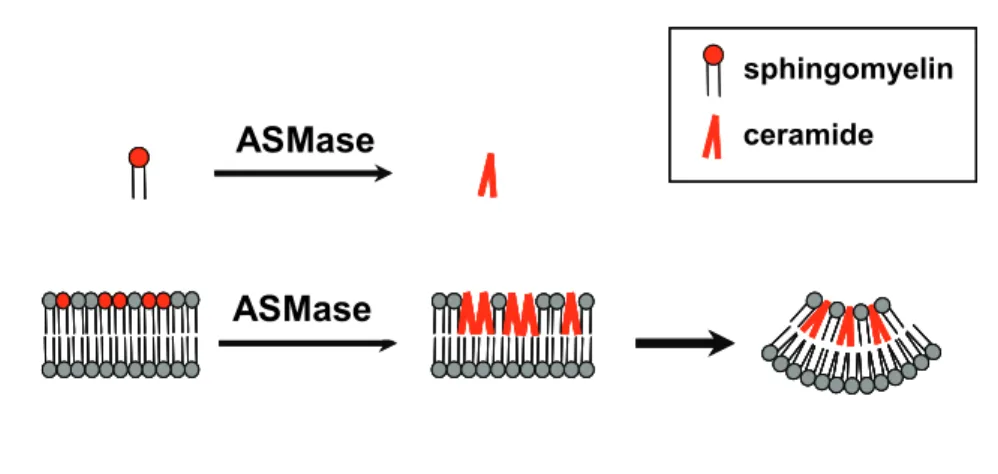
Fig. 1 Effects of ASMase on lipid bilayers
Acid Sphingomyelinase (ASMase) hydrolyses sphingomyelin into ceramide. In lipid bilayers the lipid distribution is asymmetric and generation of the cone-shape ceramide within one leaflet leads to increased surface tension, result in budding of the whole membrane with a negative curvature of the ceramide-containing leaflet.
1.3 Involvement of ASMase in immune responses
ASMase is activated by a number of pro-inflammatory cytokines like TNF, IL-1ß or IFN-γ (Schütze, Potthoff et al. 1992; Cifone, Roncaioli et al. 1995) and localises to phagosomes, lysosomes and endosomes, i.e. those organelles that are essential for bacterial uptake, inactivation and degradation as well as the processing and presentation of antigens. It has been previously shown in our workgroup that ASMase deficient macrophages are strongly impaired in their capacity to kill intracellular bacteria, which results in an increased susceptibility of ASMase-/- mice to infections with e.g. Listeria monocytogenes or Salmonella typhimurium (Utermöhlen, Karow et al. 2003). On the other hand, Grassmé et al. showed that ASMase is required for the uptake of Neusseria gonorrhoeae in vitro (Grassmé, Gulbins et al.
1997) and Pseudomonas aeruginosa in vivo (Grassmé, Jin et al. 2006). Thus, depending on specific characteristics of pathogens, ASMase appears to contribute to various mechanisms of antibacterial defence.
1.4 Acute infection of ASMase-/- mice with the Lymphocytic Choriomeningitis virus
The consequences of ASMase-deficiency on an adaptive immune response in ASMase
ASMase
sphingomyelin ceramide
ASMase
ASMase
sphingomyelin ceramide sphingomyelin ceramide
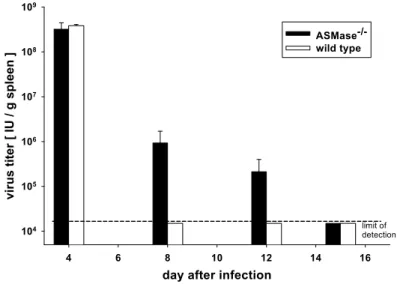
virus (LCMV). The infection of mice with LCMV is one of the best characterised animal models of virus-induced cell-mediated immune responses (Buchmeier, Welsh et al. 1980; Butz and Bevan 1998; Oldstone 2002; Zinkernagel 2002). ASMase- deficient (ASMase-/-) mice cleared acute infection with the LCMV with a significant delay from the spleen (Fig. 2; our unpublished observation). In adult immunocompetent mice, CD8+ cytotoxic T lymphocytes (CTL) are necessary and sufficient to eliminate the LCMV from the spleen during acute primary infection (Buchmeier, Welsh et al. 1980; Moskophidis, Cobbold et al. 1987). Thus, the delayed elimination of LCMV suggested an impaired effector function of CD8+ virus-specific CTL in ASMase-/- mice.
Fig. 2 Delayed clearance of the LCMV from the spleen of acutely infected ASMase-/- mice (unpulished data)
Mice were infected i.v. with 105 IU of the LCMV. At the indicated days after infection, the virus load in the spleen was measured as PFU/g spleen and converted to IU as described in Methods. Shown are the means and standard errors for groups of three mice per day. The limit of detection of the LCMV was 2 x 10⁴ IU/g.
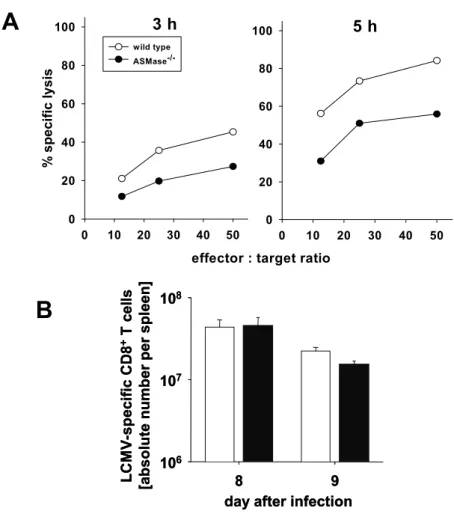
In my Diploma project I found, the virus-specific cytotoxic activity of ASMase-/- CTL to be severely impaired on day 8 after infection in comparison to wild type (wt) littermates (citation Diploma; (Fig. 3A)). Surprisingly, the absolute numbers of LCMV- specific CD8+ T cells per spleen were found to be similar in wt and ASMase-/- mice on day 8 and 9 post infection (p.i.) (Fig. 3B). The aim of this study was to elucidate the ASMase dependent mechanism in virus-specific CD8+ T cells.
A
day after infection
4 6 8 10 12 14 16
virus titer [ IU / g spleen ]
104 105 106 107 108 109
ASMase-/- wild type
limit of detection
Fig. 3 LCMV-specific cytotoxic activity of ASMase-/- CD8+ T cells is impaired despite equal numbers of LCMV-specific CD8+ T cells (Diploma)
Mice were infected i.v. with 105 IU of the LCMV.
(A) At day 8 after infection, wild type or ASMase-/- CD8+ T cells were enriched from splenic single cell suspensions. Cytotoxic activity of CD8+ T cells against LCMV infected C57BL/6 fibroblasts was determined in a 3 h or 5 h Chromium [51Cr] -release assay.
(B) Absolute numbers of CD8+ T cells per spleen expressing TCR-specific for the three major immunodominant epitopes gp33-41, gp276-286 and np396-404 of the LCMV. Data were calculated from the total number of mononuclear spleen cells, the percentage of CD8+ spleen cells and the percentage of epitope-specific CD8+ spleen cells.
1.5 Cytotoxic activity of CD8+ T lymphocytes
CD8+ cytotoxic T lymphocytes induce target cell death by two distinct pathways:
(i) the receptor-mediated pathway and (ii) the usually dominant granule exocytosis
A
day after infection
8 9
LCMV-specificCD8+T cells [absolute numberper spleen]
106 107 108
day after infection
8 9
LCMV-specificCD8+T cells [absolute numberper spleen]
106 107 108 3 h
0 10 20 30 40 50
% specific lysis
0 20 40 60 80 100
wild type ASMase-/-
5 h
0 10 20 30 40 50
0 20 40 60 80 100
effector : target ratio
B
family of receptors, such as Fas. Engagement of Fas receptor on the target cell surface by the Fas Ligand on the surface of the CTL leads to induction of apoptosis via multiple protein-protein interactions involving caspases. The details of the receptor-mediated pathway will not be described here (Kägi, Ledermann et al. 1994;
Barry and Bleackley 2002).
The granule exocytosis pathway as major cytotoxic effector mechanism of CD8+ CTL depends on the exocytosis of cytotoxic granules at the immunological synapse leading to apoptosis of the target cell (Griffiths and Isaaz 1993; Henkart, Williams et al. 1997; Shresta, Pham et al. 1998; Stinchcombe and Griffiths 1999).
Cytotoxic granules were identified as secretory lysosomes (Peters, Borst et al. 1991), a cellular compartment combining both, degradative as well as secretory functions.
Within secretory lysosomes the major cytotoxic effector molecules perforin (perf), granzyme (gzm) A and -B are complexed to an acidified chondroitin sulfate proteoglycan matrix, which reduces the osmolarity allowing storage of cytotoxic effector molecules high concentrated (Raja, Metkar et al. 2003).
1.6 Secretion of cytotoxic granules: mechanistic steps identified so far
In CTL, exocytosis of cytotoxic granules is triggered by ligating the antigen specific T cell receptor (TCR). Upon TCR ligation, cytotoxic granules previously scattered all over the cytoplasm of the cell are polarised towards the immunological synapse, i.e. the contact zone between CTL and its target cell. Polarisation requires directed transport of cytotoxic granules, including the reorientation of the Golgi complex and the microtubule organizing center (MTOC) towards the immunological synapse. Adaptor protein 3 (AP-3) is required for the transport of cytotoxic granules along microtubules toward the MTOC close to the immunological synapse (Clark, Stinchcombe et al. 2003). The immunological synapse is comprised of an outer ring of adhesion molecules and an inner region containing signalling molecules, termed central supramolecular activation complex (cSMAC) (Stinchcombe, Bossi et al. 2001;
Vyas, Maniar et al. 2002). Cytotoxic granules are secreted in the secretion zone of the inner region distinct from cSMAC.
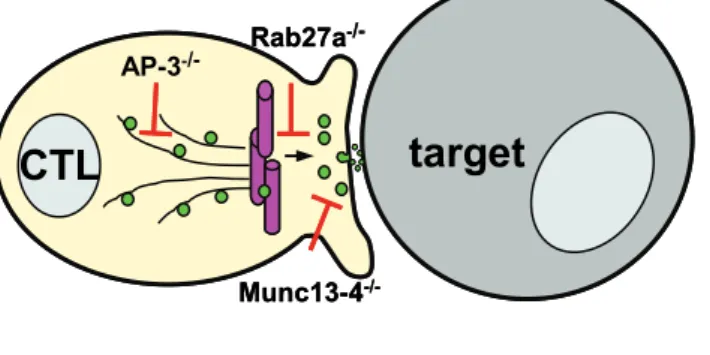
Exocytosis of cytotoxic granules is thought to require at least four distinct steps and two molecules contributing to these have been identified so far. The first step is the release of cytotoxic granules from the microtubules. In the absence of the small GTPase Rab27a, cytotoxic granules remain connected to microtubules in the zone
directly adjacent to the immunologic synapse. This shows that Rab27a is involved in release of cytotoxic granules from microtubules (Menasche, Pastural et al. 2000;
Haddad, Wu et al. 2001). After detachment from microtubules the granules are tethered and docked to the plasma membrane at the immunological synapse.
Thereafter, the granule membrane fuses with the plasma membrane by virtue of soluble N-ethylmaleimide-sensitive fusion factor attachment protein receptors (SNARE) (Jahn, Lang et al. 2003). This process is regulated by Munc13-4, a member of the Munc13 family (Feldmann, Callebaut et al. 2003). It has been shown that in Munc13-4-deficient CTL, cytotoxic granules dock to the plasma membrane, but membrane fusion does not take place, completely blocking secretion of the granular contents. Finally, the contents of granules are secreted into the synaptic cleft (Fig. 4).
Although the functions of AP-3, Rab27a, and Munc13-4 have been identified, the remaining molecular machinery responsible for this specialised secretory mechanism is by far not completely understood (Stinchcombe and Griffiths 2007).
Fig. 4 Molecules involved in the polarised secretion of cytotoxic granules in CTL
In CTL (left) cytotoxic granules (green) move in a minus-end direction along microtubules towards the MTOC (purple), localised beneath the immunological synapse. Granules dock and tether to the membrane at the immunological synapse and fuse with the plasma membrane, before releasing their contents into the synaptic cleft. The illustration indicates the side of action of AP-3, Rab27a and Munc13-4. In AP-3-/- CTL, cytotoxic granules do not move along microtubules. In Rab27a-/- CTL, cytotoxic granules remain aligned along the microtubules. In Munc13-4-/- CTL, cytotoxic granules cannot fuse with the plasma membrane.
1.8 Aim of this work
The aim of this study is to elucidate the mechanism by which ASMase contributes to effective secretion of cytotoxic granules in CD8+ cytotoxic T lymphocytes.
Rab27a-/-
Munc13-4-/- AP-3-/-
CTL target
Rab27a-/-
Munc13-4-/- AP-3-/-
CTL target
2. Material and Methods
2.1 Material
2.1.1 Mice
Breeding pairs of heterozygous Acid Sphingomyelinase-deficient (ASMase-/-) mice were kindly provided by Richard Kolesnick (Memorial Sloan-Kettering Cancer Center, New York) and originally obtained by Prof. Edward H. Schuchmann (Mount Sinai School of Medicine, New York). ASMase-/- mice already backcrossed six times to the C57BL/6 background were obtained from Douglas R. Green and Tesu Lin, La Jolla Institute of Allergy and Immunology, San Diego and further backcrossed to the 10th generation. Their genotypes were analysed as described (Diploma).
Perforin-deficient (perf-/-) C57BL/6 mice were kindly provided by Hans Hengartner, Institute of Experimental Immunology, University Hospital Zürich, Switzerland and serglycin-deficient (SG-/-) C57BL/6 mice by Magnus Abrink, University of Agricultural Sciences, Department of Molecular Biosciences, The Biomedical Centre, Uppsala, Sweden. ASMase-/- mice were crossed either with perf-/- or SG-/- C57BL/6 to generate ASMase-/-/perf-/- or ASMase-/-/SG-/- mice.
All mice were bred and maintained under specific pathogen-free (SPF) conditions and experiments were performed in accordance with the Animal Protection Law of Germany in compliance with the Ethics Committee at the University of Cologne.
2.1.2 Virus
Lymphocytic Choriomeningitis virus (LCMV), strain WE, was propagated and titrated as plaque forming units (PFU) on murine L929 cells (Lehmann-Grube and Ambrassat 1977).
2.1.3 Cell lines
Simian virus (SV) 40 transformed C57BL/6 murine embryonic fibroblasts (MEF), EL4.F15 T cell lymphoma, MBL.2 and MBL.Fas thymic lymphoma, L1210.3 lymphocytic leukaemia (DBA subline 212 origin) and the CTL line 1.3E6 SN, are murine cell lines of C57BL/6 origin and were used as target cells or controls.
Cell lines were propagated in Dulbecco´s minimal essential medium (DMEM) supplemented with 10% heat-inactivated fetal calf serum (FCS) at 37°C and 5% CO2. For 1.3E6 SN cells, medium was supplemented with 10% rat Concanavalin A supernatant (ConA SN) and MBL.Fas were cultivated in the presence 1 mg/ml G418 for Fas-transfected cell selection. The cells were regularly treated to be free of mycoplasms.
MBL.2, MBL.Fas, L1210.3 and 1.3E6 SN cell lines were a gift from Markus M.
Simon, Max-Planck Institute for Immunobiology, University of Freiburg.
2.1.4 Peptide
The H2-Db-restricted, LCMV glycoprotein derived peptide gp33-41 (KAVYNFATC) was obtained from Biosynthan, Berlin. The lyophilised peptide was dissolved in dimethylsulfoxid (DMSO) to a 20 mg/ml stock solution.
2.1.5 Oligonucleotides (Primer)
The following primers were purchased from Sigma-Aldrich (Munich) or Hermann (Freiburg):
gene sequenz
HPRT sense: 5´GCT GGT GAA AAG GAC CTC T 3´
antisense: 5´CAC AGG ACT AGA ACA CCT GC 3´
amplifying a 249-bp segment
perforin sense: 5´ACA TTC TCA AAG TCC ATC T 3´
antisense: 5´GGG GAT CTA CAA CTT GTA CGG 3´
amplifying a 380-bp segment
granzyme A sense: 5´GGG GAT CTA CAA CTT GTA CGG 3´
antisense: 5´ATT GCA GGA GTC CTT TCC ACC AC 3´
amplifying a 291-bp segment
granzyme B sense: 5´TCA GGC TGC TGA TCC TTG ATC G 3´
antisense: 5´ATG AAG ATC CTC CTG CTA C 3´
Amplifying a 135-bp segment.
2.1.6 Chemicals, media, buffers and solutions
All chemicals were of research grade and purchased from Applichem (Darmstadt), MERCK (Darmstadt), Roth (Karlsruhe) or Sigma-Aldrich (Munich) if not otherwise specified. All buffers and solutions were prepared by using deionised or bidestilled water from an EASYpure® UV/UF water purification unit (Werner Reinstwassersysteme, Leverkusen), sterilised by autoclaving or sterile-filtered with a 0.2 µm filter if necessary and stored at room temperature.
ß-mercaptoethanol (ß-ME) 0.02 M in water, stored at 4°C
bath solution for patch-clamp 145 mM NaCl, 10 mM KCl, 10 mM HEPES, 2.5 mM CaCl2, 1 mM MgCl2 adjusted to pH 7.4 with NaOH
blocking buffer for IFM PBS with 3% BSA and 0.1% saponin
blocking buffer for WB 5% skim milk (Oxoid, Hampshire, UK), 2% BSA in 1 x TBST, stored at -20°C
cell sorting buffer for MACS PBS with 0.5% BSA and 2 mM EDTA chromogenic substrates gzmA: HD-Pro-Phe-Arg-pNA
gzmB: Ac-Ile-Glu-Pro-Asp-pNA
ß-hexosaminidase: 4-methylbelliferyl-2-acetamido-2-deoxy- ß-D-glycopyranoside (Bachem, Weil am Rhein)
concanamycin A (CMA) 0.1 mg/ml in DMSO, stored at -20°C
cultivation medium for target cells DMEM (1 x Dulbecco´s modified Eagle medium, Biochrom AG, Berlin) supplemented with 5 or 10% FCS, stored at 4°C cultivation of splenic T cells standard medium: RPMI (1 x VLE RPMI-1640 Medium)
supplemented with 10% FCS and 1% PS, stored at 4°C for enzymatic activity measurements: MEM (Minimal essential medium, Eagle’s salt) without phenol red supplemented with 2 mg/ml BSA
for [35S]-labelling: sulfate-free RPMI medium containing 10%
FCS, 1% PS and 50 µM ß-ME cyclosporine A 5 mg in 1 ml ethanol, stored at -20°C cytochalasin D 2 mg in DMSO, stored at -20°C
DNA standard 1 kb ladder (BioLabs, Frankfurt am Main) erythrocyte lysis buffer 0.2% or 1.6% NaCl in water
FACS fixation buffer PBS with 1% paraformaldehyde (PFA) and 0.5% BSA fixation buffer for IFM 3% PFA in PBS, stored at -20°C
FK-506 2 mg in 1 ml DMSO, stored at -20°C
fetal calf serum (FCS) heat-inactivated at 56°C for 30 min, stored at -20°C (Biochrom AG, Berlin)
Golgi Stop reagent contains monensin (BD Pharmingen) imipramine 500 mM in water, stored at -20°C
Indo-1 calcium sensitive fluorescent dye (Invitrogen) ionomycin 1 M ready to use solution in DMSO, stored at -20°C
lymphocyte lysis buffer 10 mM Tris/HCl, adjust at room temperature pH to 7.5, 0.1%
triton-X-100 (v/v), store at 4°C, add Complete protease inhibitor cocktail before use (Roché)
lysis buffer for 51Cr-release 1.6% triton-X-100 (v/v) in water
MES calibration buffer 5 mM NaCl, 115 mM KCl, 1.2 mM MgSO4 and 25 mM MES;
adjust pH 3, 4, 5, 6, 7 and 8
[N-methyl-14C]-sphingomyelin 0.2 µCi/ml, specific activity 56.6 mCi/ml (Amersham) monensin 0.1 M in ethanol, stored at -20°C
PBS 1 x Dulbecco´s phosphate buffered salt solution, pH 7.4 (Biochrom AG, Berlin)
PBS / EDTA PBS with 0.5 M EDTA for target conjugate separation penicillin/streptomycin (PS) penicillin (10 000 U/ml) and streptomycin (10 ng/ml) in
water, stored at -20°C (Biochrom AG, Berlin) permeabilising buffer PBS, 0.1% w/v saponin
phorbol 12-myristate 13-acetate (PMA)
2 mg were dissolved in 1 ml DMSO and stored in the dark at -20°C
protein standard See blue plus 2 pre-stained standard (Invitrogen, Karlsruhe) or pre-stained protein ladder 10-180 kD (Fermentas)
10 x running buffer 1 x 25 mM Tris, 192 mM glycine, 1% SDS, pH 8.3 (Bio-Rad) sample buffer (5 x laemmli) 60 mM Tris-HCl (pH 6.8), 2% SDS-solution, 25% glycerol,
0.2% bromphenol blue and 10% ß-ME added before use sheep-erythrocyte washing buffer HBSS (Hanks balanced salt solution), 2 mg/ml BSA, 0.01 M
HEPES (pH 7.4), 8 mM CaCl2
sodium chromate [51Cr] 400 µl sodium chromate (Na2CrO4), 2 mCi/ml (Hartmann Analytics, Braunschweig)
streptavidin-PE IFM: diluted 1:500; FACS 1:100 (Becton Dickinson), TBS (pH 7.4) 10 mM Tris-HCl, 150 mM NaCl
TBST (pH 7.4) 1 x TBS, 0.5% Tween-20
trypan blue solution 1 x ready to use solution (Sigma-Aldrich)
trypsin-EDTA solution 10 x trypsin-EDTA solution (Biochrom AG, Berlin), made up to 1 x using sterile water
western blot transfer buffer 25 mM Tris, 192 mM glycine, 20% methanol (Roth, Darmstadt) and 0.05% SDS pH 8.3, stored at 4°C
2.1.7 Antibodies
Rabbit against murine gzmA immune serum was a gift of Markus M. Simon, Max- Planck Institute for Immunobiology, Freiburg.
antigen Specification provider
primary
ß-actin chicken anti-mouse monoclonal antibody (mAb) (clone AC-15), WB 1:10 000
Sigma-Aldrich
ASMase affinity purified goat polyclonal anti-mouse (clone A-19), IFM 1:100
Santa Cruz
CD3ε armenian hamster (IgG1, κ) anti-mouse mAb (clone 145-2C11)
BD Pharmingen
CD8a (Ly-2) rat anti-mouse APC-, PE- or FITC- conjugated mAb (clone 53-6.7), FACS 1:100
BD Pharmingen
conjugated to paramagnetic beads, MACS Miltenyi Biotec CD28 syrian hamster (IgG2λ1) anti-mouse (clone
37.51)
BD Pharmingen
lamp1 (CD107a) rat (IgG2a, κ) anti-mouse purified or FITC- conjugated mAb (clone 1D4B), FACS 1:100, IFM 1:1000
BD Pharmingen
gzmA affinity-purified rabbit anti-mouse immune serum, FACS and IFM 1:100
Markus Simon
gzmB rat (IgG2a) anti-mouse mAb (clone 216315), WB 1:500
R&D Systems
mouse (IgG1) anti-human PE-conjugated mAb (clone GB11), FACS 1:20
CALTAG Laboratories IFN-γ rat (IgG1) anti-mouse FITC-conjugated
mAb (clone XMG1.2), IFM 1:100
BD Pharmingen
perforin rat (IgG2a) anti-mouse mAb (clone KM585), WB 1:1000
Kamiya
RANTES rat anti-mouse biotinylated mAb (clone 53405), IFM 1:100
R&D Systems
isotype controls (IC)
rabbit IgG immune serum whole IgG (H+L) rabbit immune serum Dianova hamster IgG1k mouse (IgG2b, κ) anti-armenian and anti-
syrian hamster IgG1 mAb (clone G94-56)
BD Pharmingen mouse IgG1 mouse IgG1 PE-conjugated mAb CALTAG
secondary
anti-mouse HRP anti-mouse HRP-conjugated, WB 1:5 000 Amersham anti-rat HRP goat anti-rat HRP-conjugated, WB 1:10 000 Amersham anti-goat Alexa488 or -555 donkey anti-goat IgG (H+L) conjugated with
Alexa-488, IFM 1:1000
Invitrogen
anti-mouse PE affinity purified goat anti-mouse IgG1 polyclonal PE-conjugated Ab, FACS 1:100
Invitrogen
anti-rabbit Alexa594 chicken anti-rabbit IgG (H+L), conjugated with Alexa-594, IFM 1:1000
Invitrogen
anti-rabbit FITC goat anti-rabbit IgG FITC-conjugated, intracellular FACS 1:500
Dianova
anti-rat Cy3 goat anti-rat IgG (H+L) Cy3-conjugated mAb, IFM 1:1000
Invitrogen
protein A 10 nm protein A conjugated gold particles of 10 nm in diameter, EM
Amersham
2.1.8 Technical equipment
β-counter 1217 Rackbeta Wallac
Blot and gel chambers Criterion blotter Bio-Rad
Centrifuge 5417 R Eppendorf
Megafuge 1.0 R Heraeus
Confocal Microscope DMIRE2 Leica
Developer AGFA Curix AGFA
ELISA-reader MRX Tc Dynex Technol.
ELISpot reader System ELR02 AID Diagnostic
Flow cytometer FACSCalibur Becton Dickinson
Fluorescence Microscope IX81 Olympus
Gel-photosystem Gel-doc 2000 Bio-Rad
γ-counter COBRA II Canberra-Packard
Incubator Heracell Heraeus
Magnetic separator Quadro MACS Miltenyi Biotech
Microscope Axiovert 25 Zeiss
Power supply Power Pac 3000 Bio-Rad
Spectrophotometer SpectraMax 190 Molecular Devices
2.1.9 Kits
BD Cytofix/Cytoperm kit Becton Dickinson
BCA-protein assay kit Thermo Scientific
CD8+T cell isolation kit Miltenyi Biotec Diacylglycerol-kinase assay kit GE Healthcare ECL western blotting detection kit GE Healthcare
ELISA mouse IFN-γ OptEIA set Becton Dickinson ELISA mouse RANTES DuoSet R&D Systems
ELISpot mouse IFN-γ detection kit R&D Systems
RNase-free DNase kit Qiagen
RNeasy mini kit Qiagen
SpectraMax 190 Molecular Devices
Thermocycle PTC-200 DNA-Engine MJ Research,
UV-transluminator Vilber Lourmat
2.2 Methods
2.2.1 Infection of adult mice with the Lymphocytic Choriomeningitis virus For acute infection of adult mice (6 to 8 weeks of age) with the LCMV, strain WE, plaque-forming units (PFU) were converted into infectious units (IU) by multiplying PFU with a factor of 10. Mice were infected by intravenous (i.v.) inoculation of 1 x 10⁵ IU of the LCMV in 0.3 ml PBS with 5% penicillin/streptomycin (PS) and 1% fetal calf serum (FCS) into the tail vein.
2.2.2 Preparation of LCMV-specific CD8+ T cells from spleens 2.2.2.1 Splenic single cell suspensions
On day 8, 9 or 30 post infection (p.i.), animals were sacrificed and their spleens were removed under sterile conditions. Single cell suspensions were obtained by gently squeezing the spleen and passing cell suspensions through a 70 µm nylon mesh with the plunger of a 2 ml syringe. Cells were centrifuged at 1200 rpm, for 5 min at 4°C and cell pellets were resuspended in 10 ml ice cold 0.2% NaCl to lyse red blood cells. After 30 seconds, isotonic conditions were reconstituted by adding the same volume 1.6% NaCl solution to the cells. Cells were then centrifuged, the pellet resuspended in 1 ml medium and viable cells were counted by using trypan blue exclusion in a Neubauer chamber.
2.2.2.2 Magnetic cell sorting (MACS)
For positive selection, CD8+ T cells were enriched by MACS from splenic cell suspensions, using a CD8-specific monoclonal antibody (mAb) conjugated to paramagnetic particles following the manufacturer’s instructions (Miltenyi Biotec).
After 20 min the cells were washed twice and resuspended in sorting buffer. The magnetically labelled cells were retained in LS-columns, while unlabelled cells were washed out by several rinses. The retained cells were eluted from the column after removal from the magnetic field, centrifuged, resuspended in medium and counted in trypan blue solution using Neubauer chambers.
In some instances, negative selection of CD8+ T cells was performed by depletion of undesired cells. Non-CD8+ T cells were labelled and eliminated from the cell
the CD8+ T cells was collected and the purity of selected CD8+ cells was assessed by flow cytometry to be between 94–98%.
2.2.2.3 Preparations of cell-lysates
CD8+ T cells or control cells were washed twice in ice-cold PBS and a total of 5 x 10⁷ cells were lysed in 1 ml lymphocyte lysis buffer, containing protease inhibitors, on ice for 60 min. Thereafter, cell lysates were cleared by centrifugation for 15 min at 2500 g and 4°C for removal of nuclei and intact cells. The protein concentration was determined by using the BCA-protein assay kit according to instructions of the manufacturer (Thermo Scientific). The supernatants were resuspended in 5 x SDS sample buffer and run on a SDS-gel (2.2.10), tested for perforin, gzmA, gzmB, hexosaminidase enzymatic activity (2.2.8) or stored at -80°C.
2.2.3 Cell culture
Cells lines were grown and maintained in incubators at 37°C, 5% CO2 and water vapour saturated atmosphere.
Adherent SV40-transformed C57BL/6 MEF, MBL.2 and MBL.Fas lymphoma cells were maintained in tissue culture flasks and passaged weekly after trypsin-EDTA- treatment. A small number of cells was passaged in a ratio of one to five every 3 to 5 days.
For L1210.3, EL4.15 and 1.3E6 SN suspension cells, medium was removed and a fraction of the cell pellet was resuspended in fresh medium every 3 to 5 days.
To produce concanamycin A (ConA) supernatant (SN), rat spleen cells were stimulated with 5 µg/ml ConA for 2 days. Subsequently the spleen cells were treated with 20 mg/ml α-methyl-D-mannopyranosid to block residual ConA activity and the SN was prepared.
2.2.4 Infection or peptide loading of target cells with LCMV
As target cells in cytotoxicity assays, C57BL/6-SV fibroblasts infected with the LCMV strain WE were used. Cells were plated in cell culture dishes at a density of 1 x 10⁶ and 0.5 x 10⁶. After 3 h adhesion, the cells were infected with LCMV at a multiplicity of infection (MOI) of 0.01 and incubated for 48 h before being used in the
assay. At the experimental day the target cells were harvested and counted in trypan blue solution using Neubauer chambers.
In some instances target cells were loaded with synthetic peptide corresponding to the major immunodominat Db-restricted epitope (gp33-41, KAVYNTATC) of the LCMV glycoprotein at a final concentration of 10-6 M for 60 min prior to the assay. The cells were frequently resuspended by pipetting to avoid aggregation.
L1210.3 B cells lymphoma were used as target cells in assays of “re-directed cytolysis” in the presence of anti-CD3 and anti-CD28 mAb.
2.2.5 Assay for virus-specific cytotoxicity of CD8+ T cells
The virus-specific cytotoxic activity of splenic CD8+ T cells was measured in
51Chromium ([51Cr]) -release assays according to Brunner et al. (Brunner, Mauel et al. 1968) with modifications (Lehmann-Grube, Lohler et al. 1993).
CD8+ T cells were immunomagnetically enriched from splenic single cell suspensions of mice acutely infected with LCMV on day 8 p.i. as described in (2.2.2).
CD8+ effector cells were adjusted to 3 x 10⁶ /ml in RPMI medium and 200 µl were dispensed in 96-U bottom microtiterplates in replicates of four and furthermore diluted 3-times two-fold to achieve effector to target ratios of 100:1, 50:1, 25:1 and 12.5:1.
1 x 10⁶ target cells either infected with LCMV or loaded with gp33, were incubated with 50 µCi [51Cr] sodium chromate (Hartmann Analytics) for 60 min at 37°C, washed and adjusted to a density of 3 x 10⁴ cells/ml. 100 µl of target cell suspension were added to each well with effector cells. As negative controls fibroblasts without antigen were used. The spontaneous release of each [51Cr]-labelled target cells was determined in 8 wells without effector cells. In these samples the spontaneous release was less than 9% of the maximum release.
The maximal release was determined by total target cell lysis in 1.6% Triton-X-100 in water. The virus-specific cytotoxic activity of CD8+ T cells was determined after 4 h incubation at 37°C. For the determination of the Fas Ligand dependent lysis, the supernatants were harvested after 9.5 h incubation time. Cells were spun down and 100 µl cell-free supernatants were harvested. Supernatants from each well were measured in a gamma-counter to detect the amount of [51Cr] as counts per minute (cpm). Mean of the 4 replicates were calculated before the virus-specific lysis of
target cells was calculated with correction for background lysis, as followed for each effector to target ratio:
% specific lysis = (cpm sample – cpm spontan) / (cpm maximal – cpm spontan) x100
2.2.6 Stimulation or inhibition of virus-specific T lymphocytes 2.2.6.1 Antigen-specific stimulation of CD8+ T cells
For measurement of the intracellular accumulation of IFN-γ (2.2.7), the frequency of IFN-γ secreting cells (2.2.8) and the amount of secreted cytokine into the supernatant was determined (2.2.8). Splenocytes were stimulated with LCMV infected C57BL/6-SV target cells at an effector to target ratio of 10:1.
2.2.6.2 TCR-triggered degranulation of CD8+ T cells
For analysing gzmA secretion and polarisation of cytotoxic granules towards the target cell, enriched CD8+ T cells from LCMV infected mice were incubated with L1210.3 cells in the presence or absence of increasing concentrations of anti-CD3 mAb plus the same amount anti-CD28 mAb.
2.2.6.3 PMA and ionomycin induced secretion
For some experiments, CD8+ T cells were stimulated for different periods of time with 10 ng phorbol 12-myristate 13-acetate (PMA) and 500 ng ionomycin per ml.
2.2.6.4 Specific inhibition of perforin
To inhibit perforin, CD8+ T cells were pre-treated in some experiments with 200 nM concanamycin A (CMA) for 2 h before being added to target cells in the continued presence of the drug.
2.2.6.5 Inhibition of ASMase with imipramine
CD8+ T cells were pre-treated with graded concentrations (5-50 µM) and for defined periods of time (1-120 min) with the specific inhibitor of ASMase, imipramine.
The cells were washed three times and counted before used in experiments.
2.2.6.6 Inhibition of exocytosis
To inhibit exocytosis, CD8+ T cells were stimulated with PMA/ionomycin in the presence of 0.5 µg/ml cytochalasin D, 100 nM cyclosporin A or 100 nM FK-506.
2.2.7 Flow cytometry 2.2.7.1 Surface staining
The frequency of CD8+ T cells among spleen cells was determined by flow cytometry. A total of 1 x 10⁶ splenocytes was washed with PBS, 0.5% BSA and stained for 15 min with 1 µg of fluorochrom-labelled monoclonal antibodies specific for CD8 or isotype control antibody diluted in PBS with 0,5% BSA at 4°C in the dark.
For the detection of extracellular gzmB, CD8+ T cells were incubated for 45 min at 4°C with a PE-conjugated mAb to human and mouse gzmB or isotype control mAb, diluted 1:20. After incubation, the cells were washed twice with cold PBS, 0.5% BSA, stained with a PE-conjugated amplifying antibody, fixated and analysed using a FACSCalibur flow cytometer (Becton Dickinson).
2.2.7.2 Intracellular staining of IFN-γ and gzmA
The accumulation of intracellular IFN-γ in CD8+ T cells triggered by TCR-mediated recognition of MHC-restricted epitopes of the LCMV was measured according to Assenmacher et al. (Assenmacher, Schmitz et al. 1994). 1 x 10⁶ splenocytes of a single cell suspension of mice day 8 and 9 p.i. were incubated with the LCMV epitope gp33 for 5 h. After 1 h of incubation, monensin (Golgi Stop reagent, Becton Dickinson) was added to block the secretion of vesicles loaded with IFN-γ. In the following, splenocytes were stained with antibodies specific for CD8 (2.2.7). Afterwards the cells were fixed and permeabilised with the BD Cytofix/Cytoperm kit according to the instructor’s manual.
For analysis of intracellular gzmA, day 8 immune splenocytes were stained with surface markers as described above and fixed with PBS containing 2.5% PFA for 15 min at 4°C. Subsequently, cells were incubated in 100 µl permeabilising buffer for 10 min at 4°C, than stained for 45 min at 4°C with rabbit anti-mouse gzmA immune serum or rabbit IgG isotype control (Dianova) and washed with permeabilising buffer.
Afterwards, cells were stained with FITC-labelled goat anti-rabbit IgG as secondary antibody (Dianova), diluted 1:500 in permeabilising buffer and washed twice. The cells were fixed in PBS with 1% PFA, 0.5% BSA and analysed by flow cytometry.
2.2.7.3 Detection of Lamp1 (CD107a) exposure on the cell surface
Surface expression of Lamp1 (CD107a) was measured by flow cytometry as described previously (Rubio, Stuge et al. 2003). Briefly, splenic single cell suspensions of mice on day 8 after LCMV infection were co-incubated with L1210.3 target cells at a ratio of 1:1 with or without anti-CD3 mAb for 10 min at 37°C in U- bottom microtiterplates. To avoid quenching of FITC fluorescence intensity, 1 µM monensin in ethanol was given per well. 1 µl of FITC-conjugated anti-Lamp1 (CD107a) or FITC-conjugated isotype control mAb was added. Cells were harvested and washed once using PBS with 0.5 M EDTA to dissociate effector-target cell conjugates at the indicated time points. CD8+ T cells were stained with APC- conjugated mAb and exposure of Lamp1 on the cell surface of CD8+ T cells with FITC-conjugated Lamp1 monoclonal antibody Finally, the cells were fixed using FACS fixation buffer and measured by flow cytometry.
2.2.8 Assay for secretion of cytotoxic granules
2.2.8.1 Quantifying enzymatic activity of gzmA, gzmB, ß-hexosaminidase or perforin
Enzymatic activity of gzmA, gzmB and ß-hexosaminidase in CD8+ LCMV-immune T cells was analysed by cleavage of the chromogenic substrate HD-Pro-Phe-Arg-pNA, Ac-Ile-Glu-Pro-Asp-pNA and 4-methylbelliferyl-2-acetamido-2-deoxy-ß-D- glycopyranoside (Bachem, Weil am Rhein) (Ebnet, Hausmann et al. 1995; Martin, Wallich et al. 2005) in cooperation with Julian Pardo, MPI Freiburg by spectrophotometer (SpectraMax 190, Molecular Devices, Munich) as described above at wavelength 405 nm/690 nm.
The activity of gzmA secreted by serial dilutions of wt and ASMase-/- CD8+ T cells in response to target cells was determined after incubation with L1210.3 cells in the presence or absence of 2 µg/ml anti-CD3 monoclonal antibody at an effector to target ratio of 20:1. The cells were cultured in MEM without phenol red, supplemented with 2 mg/ml BSA to avoid FCS-mediated inhibition of released gzmA. Cell-free supernatants were harvested after 6 h.
The activity of ß-hexosaminidase activity in supernatant was measured with the substrate 4-methylbelliferyl-2-acetamido-2-deoxy-ß-D-glycopyranoside in 400 mM acetate buffer, pH 4.4 containing 250 mM sucrose. The released product 4-
methylumbelliferone was measured with a fluorescence microtiterplate reader at excitation and emission wavelengths of 355 nm and 460 nm, respectively.
The lytic activity of perforin was determined by the release of haemoglobin from sheep-erythrocytes as described (Shresta, Graubert et al. 1999; Fruth, Prester et al.
1987). Serial dilutions of lysates of CD8+ T cells from d8 p.i LCMV infected mice were prepared by resuspending 1 x 10⁷ CD8+ T cells in 100 µl PBS with 1 mM EDTA. The cells were subjected to repeated freeze / thawn cycles and ultrasonificated 3 times for 30 sec with a break of 30 sec. The cellular debris were removed by centrifugation (5 min at 10 000 rpm at 4°C). Sheep-erythrocytes were washed twice in PBS and resuspended in HBSS buffer at 3 x 10⁷ cells/ml. 50 µl of CTL lysates and 150 µl of sheep-erythrocytes in HBSS buffer were incubated in a round-bottom microtiterplate for 20 min at 37°C. After centrifugation for 10 min at 1200 rpm at 4°C, 100 µl cell-free supernatant per well were transferred into a flat-bottom microtiterplate and the haemoglobin in the SN was quantified at 405 nm in a microtiterplate reader.
2.2.8.2 Quantification of cytokines secreted by CD8+ T cells
IFN-γ and RANTES secreted into the supernatant by 1 x 10⁶ LCMV-specific CD8+ T cells/ml on day 8 or 9 p.i. in response to antigen-specific stimulation, were quantified in the culture supernatants after 24 h by specific enzyme-linked immunosorbent assays (ELISA) according to the instructions of the manufacturer (R&D Systems or Becton Dickinson).
2.2.8.3 Measuring the frequency of IFN-γ secreting T cells via ELISpot
1 x 10⁶ enriched LCMV-immune CD8+ T cells/ml were seeded by ten-fold dilution series in polyvinyliden-difluorid (PVDF)-coated microtiterplates of a mouse IFN-γ ELISpot (R&D Systems). For antigen-specific stimulation of CD8+ T cells, 1 x 10⁶ / ml of naïve wt splenocytes, pre-incubated 1 h with the gp33-41 epitope at a concentration of 10-6 M or LCMV infected C57BL/6-SV target cell, were added. After 24 h, the cells were washed off the membrane to detect spots of IFN-γ according to the instructions of the manufacturer.
2.2.8.4 Pulse/chase labelling of cytotoxic granules with fluid phase markers CD8+ T cells were enriched from the spleen on day 8 p.i. from wt and ASMase-/- mice. Lysosomes were pulsed with fluid phase markers dextran of graded size i.e. 3,
70 or 500 kDa molecular weight, Alexa488-, Texas Red (TR)-, Oregon Green- or FITC- conjugated (Invitrogen, Karlsruhe) by incubating the CD8+ T cells with 10 µM of dextrans at a density of 1 x 10⁶ cells/ml in DMEM with 10% FCS for 2 h. Non- endocytosed fluid phase marker were removed by washing three times with PBS.
Fluid phase markers were chased into cytotoxic granules by incubation in fresh culture medium for 2 h at a density of 1 x 10⁶ cells/ml. Afterwards intracellular localisation of dextrans in lysosomes was verified after staining cells specific for Lamp1 by confocal microscopy. Secretion of dextran from lysosomes was monitored after stimulation with PMA/ionomycin by flow cytometry.
Formation of conjugates between CTL and target cell was assessed after incubation of L1210.3 cells with CD8+ T cells for 10 min by immune-fluorescence microscopy.
2.2.9 qRT-PCR analysis of perf-, gzmA- and gzmB-specific mRNA transcripts 2.2.9.1 RNA isolation
Total RNA was extracted from LCMV-infected splenic CD8+ T cells, using the QIAshredder spin columns and extracted RNA was further cleaned up by using the RNeasy mini kit and the RNase-free DNase kit (all from Qiagen, Hilden).
2.2.9.2 cDNA synthesis
mRNA was transcribed by incubating total RNA with random hexamer primer (33 mM, Pharmacia, Freiburg), RNasin inhibitor (20 U, Promega, Madison, USA), dNTPs (0,5 mM, Qbiogene, Heidelberg) and Omniscript RT (4U, Qiagen, Hilden) as advised by the manufacturers and in cooperation with Julian Pardo, MPI Freiburg. The reverse transcription was performed in a Thermocycle PTC-200 DNA-Engine (MJ Research, Waltham, MA, USA). The transcription reaction profile was as follows:
37°C for 60 min and 70°C for 10 min. The resulting cDNA was used as a template for qRT-PCR hypoxanthin:guanine phosphoribosyltransferase (HPRT)-, perf-, gzmA- and gzmB-amplification.
2.2.9.3 qRT-PCR
PCR-reaction was carried out in a Thermocycler PTC-200. The PCR reaction profiles were as follows: 1 cycle at 94°C for 2.5 min as an initial denaturation step, then denaturation at 94°C for 20 sec, annealing at 56°C for HPRT or 55°C for perf,
gzmA and gzmB for 20 sec; extension at 72°C for 20 sec for HPRT or 30 sec for perf, gzmA and gzmB (35 cycles), followed by further incubation for 3 min at 72°C (1 cycle). Specific sense and antisense primers shown in 2.1.5, were used for HPRT, perf-, gzmA- and gzmB-specific transcripts. The PCR products were analysed by gel electrophoreses (2% agarose), stained with ethidiumbromide and visualized in an UV-transluminator (Vilber Lourmat, New Ark, NJ, USA). As size marker, 1kb DNA marker was used (BioLabs, Frankfurt am Main).
2.2.10 Immunoblotting
GzmB and perforin in lysates of CD8+ T cells, were quantified by western blot analysis. Cell lysates of wt and ASMase-/- CD8+ T cells (2.2.2) were diluted in 5-fold SDS sample buffer and boiled for 5 min at 100°C with 10% ß-ME. The samples were centrifuged for 1 min at 9000 rpm and equal volumes of supernatants were loaded on a 10% polyacrylamid gel and run under standard conditions. A commercial protein- marker was used (SeeBluePlus2 pre-stained standard, Invitrogen or prestained protein ladder 10-180 kD, Fermentas) for the identification of protein sizes. After gel electrophoresis, proteins were transferred to nitrocellulose membrane (Protran 0.2 µm; Schleicher and Schuell). Free protein binding sites were blocked for 1 h with blocking buffer and perf or gzmB labelled with the primary antibodies anti-perf (KM585, Kamiya Biomedical, Seattle, USA), anti-gzmB (R&D Systems) or anti-mouse ß-actin monoclonal antibody, respectively. After three times washing with TBS-T, membranes were then incubated with the appropriate horseradish peroxidase- conjugated secondary antibodies for 1 h (2.1.7, p 9-10), followed by washing in TBS- T and once with TBS. The immune complex was visualised by an enhanced chemiluminescence system (ECL western blotting reagent, Amersham) and detected by hyper film (Amersham ECL hyperfilm, GE healthcare).
2.2.11 Immunological synapse formation
Granule polarisation and synapse formation were studied in dextran-pulsed (2.2.8) or untreated CD8+ T cells co-incubated at 1:1 ratios with L1210.3 target cells in the presence of 3 µg/ml anti-CD3 in 1 ml complete medium. Cells were centrifuged at 500 rpm for 3 min at room temperature for synchronisation of cell contact and incubated for 10 min at 37°C. Conjugates were fixed for 30 min with 2.5% PFA by
adding the same volume 5% PFA into the sedimented cell culture and resuspended carefully after 10 min with a 1 ml pipette. Cells were washed and further processed for EM (2.2.13) or IFM (2.2.12).
2.2.12 Immunofluorescence microscopy
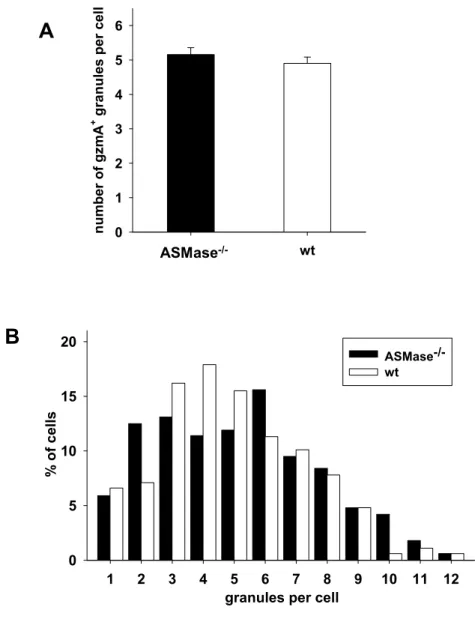
Fixed wt or ASMase-/- CD8+ T cells alone or conjugated to target cells were washed with permeabilising buffer for 20 min. Cells were incubated with blocking buffer for 30 min and incubated for 30 min with primary antibodies specific for Lamp1, RANTES or IFN-γ or antisera specific for gzmA or ASMase, followed by staining with corresponding fluorescence-labelled secondary antibodies (2.1.7, p 9-10) in blocking buffer for 30 min. Nuclei were stained with DAPI (Invitrogen), mounted on glass microscopic slides in ProLong Gold anti-fading reagent (Invitrogen) and examined by fluorescence microscopy (Olympus IX81) or confocal laser scanning microscope (Leica DMIRE2). Individual cells were photographed in the focus plane with the highest fluorescence intensity. The mean number of gzmA-positive granules per cell was determined by counting multiple optical planes.
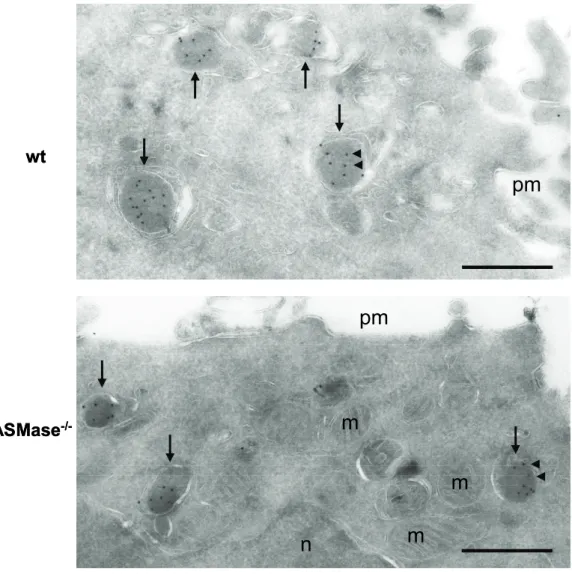
2.2.13 Electron Microscopy
For immunogold labelling, enriched CD8+ T cells were fixed with 4%
paraformaldehyde and 0.4% glutaraldehyde in 0.2 M PHEM buffer, pH 7.4 for 2 h at room temperature. Afterwards, the cells were spun down at 3500 rpm for 10 min, resuspended in 1 ml storage solution and subsequently further processed by Eric Bos and Peter J. Peters, The Netherlands Cancer Institute, Amsterdam. The cells were processed for cryo-ultramicrotomy, embedded in 12% gelatine and infiltrated for 3 h in 2.3 M sucrose and subsequently plunge-frozen in liquid nitrogen as described (Peters, Bos et al. 2006). Ultrathin cryosections of 50 nm thickness were prepared from the frozen sections with a cryo-ultramicrotome using a 35° angle knife (Ultracut FCS, Leica). The frozen sections were allowed to thaw on a droplet of 2.3 M sucrose and transferred to a formvar-coated copper grid. Then the sections were labelled with rabbit anti mouse gzmB-specific serum for 1 h and with protein A conjugated gold particles of 10 nm in diameter (Amersham Biosciences) overnight. The labelled sections were embedded and air-dried in 2% methylcellulose containing 0.6% uranyl
acetate. Analysis was performed with a Philips CM120 microscope and digital images were made with a Keen View camera (Soft Imaging System).
Conjugates of CD8+ T cells and target cells were fixed in 2.5% glutaraldehyde buffered with sodium cacodylate after 10 min of co-incubation. Osmification, dehydration, embedding and sectioning were performed as described (Zentgraf and Franke 1984). Micrographs were taken with a Zeiss EM-10A electron microscope at 80 kV at the German Cancer Research Center in Heidelberg by Hans-Walter Zentgraf. A grating replica was used as a scale bar.
2.2.14 Measurement of ASMase activity
ASMase activity was determined in cooperation with Katja Wiegmann, Institute for Medical Microbiology, Immunology and Hygiene, Cologne. CD8+ T cells were washed twice with PBS. The pellet was resuspended in 200 µl of 0.2% triton-X-100 and incubated for 15 min at 4°C. To prepare cellular lysates, cells were homogenized and spun at 14.000 rpm. From the supernatants, 30-50 µg of protein was incubated for 2 h at 37°C in a buffer (50 µl final volume) containing 250 mM sodium acetate, 1 mM EDTA (ph 5.0) and 2.25 µl of [N-methyl-14C]-sphingomyelin (Amersham).
Thereafter, the amount of radioactive phosphorylcholine produced was measured as described (Wiegmann, Schütze et al. 1994).
2.2.15 Thin-layer chromatography
The following preparations were done by Katja Wiegmann, Institute for Medical Microbiology, Immunology and Hygiene, Cologne as described (Krut, Wiegmann et al. 2006). CD8+ T cells were washed twice with PBS. Pellets were resuspended in 1.825 ml water and the supernatants were transferred into glass tubes.
Subsequently, 6 ml of chloroform/methanol/1 N acidic acid (100/100/1, v/v/v) were added. Tubes were sonicated for 5 min in a water bath sonicator and then centrifuged for 10 min at 6000 x g. The lower organic phase was dried down under nitrogen. The dry samples were resuspended in 2 ml of 0.1 N potassium hydroxide and incubated for 1 h at 37°C (alkaline hydrolysis). 6 ml chloroform/methanol/
1 N acidic acid (100/100/1, v/v/v), 1 ml of chloroform and 2.25 ml of water were added. After vortexing, the samples were centrifuged for 10 min at 6000 x g. The lower organic phase was dried down under nitrogen and resuspended in 100 µl of