van Leeuwen et al.: Evaluation of the Sequoia Turner Cell-Dyn 3000 105 Eur. J. Clin. Chem. Clin. Biochem.
Vol. 29, 1991, pp. 105-110
© 1991 Walter de Gruyter & Co.
Berlin · New York
A Short Evaluation of a New Haematological Cell Counter — The Cell-Dyn 3000 -
Following a Modifled Tentative NCCLS-Procedure
By L· van Leeuwen, P. H. Eggels and /. A. Bullen
Medische Laboratoria, Sint Jansgasthuis, Weert, The Netherlands
(Received May 8/November 9, 1990)
Summary: The proposed procedure offers a method of evaluation that is feasible, but still a very precise method, for the evaluation of electronic differential leukocyte counters. Following this abbreviated method, the classification of the leukocytes, from 5 20 unselected blood specimens, with a flow-cytometric analysis by the Sequoia Turner Cell-Dyn 3000, was compared with microscopic differential counts äs the Standard.
With proven accuracy and good reproducibility, the Cell-Dyn 3000 is a good sieve for the selection of normal samples. The high sensitivity and fair specificity permits a reduction of the differential workload to about 30 percent of the normal workload.
Introduction
The U. S. National Committee for Chnical Labora- tory Standards (NCCLS) has developed a compre- hensive scheine, H20-T (1) for assessing electronic differential leukocyte counters using manual differ- entiation äs the reference. This scheine includes 150 normal and 150 abnormal specimens (differentiation of 800 cells in each) to reduce the subjective and qualitative aspects of the classical single-slide, 100- cell differential count (manual 100).
Several evaluations of the safety and efficacy of elec- tronic differential leukocyte counting Instrumentation have been used to compare Instrument counts with those obtained from 800 cell, mültislide and light microscopic differential counts (2, 3). The method of evaluation proposed by the NCCLS is cumbersome, laborious and time consuming. Most of the time, evaluation material in middle and small laboratories is available in sufficient amount, but the manpower is limited. Therefore most authors use their own meth- ods (4 — 7) for comparison, while others make use of the Technieon H-6000 äs a new kind of Standard (8-11).
Kohut (12) published an abbreviated method (using 20 samples) for assessing leukocyte counters, because the H20-T was laborious and would have taken sev- eral months.
We found this method to be concise, and we have chosen it for a 100 specimen-modification of the NCCLS procedure (400 cell, mültislide microscopic differential count) for evaluating a new electronic differential leukocyte counter, the Cell-Dyn 3000 from Sequoia-Turner Corp, Mountain View, Ca, U. S. A.
Our aim was to determine whether the Cell-Dyn 3000 could discriminate between a normal and a patholog- ical blood sample, especially with respect to the leu- kocyte differentiation.
The evaluation was performed in two different ways:
first in terms of a "naked" differentiation thus in- cluding only the five leukocyte sub-populations in percentages; secondly in terms of a "total" differen- tiation, regarding percentages and absolute numbers and including all flagging.
106 van Lccuwcn et al.: Evaluation of the Sequoia Turner Cell-Dyn 3000 Materials and Methods
System descriplion
The CELL-DYN 3000 is a particle counler, sizer and white blood ccll classifier, dcdicated to the electronic and oplical detection and measuremcnt of blood cells contained in a sample ofwhole blood. EDTA-anticoagulated whole biood is aspirated via either the open or closed sampler.
The electronic rcsistance. with Volumetrie metering, is employed to count and size red blood cells and platelets [Coulter 1956].
Haemoglobin is measured by a modiiled haemiglobin cyanide absorbance method with auto blank.
A laser-based flow cytomeier is employed to count, size and classify leukocytes. Simultaneously, during the measurement cycle, each white cell is counted and individually characterized by four specific angles of light scatter for the differentiai clas- sification of the lymphocytes, basophils, monocytes, neutrophils and eosinophils. This is referred to äs Multi-Angle Polarized Scatter Separation (13 — 15).
The erythrocyte and platelet pulses are collected and presented in numbers per litre whole blood and in frequency distribution curves (histograms). Simultaneously, data are derived for the Red Cell Indices, Red Cell Distribution Width, Mean Platelet Volume and Platelet Distribution Width.
Total leukocyte counts are collected and presented in numbers per litre whole blood.
As stated above, each leukocyte is individually characterized by four scatter pulses. Once the Signals of each cell have been placed in their corresponding Computer channels, the Computer Software then multi-dimensionally classifies the Signals into the 5-part differentiai.
The leukocyte differentiai data can be routinely viewed/dis- played in the form of two 2-dimensional scattergrams.
Specimen collection
Blood samples were taken by venapuncture, using Venoject tubes with potassium (K2)-EDTA äs an anti-coagulant.
Over a period of one week, 20 patient samples were collected each day, thereby providing 100 patient samples. The distri- bulion of our patient population, is normally one third clinical patients, one third polyclinical and one third general practir tioner patients.
Every fifth sample was taken into the lest procedure until the desired number had been tested, i. e. 6 clinical patients, 6 po- lyclinical and 6 general practice patients. In an effort to include a wide ränge of abnormal values, the clinicai patients were mostly selected from the internal and paediatric (nucleated erythrocytes) clinic. Two other samples were added with known pathology.
The subjects were predominantly white Caucasian and included 42 males and 58 females; ages ranged from 6 months to 89 years.
Reference raethod
Four smears were made from each of these 20 samples, labeled with the patient identification and the characters A, B, C or D. These smears were stained within one hour, using a Wescor Aerospray Slide Stainer. The slides were then randomly distrib- uted to four highly experienced technologists. Each technologist reported a 100-cell differentiation, thereby producing a 400-cell count on each specimen. All leukocyte populations were re- ported in relative percentages, äs is usual in a 100-cell differ- entiation. Flags (both for erythrocytes and leukocytes äs for platelets) also were mentioned on the report form.
The slides were stored separately in case a closer review becarne necessary.
Cell-Dyn 3000 method
Between half an hour and an houf after sampling, the samples were analysed three times in a diflerent sequence on the Cell- Dyn 3000. Results and histograms were stored with identifi- cation, sample Status (abnormal or normal), age and sex. The three results from the Cell-Dyn 3000 were then collected on one report form per patient, togetherrwith the dispersional and raorphological flags.
Results
Results for haemoglobin, erythrocytes, leukocytes and platelets were compared with those frorri the Coulter Counter S5 and the Medonic CA 480. These Instru- ments were adjusted on a regional (15 laboratories) monthly quality control Programme with fresh blood samples. The results in the Ortho QC-programme lay within 2 s. d.
For all parameters mentioned above, the correlation coefficient was > 0.98.
Linearity
The linearity of the apparatus was evaluated by eight successive percentile dilutions (100, 80, 60, 40, 20, 15, 10 and 5%). To cover the whole dynämic ränge of haematology parameters, the analyses were performed on a normal patient sample, on a buffy coat, on packed cells and on platelet rieh plasma. All the components were obtained from one single donor.
The average of two duplicate specimens was plotted against the expected value for each dilution percentile.
The values lay well within-the manufacturer's speci- fications.
Carry-over
The procedure was examined for carry-over with two samples, one with high and one with low haematology parameters. For this purpose, two blood samples were taken from a donor, the first being concentrated, the other diluted to provide respectively high and low haematological parameters.
Independent triplicate cycling was performed on the concentrated sample, followed by a triplicate analysis of the diluted sample. The average sets of the three values were used to calculate the carry-over for hae^
moglobin, leukocytes* erythrocytes and platelets ac- cording to the following formula.
Ll - L3 H3 - L3
Carry-over was not found, except in the case of leu- kocytes, the deviation being :of little or no clinical significance. »
van Leeuwen et aL: Evaluation of the Sequoia Turner Cell-Dyn 3000 107
Within-run precision
Within-run precision was evaluated for the directly measured parameters, i.e. leukocytes, leukocyte sub- populations, erythrocytes, haemoglobin, mean cor- puscular volume, platelets and the derived parameter haematocrit (tab. 1).
One vial of Ortho Normal-15 Control Blood was aspirated twelve times, and the results were stored in an empty control file. The two first aspirations were deleted äs primes and the coefficients of Variation (CV) of the ten remaining samples were calculated by the apparatus.
The same performance was completed for a patient sample. The results of these ten samples are presented between brackets.
The precision of the Instrument showed a coefficient of Variation of less then 1.5%, except for the leukocyte subpopulations.
With fresh human blood, the coefficient of Variation was far better (see discussion).
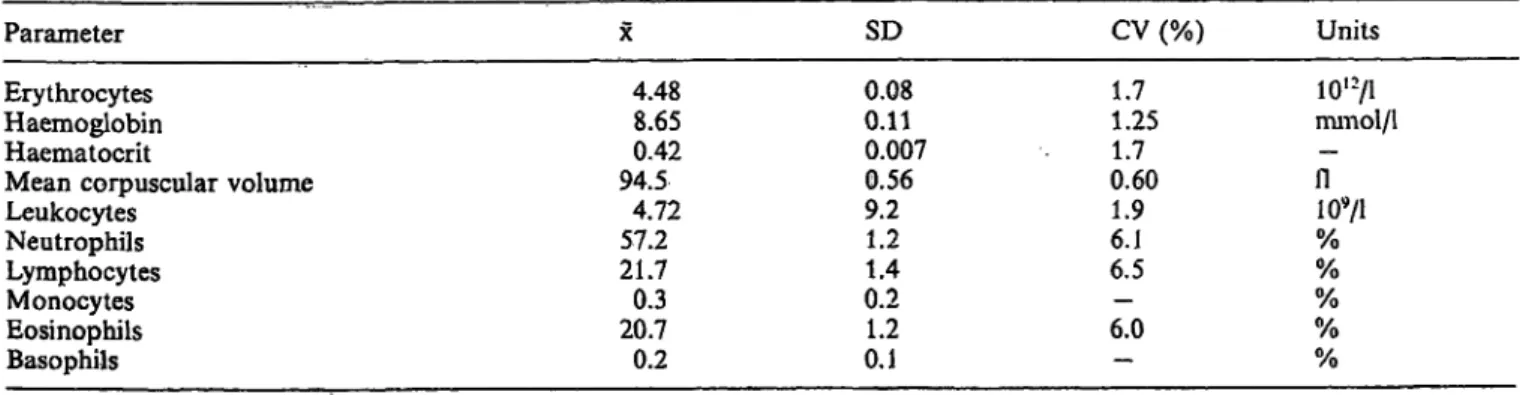
Run-to-run precision
For five consecutive days a freshly opened vial of Ortho Normal-15 Control Blood was analysed in two replicate analyses. The results were stored in an empty control file and the CV's were calculated (tab. 2).
Influence of the preservation time on the count
Several patient samples were analysed ten times at hourly intervals. Samples were kept at room temper- ature. All haematology parameters, included the leu- kocyte differentiation, were examined.
The quality of the instrumental differentiation was not influenced for a normal working day (8 hours).
Evaluation criteria for the leukocyte differ- ential count
We examined the correlation between the differential cell-populations produced by the Cell-Dyn 3000 and the reference method, i.e. lymphocytes vs lympho- cytes, neutrophils vs neutrophils, monocytes vs mono- cytes, eosinophils vs eosinophils and basophils vs ba- sophils.
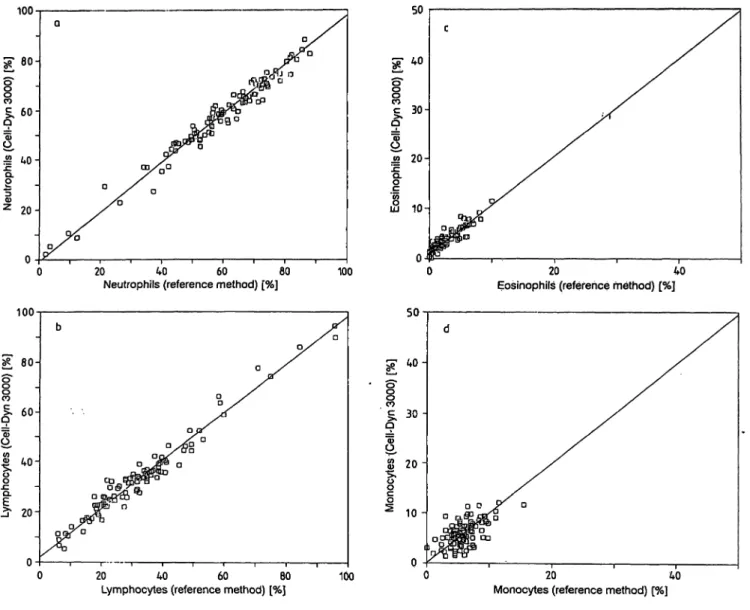
Accuracy may be defined äs the degree of conformity to a true value. When comparing a new method with a reference method, which in this case is regarded äs a true value, the intercept, slope and correlation coef- ficient indicate the accuracy of that new method (fig.
la-d).
For a füll scale of values from low to high, the Cell- Dyn 3000 scores very well for neutrophils, lympho- cytes, eosinophils and less for monocytes. This
Tab. 1. Within-run precision of the Sequoia Turner Cell-Dyn 3000 for Ortho Normal-15 Contol Blood.
Between brackets the results for a fresh normal patient sample.
Parameter SD CV % Units
Erythrocytes Haemoglobin Haematocrit
Mean corpuscular volume Leukocytes
Neutrophils Lymphocytes Monocytes Eosinophils Basophils
4.458.7 0.422 94.74.9 56.5 21.70.3 21.30.2
0.030.0 0.004 0.20.1 1.31.5 0.20.8 0.2
0.80.4 0.80.2 2.92.7(1.8) 6.0 (1.1) - (4.4) 3.7 (9.4) - (6.6)
io'
2/i
mmol/1
n
— 109/1% %
% %
%
Tab. 2. Run-to-run precision of the Sequoia Turner Cell-Dyn 3000 for Ortho Normal-15 Contol Blood.
Parameter SD CV (%) Units
Erythrocytes Haemoglobin Haematocrit
Mean corpuscular volume Leukocytes
Neutrophils Lymphocytes Monocytes Eosinophils Basophils
4.488.65 94.50.42 57.24.72 21.70.3 20.70.2
0.080.11 0.007 0.569.2 1.41.2 0.21.2 0.1
1.71.25 0.601.7 1.96.1 6.5— 6.0
—
io'
2/i
mmol/1
- -
109/1
% %
% %
%
108 van Leeuwen et al.: Evaluation of the Sequoia Turner Cell-Dyn 3000 100
9
l
20-
20 40 60 60
Neutrophils (reference method) [%] 100 100
0 20 40 60 80 Lymphocytes (reference method) [%]
Fig. 1. Orthogonal regression of the Cell-Dyn 3000 versus the a. % Neutrophils
Intercept = -0.602594, slope = 0.98482 r = 0.96538
Sb = 0.026899, Sa = 1.61512, SyO = 1.59934 b. % Lymphocytes
Intercept = 2.084834, slope = 0.96066 r = 0.98101
Sb = 0.01919, Sa = 0.70819, SyO = 0.74555
50
g
o 30 -
2 0 -
10 -
20 40 Eosinophils (reference method) [%]
— —20 40
Monocytes (reference method) [%]
400-cell manual differentiation c. % Eosinophils
Intercept = 1.02075, slope = 0.97890 r = 0.90981
Sb = 0.04513, Sa = 0.14266, SyO = 0.18162 d. % Monocytes
Intercept = 0.160106, slope = 0.99428 r = 0.60863
Sb = 0.134059, Sa = 0.79252, SyO = 0.81277
method, however, is not very useful for the low values of the basophil count. Therefore, we plotted the dif- ference per differentiation against the mean differ- ence, then measured the intercept.
As a control, we also used this techniques on the monocyte and eosinophil population. Values corre- lated well with the intercept values (tab. 3).
Assignment of the classification "normal" or "path- ological" was made on the basis of the reference values in use in our laboratory which compare well with the reference ranges mentioned in the literature (16) (tab. 4).
The lower limit for the eosinbphils, however, was decreased to "0" since löw values are of no clinioal importance and therefore were catalogized äs normal.
Specificity and sensitivity
Each sample analysed was placed in one of four groups "true normal (TN)", "true pathological (TP)",
"false normal (FN)" and "false pathological (FP)".
The reference method (manual differentiation) is used äs the Standard to determine. whether a sample is normal or pathological. * *
van Leeuwen et al.: Evaluation of the Sequoia Turner Cell-Dyn 3000 109 Tab. 3. Difference per differentiation against the mean diflfer-
encc.
A. Monocytes: Mean diflerence = H-0.16 % B. Eosinophils: Mean difierence = + 1.055%
C. Basophils: Mean difierence = +0.586%.
Tab. 4. Reference interval (normal ränge) for microscopic blood cell differentiation and for the Sequoia Turner Cell-Dyn 3000. Based on these ranges, the results are classified äs "normal" or "pathological".
Sl-units Percentages Lymphocytes
Neutrophils Monocytes Eosinophils Basophils
0.8 -4.8 2.0 -8.2 0.08-1.2 0.08-0.6 0.0 -0.2
20-40 50-68 2-102- 5 0- 2
The following indices were calculated for the Cell- Dyn 3000:
Sensitivity = TP/(TP + FN);
Specificity = TN/(TN + FP);
Predictive value of true^positive test results among all positive test results = TP/(TP + FP);
Predictive value of true-negative test results among all negative test results = TN/(TN + FN);
Efficiency = TP + TN/(TP + FN + FP + TN).
In both comparisons, microscopic differentiation of the 100 smears revealed 36% äs "normal" and 64%
äs "pathological" (tab. 5).
Discussion
Because of the good linearity (leukocytes up to 99.9 109/1, erythrocytes up to 7.00 1012/1), accuracy and reproducibility, together with the good sensitivity and the fair specificity, the Cell-Dyn 3000 fulfils its purpose äs a sieve function. Although the specificity is 77.9%, this has only minor consequences for the total workload. In fact, put to the test, our daily workload in manual differentiations has fallen to 30%
of the total.
In our opinion, the evaluation method has proved to be suitable, providing within one week an evaluation of the possibilities and impossibilities of an instru- ment.
The results of our study show that the rate of "false normal" results represents only l % of the total. The impression exists that an enlargement of the test sam- ple size will give an even better result, because the deviant sample showed only minor differences.
Of 2 microscropically abnormal specimens, which had no flags in the Cell-Dyn, one could be eliminated because of a double population in the erythrocyte graph. The other one showed only negligible differ- ences between the manual and Cell-Dyn values.
Of the eight samples which were abnormal in the Cell- Dyn, seven showed relatively small differences and would normally have been accepted äs normal for clinical purposes. Only one was a case of mild mono- cytosis (11.5% against 6.5%).
This means that the results for diagnostic sensitivity, specificity, efficiency and predictive value are in prac- tice better than the ones showed in table 6.
Tab. 5. Evaluation of the analysis of 100 blood samples. Mi- croscopic differentiation is the reference.
l. Differentiation in percentages.
Cell-Dyn 3000 Reference Pathological
Normal
2. "Total" Differentiation.
Pathological Normal
598 5
28
Reference Pathological Normal
Cell-Dyn 3000 Pathological 638
Normal 281
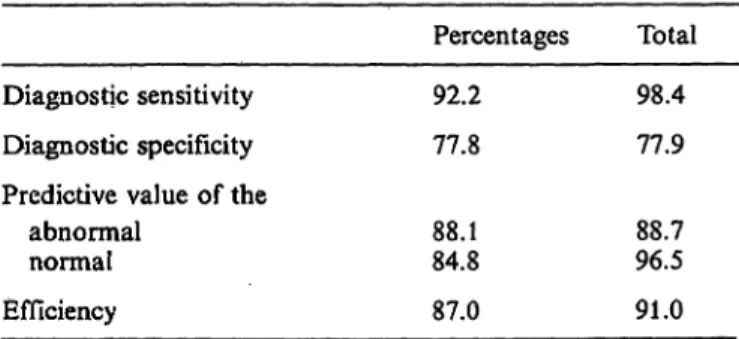
Tab. 6. Diagnostic values of the Sequoia Turner Cell-Dyn 3000 results, expressed äs the % probability with the results of the microscopic differentiation.
Diagnostic sensitivity Diagnostic specificity Predictive value of the
abnormal normal Efficiency
Percentages 92.2 77.8 88.184.8 87.0
Total 98.4 77.9 88.796.5 91.0
A left shift without increased leukocyte count is not always alerted, for example in the case of an extra- medullar haemopoesis.
110 van Leeuwen et al.: Evaluation of the Sequoia Turner Cell-Dyn 3000
Although showing an absolute mean difference of 1.055% in relation to the manual differentiation, the apparatus gives a fair representation of the decrease or increase in eosinophils.
It is also notable that the Cell-Dyn 3000 normally does not count the nucleated red blood cells äs leu- kocytes. In the case of numerous erythroblasts or basophilic normoblasts, however, the Cell-Dyn 3000 fails, because it cannot distinguish these greater cells from lymphocytes. In the case of a massive normo- blastosis (ratio: 185 normoblasts to 100 leukocytes) there is an overflow into the lymphocyte count. A massive normoblastosis, however, is for the attentive operator visible äs a 'cluster' beneath the lymphocyte Population in the scattergram.
In one patient with an infection of Plasmodium fal- ciparum (with ring forms and gametocytes) the ap- paratus did not recognize the intracellular inclusions.
Yet it gave an alert, because of the monocytosis (25%).
We have also noticed that the control blood in use was not suitable for instrumental differentiation with the Sequoia Cell-Dyn 3000. This was the case with all Impedance Control Blood. With fresh human blood, the coefficient of Variation for the leukocytes and leukocyte subpopulations ^as far better (tab. 1).
This is probably due to the fact that living leukocytes do not shrink while being counted in the Cell-Dyn 3000.
To summarize, we have found that the Sequoia Turner Cell-Dyn 3000 is a reliable and accurate differential cell counter. The fact that the Cell-Dyn 3000 uses the leukocytes without stripping, lysing, colouring, etc., gives us much more confidence in the results.
Moreover, the use of physical measurmg principles for all the determinations, means that the Instrument is mechanically robust with an easy-to-perform main- tenance.
References
1. National Committee For Clhiical Laboratory Standards:
NCCLS Tentative Standard, H20-T: 1984, 4.
2. Breakell, E. S., Marchand, A., Marcus, R. & Simson E.
(1985) Comparison of Performance for Leukocyte Differ- ential Counting of the Technicon H6000 System with a Manual Reference Method Using the NCCLS Standard.
Blood Cells //, 257-279.
3. Sallitt, R. L., Ho, T. T. & Rodriguez, R. R. (1985) Evalu- ation of Leukocyte Differential Counts on the QBC Cen- trifugal Hematology Analyzer According to NCCLS Stand- ard H20-T. Blood Cells 11, 281 -294.
4. Buergi, W. & Marti, H. R. (1989) Automated Blood Count Analysis by Trimodal Size Distribution of Leukocytes with the Sysmex E-5000. J. Clin. Chem. Clin. Biochem. 27, 365- 368.
5. Ennen, J., Bauerle, R. & Schriewer, H. (1990) Vergleich der Bestimmung von Leukozytenpopulationen am Coulter VCS mit der Mikroskopischen Differenzierung. Lab. Med. 14, 102-110.
6. Verbruggen, H. W., Wessels, J. M. C., Boezeman, J. B. M.
& Haanen, C. (1989) Vergelijking van de microscopische leukocytendifferentiatie met de geautomatiseerde leukocy^
tendifferentiatie op de Hl. Tijdschr. NVKC 14, 109-115.
7. Thomas, L., Mueller, Th. & Rodrian, J. (1989) Vergleich der Bestimmung von Leukozytenpopulationen am Techni- con Hl mit der mikroskopischen Differenzierung. Lab.
Med. 13, 213-219.
8. Smeets, E. H. J. & van Wersch, J. W. J. (1988) Performance of a Three-part Dif Impedance Cytometer (Sysmex E-4000) in Comparison with a Cytochemical Cytometer (Technicon H-6000). J. Clin. Chem. Clin. Biochem. 26, 531-540.
9. Wielders, J. P. M., Beunis, M. H. & van Wersch, J. W. J.
(1986) A Comparison of the Screening Abüity of Two Automated Leukocyte Differential Counters. J. Clin.
Chem. Clin. Biochem. 24, 472-480.
10. Katz, N. & Lenz, T. (1988) Vergleich der Volumen-Vertei- lungs-Analyse von Leukozyten am Coulter Stacker mit der cytochemisch-cytometrischen Klassifizierung am Technicon H 6000 und der mikroskopischen Differenzierung. Lab.
Med. 10, 354-362.
11. van Wersch, J. W. J. & Bank, C. (1990) A New Development in Haematological Cell Cöunting*: The Sysmex NE-8000, Automaton for Cell Count and Physical Five-Part Leuko- cyte Differentiation. J. Clin. Chem. Clin. Biochem. 28, 233-240.
12. Kohut, M. L. (1989) An Abbreviated Method for Assess- ment of Electronic Differential Leukocyte Counters. Lab- medica, Vol VI, 4, 27-34.
13. Salzmann, G. C, Growel, J. M. & Martin, J. C. (1975) Cell Classification by Laser Light Scattering. Identification and Separation of Unstained Leukocytes. Acta Cytol. 19, 374—
14.Terstappen, L. W. M. M., de Groothj B. G., Visscher, K.,377.
van Kouterik, F. A. & Greve, J. (1987) Four^Parameter White Blood Cell Differential Counting Based on Light Scattering Measurements. Cytometry 9, 39—43.
15. de Grooth, B. G., Terstappen, L. W. M. M., Puppels, G.
J. & Greve, J. (1987) Ligm>Scattering Polsirization Meas- urements äs a New parameter in Flow Cytometry. Cyto- metry 8, 539 - 544.
16. Wintrobe, M. M. (1981) Climeal Hematology. 8th edn., p. 1888, Lea & Febiger, Philadelphia.
Drs. L. van Leeuwen Medische Laboratoria Sint Jansgasthuis Vogelsbleek 5 NL-6001 BE Weert