A Comparison of Punishment Rules in Repeated Public Good Games
∗– An Experimental Study –
Torsten Decker†, Andreas Stiehler‡, Martin Strobel§ June 2002
Abstract
In this experimental study we analyse three collective and one individual punishment rule in a public good setting. We show that under all punishment rules cooperation is stronger and more sustainable than reported from settings without punishment. Moreover, we present evidence and explanations for differences between the rules concerning punishment intensity, contribution and profit levels, as well as justice. Finally, we investigate influences crucial to participants’ support for a collective rule when the individual rule is the status quo. We show that beside profit differences the degree of consent required by the collective rule is essential for the degree of support by the participants.
Keywords: public good, free-riding, cooperation, punishment institution, experiment.
JEL classification: H41, D70, C92.
∗We thank Jörg Breitung, Simon Gächter, Werner Güth and Michael Kvasnicka for helpful comments as well as Urs Fischbacher for z-Tree. Financial support by Deutsche Handelsbank, Berlin and Deutsche Forschungsgemeinschaft (through SFB 373) is gratefully acknowledged.
†Institut für Operations Research, Humboldt-Universität zu Berlin, Spandauer Str. 1, 10178 Berlin, Germany, email:
decker@wiwi.hu-berlin.de
‡Institut für Wirtschaftstheorie III, Humboldt-Universität zu Berlin, Spandauer Str. 1, 10178 Berlin, Germany, email:
stiehler@wiwi.hu-berlin.de
§International Institute of Infonomics, c/o MERIT, Maastricht University, P.O. Box 616, 6200 MD Maastricht, The Netherlands, email: Martin.Strobel@infonomics.nl
1 Introduction
A distinctive characteristic of public goods is free access to the common good irrespective of each person’s contribution to the provision of the good. This characteristic creates the incentive to free-ride, i.e. enjoy the benefits while staying away from the provision. While free-riding is rational at the individual level, it produces socially undesirable outcomes at the aggregate level. Economists and scholars in other social sciences directed a lot of research to solve this dilemma.
One idea to solve this dilemma is by implementing additional institutions that create incentives for rational individuals to participate in the provision, e.g. a sanctioning system. Unfortunately, in a framework of rationality and selfishness, a new dilemma arises: no individual is willing to bear the costs of implementing or supporting the institution. This famous problem is known as the second order dilemma, or second order public good (Oliver 1980, Bates 1988).
From experiments and casual observations in reality, however, we have evidence that punishment systems are indeed effective tools to promote cooperation. As a result of field studies, Elinor Ostrom (1990) worked out seven design principles which are crucial to the success or failure of a group or society facing a social dilemma. One of them is sanctioning.1 Fehr and Gächter (2000) showed experimentally that costly punishment opportunities, despite their dilemma characteristics, are utilized by the partici- pants and are able to raise and stabilize cooperation in a public good environment. In their experiment they introduced a sanctioning system in which each participant had to decide individually whether and to what extent she wants to punish another person. The leverage, however, was rather high. The cost for imposing afine to sombody else was only a third of the fine.
If the costs for punishment are high, though, members of a group probably wish to decide together on the potential punishment of free-riders sharing the associated costs. Ostrom reports cases, where the decision on punishment was found in a joint and organized way, e.g. in a vote. Another example, the so-called Stability Pact contains a sanctioning system in which the EMU members decide together on the punishment of countries endangering the stability of the Euro. A collective sanctioning system
1Though Ostrom’s mainfield of study is long enduring Common Pool Ressources, she argues that ”given the similarity between many CPR problems and the problems of providing small scale collective goods, thefindings of this volume should contribute an understanding of [...] the capabilities of individuals to organize collective action related to providing local public goods.” (Ostrom 1990, p. 27).
may be useful if the very structure of individual punishment bears strong incentives to abstain from punishment (Weesie and Franzen 1998), or is likely to escalate and cause heavy damages.
Two crucial questions may arise when designs of collective rules are considered:
1. Is it feasible that people accept the collective decision with all its implications although they favoured a lower or higher punishment?
2. Given a positive answer to question 1, why is it not feasible to directly enforce a full contribution at the public good stage.
With respect to thefirst question, we argue that an institution like a collective punishment rule is set up in order to continually gain benefits from it. Opposing it in one case could put the whole institution at risk. So, once people erected an institution they will probably continue to obey it for their long-term benefit. Moreover, it is conceivable that the enforcement of the institution is backed by an authority which was erected by the people in advance and is out of control in the current situation. Ostrom (1990) reports on successful cases where people designed sophisticated systems in order to ensure that punishment costs are shared.2 Whether people are indeed willing to submit themselves to an institution like a collective punishment rule is one of the questions we seek to answer in this work.
The answer to the second question makes it important to distinguish between the initial public good in thefirst stage and the public good “punishment” in the second stage. A certain feature of collective punishment regulation is that punishment becomes a central issue and is, therefore, easy to enforce as discussed above. In contrast, the contribution decision remains in private responsibility and cannot be transferred to a central or an outside institution. In some cases the contribution is even not or only ex-post observable. Thus, a participant deciding by herself on her contribution still faces incentives to free-ride. Even a contract among the participants that fixes contributions is no credible commitment and, therefore, likely to be violated.
For the reasons given above we assume in this paper that contributions to the public good in the first stage are not enforceable whereas the decided punishment in the second stage is. Our main goal is to investigate collective punishment rules and confront them with an individual rule which we consider an initial position. The following questions are central to our analysis:
2She reports, for example, on irrigation systems in Spain where guards and so-called “Ditch riders”, were paid for monitoring, reporting violations and bringing charges against farmers (Ostrom 1990, pp.69-78).
• Are collective punishment rules able to bring about stronger cooperation and/or higher profits in a public good setting than an individual rule?
• To what extent do different collective rules perform differently from each other with respect to contribution, efficiency, and justice?
• Will participants agree to submit themselves to a collective rule, even if this means to give up some individual freedom? Which rule is prefered?
In order to find answers to the above questions we designed an experiment in which subjects re- peatedly play a public good game. Inbetween the rounds they had the possibility to punish each other according to different rules. Every subject experienced a collective punishment rule and an individ- ual punishment rule (volunteers dilemma). After that subjects could bid for the right to choose the institution for the lastfive rounds.
The results of our experiment suggest basically that the more severe an institution is the higher is the contribution to the public good but the lower is the willingnes of subjects to accept this institution. In the remainder of the paper we willfirst describe the experimental design (Section 2), then establish some links to the literature which guided our expectations (Section 3) and report detailed expectations and results (Section 4), and eventually conclude (Section 5). Furthermore the instructions of the experiment can be found in the appendix.
2 The Experiment
In our experiment subjects played a two stage game for 20 periods in groups of four. The first stage consisted of a standard linear public good game (see Ledyard 1995). Each group memberireceived an initial endowment of ECU 20.— (Experimental Currency Unit) and had to decide about which amount xi to contribute to a public good (“pot”). The pot was multiplied by 1.6 and then equally distributed among the four group members regardless of their contribution. Thus, ECU 1.— contributed to the pot had a marginal return of ECU 0.40 to each participant, whereas ECU 1.— kept for oneself had a marginal return of ECU 1.— to that participant, only. The preliminary payoffof subjectiin groupGtherefore is:
Πprei = 20−xi+ 0.4X
j∈G
xj.
In stage two, the punishment stage, every participant got to know the other group member’s action and could propose punishment amounts for each of the others. They had to be chosen from all even amounts between ECU 0.— (meaning no fine) and ECU 20.—. Thus every participant faced three pun- ishment proposals (further called triplet) from the other group members against herself. Thefine which was actually imposed on the participant was determined according to specific rules described below. All rules have in common that the imposed punishment caused costs of exactly the same amount. Hence, the rules basically determine the size of the fine and who is going to bear the costs:
Individual rule (indi): The highest proposal out of the triplet was chosen and put into action. The person who proposed that highest amount had to bear the costs of the punishment. If there happened to be two or three equally high maximal proposals, the person who had to bear the costs for punishing was chosen randomly among them.
We consider this rule to be the fall-back possibility which is always feasible whithout the presence of any institution. Many situations have the characteristic that the action of only one person is sufficient to reach a certain goal, and no additional gain can be made when another person joins the action. Imagine that people who in disciplined manner are waiting in a queue observe a person jumping the queue.
While many may feel upset, it is probably sufficient if one person rises up and scolds the ”free-rider”.
The others who already had similar intentions may be satisfied then and abstain from further action.
Collective rules (mini, medi, maxi): We distinguish between three collective rules - mini, medi, maxi - depending on which of the three proposals in a triplet was put into action. With all three collective rules we assume that a person is monotone in her wish to punish, i.e. a person who proposes a certainfine will also approve any lowerfine.
• In the mini-rule the lowest proposal was chosen. This rule can be considered a unanimity vote.
• In the medi-rule the medium proposal was chosen. This corresponds to a majority vote.
• In the maxi-rule the highest proposal was chosen. This rule can be interpreted as a sort of minority voting.
decisive proposal
most severe median least severe who pays? decisive proposer indi
all maxi medi mini
Table 1: Who decides on the level of punishment against a participant, and who bears the costs.
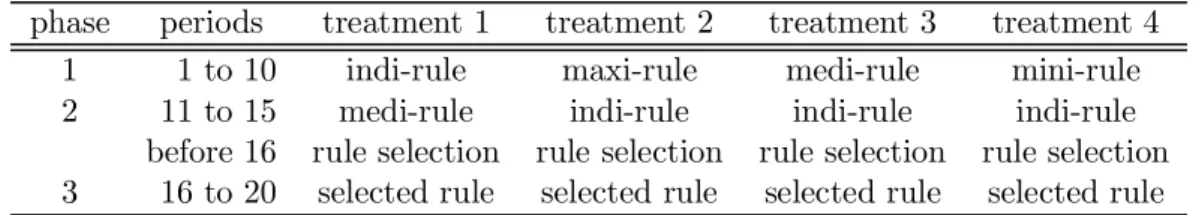
phase periods treatment 1 treatment 2 treatment 3 treatment 4 1 1 to 10 indi-rule maxi-rule medi-rule mini-rule 2 11 to 15 medi-rule indi-rule indi-rule indi-rule
before 16 rule selection rule selection rule selection rule selection 3 16 to 20 selected rule selected rule selected rule selected rule
Table 2: Overview of the four different types of treatments we conducted.
As with the individual rule, incurred costs were equal to the actual punishment amount. In contrast to the former, costs for punishing one subject under a collective rule were now shared by the three remaining participants. Each of them had to pay one third of the total costs regarding the level of the fine to be imposed, irrespective of one’s own proposal. Table 1 illustrates the different rules.
Thefinal profitΠf inali for a participantiwas calculated from her preliminary profitΠprei , the sanction si she received, and her costs for sanctioning others c(sj) as follows:
Πf inali =Πprei −si− X
j∈G,j6=i
c(sj).
In a summary displayed at the end of each period participants were informed about the actual punishment they received themselves, the costs they incurred by punishing others, as well as theirfinal profit. Additionally, they got information on whether and to what extent other persons were punished.
They did not get to know the individual punishment proposals. Theirfinal profits were credited to their respective accounts, and a new period began.
Having described the design of one period, we now turn to the structure of the treatments. In order to compare different punishment rules as well as to measure people’s willingness to accept them we let subjects experience two different rules (in periods 1 to 15) and then auctioned offthe right to determine the rule for a third phase (periods 16 to 20). An overview of the treatments is provided in Table 2.
Since we are interested in people’s willingness to submit themselves to a collective rule given that the individual rule is the status quo, all participants had to experience both a collective and the individual
rule before arriving at the selection procedure. Therefore, any collective rule was followed by the indi- rule, whereas the indi-rule was followed by the medi-rule as a prominent example3of the collective rules.
Moreover, complementing the indi-rule with a collective rule allows us to check whether the sequence of rules matters for the rule selection.
The selection procedure was designed not only to find out which rule a person favours but also to receive indication of how strongly she prefers this rule. Each participant was asked to announce the rule she favours, and an amount which she was willing to pay to be dictator in this selection procedure.
For this purpose an extra ECU 60 was credited to each participant’s account. The proposal supported by the highest amount was then applied, and the amount removed from the dictator’s account. All other proposals were ignored, and the assigned bids were not subtracted. If there were two or more equally high maximal bids, the dictator was chosen randomly among them. Periods 16 to 20 in which the selected rule was actually applied served as an incentive for thoughtful participation in the prior selection process.
2.1 Implementation
We converted the experimental design into a computer program using the software z-Tree (Fischbacher 1999). The experiments were conducted in the experimental laboratory at Humboldt University in Berlin. In order to run eight observations of each treatment, we recruited 128 students from the economics faculty. Eight people were invited at a time and randomly assigned to two groups. The participants did not know which of the remaining seven people belonged to their group. Though the participants were informed that the experiment consisted of three phases the instructions were not handed out until the beginning of the corresponding phase and the selection procedure, respectively.
During the experiment all interaction took place through computers. Each group member was given a number (ID) which was used as an identifier for the other group members. Within a phase the IDs were constant but after each phase they were randomly permutated in order to diminish carryover effects from one to the other phase (subjects were informed about this). The decisions in the experiment were materially motivated. The average earning of a subject was 9.5 Euro.
3Remember that the medi-rule resembles a majority vote.
3 Links to the Literature
Before formulating concrete hypotheses about the likely outcomes of the experiment we briefly summa- rize some theoretical approaches suitable for our purpose.
Assuming rationality and common knowledge of rationality, punishment will not occur in the last period, since it is costly and no additional profit can be gained from it. Therefore, the punishment threat is incredible. This, in turn, leads to zero contribution in the last period. Using backward induction we conclude that neither punishment nor cooperation will occur in any period. For thefinite game this is the only Nash-equilibrium which is both subgame-perfect and trembling hand-perfect.4
From both experimental studies and real life we know that the assumption of rational individuals is often violated. Many people are willing to engage in cooperation despite adverse incentives; Dawes and Thaler (1988) for example found non-negligible cooperation levels in one-shot public good decisions.
Moreover, participants may become angry about unfair behaviour and are ready to punish even if it is costly. Experimental evidence for the latter assertion was found not only in public good situations but also in a variety of other settings. Responders in ultimatum games reject unfair offers (Güth and Tietz 1990). In gift exchange games Fehr, Gächter and Kirchsteiger (1996) found behaviour displaying patterns of cooperation and reciprocity. Fehr and Gächter (2000) presented evidence for people’s willingness to punish unfair behaviour, as well as report high cooperation levels in public good settings.
A variety of approaches exist, in which economists try to explain these contradictory results by introducing elements of altruism, fairness, and/or reciprocity into people’s considerations, mostly by incorporating additional terms into their preferences.
Rabin (1993) emphasizes reciprocity in a person’s behaviour. The core of his approach is that “people like to help those who are helping them, and to hurt those who are hurting them” (Rabin 1993, p.1281).
Levine (1998) presents a theory of altruism and spitefulness in which people’s utilities depend on their own and their fellow players’ pay-offs. The degree to which a person takes other people’s pay-offs into account is specific to that person and varies among the population. The former two approaches model
4For indi and mini no other subgame-perfect equlibrium exists. However, for medi and maxi, the voting prodcedure causes numerous subgame-perfect equlibria in weakly dominated strategies to exist. This is due to the fact that individuals do not have a decisive vote in many situations.
both altruism and reciprocity in participants’ utility functions, whereas Andreoni and Miller (2002) focus on altruism alone.5
While cooperation in a public good game is in line with all three approaches, punishment can be explained only if reciprocity or spitefulness is part of the model as is the case in Rabin’s and Levine’s approach.
Recently two approaches pioneered by Bolton and Ockenfels (2000) on the one hand, and by Fehr and Schmidt (1999) on the other hand have received attention in the public good context and beyond. They have in common the introduction of an inclination to equity of pay-offs into people’s motivation. This means that punishment could be used to reduce inequity after the public good stage. The application of inequality aversion is however questionable in the case of the indi-rule. It would only work out if it were the free-riders to engage in punishment which is not the case (as we will see later).
Pruitt and Kimmel (1977) address the topic from a psychological perspective and emphasize the role of trust. Their goal/expectation theory suggests that most people recognize the need for and share the goal of establishing mutual cooperation. In order to achieve cooperation, the common goal “must be accompanied by an expectation that the other will cooperate [...] ” (Pruitt and Kimmel 1977, p.375).
The goal/expectation theory has been extended by Yamagishi (1986) to the structural goal/ ex- pectation theory. He argues that people are conditionally willing to cooperate in the sense Pruitt and Kimmel suggested. The main obstacle to cooperation is a lack of mutual trust. However, the opportu- nity to cooperate in a second order public good, e.g. a sanctioning system, will be utilized to establish trust necessary for durable cooperation. He provides experimental evidence that people showing a lack of mutual trust display uncooperative behaviour (relative to groups of rather trusting people)6 in the absence of a sanctioning system. The same people make relatively heavy use of punishment opportuni- ties and achieve higher cooperation levels than their trusting counterparts when a sanctioning system is provided. Further evidence for conditional cooperation is given by Fischbacher, Gächter and Fehr (2001).
We consider as the essence of all approaches that there is at least a fraction of people conditionally willing to contribute to a common goal despite adverse incentives, and that there are people ready to punish if they feel unfairly treated.
5Additionally, they allow for nonlinar preferences.
6On basis of a preexperimental questionnaire Yamagishi subdivided participants into groups of so-called high- and low-trustees.
4 6 8 10 12 14 16 18 20 22
1 2 3 4 5 6 7 8 9 10
Period
Average contribution
maxi indi medi mini
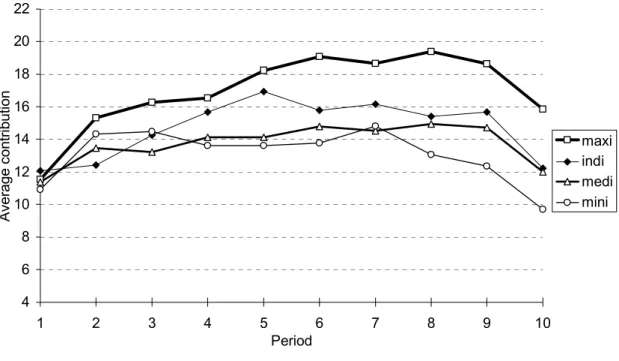
Figure 1: Average contribution over periods.
4 Hypotheses and Results
In most of our analysis we concentrate on phase 1 (period 1 to 10) and the selection procedure (choice of the rule). The data from phase 2 is difficult to interpret since it is not clear to which extent there are carryovers from one rule to another. Phase 3 was primarily introduced to give the subjects incentives to take the auction seriously.
Figures 1, 2, and 3 give the reader a general idea of the behavior in the first phase. They show the average contribution, carried out punishment and efficiency, respectively.
Obviously, punishment occurred and helped to establish and stabilize cooperation in all rules though a stylized fact of public good games without punishment opportunities is a strong deterioration of cooperation over time (Fehr and Gächter 2000, Ledyard 1995). However, there are still differences between the rules. While in terms of contributions the rules display visibly different courses with a clearly superior maxi-rule, the evolution of profits paints a rather vague picture. Interestingly, the initial average contribution is similar for all different rules. Apparently, people did not anticipate the rules’ different peculiarities but rather react to them in the course of the repeated game. A further
0 2 4 6 8 10 12 14 16 18
1 2 3 4 5 6 7 8 9 10
Period
Average received punishment
maxi indi medi mini
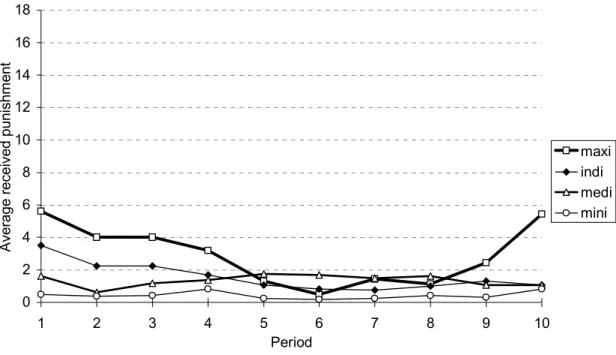
Figure 2: Average received punishment over periods.
14 16 18 20 22 24 26 28 30 32
1 2 3 4 5 6 7 8 9 10
Period
Average profit
maxi indi medi mini
Figure 3: Average profit ( = efficiency) over periods.
important observation is that the lines of the average contribution are hump-shaped. People seem to learn to cooperate but towards the end of the phase they show an end game effect.
In the following subsections we analyse the data in more detail. Thereby we use relation  in a generic sense denoting higher and better respectively. In most regressions on averages of single groups over the first 10 rounds rather than on individual data. This procedure allows us to base our tests on independend observations.
4.1 Punishment
4.1.1 Number and extent of punishment proposals
The fact that punishment is able to substantially change people’s behaviour in public good settings necessitates closer investigation of the motives behind punishment: On one hand, it can be the anger about another person’s contribution. In this case we speak of emotional punishment. On the other hand, one might wish to punish in order to induce higher future contributions by the punished person and, as a result, to generate higher cooperation within the group. We refer to this as the strategic punishment.
Hypothesis 1 Both, strategic and the emotional punishment exist and are non-negligible.
If the strategic motive existed, punishment activity should weaken towards later periods, as the benefit from establishing future cooperation decreases. To check this we calculated the total amounts of punishment proposals7 occurring in a period and compared the first five periods with last five periods.
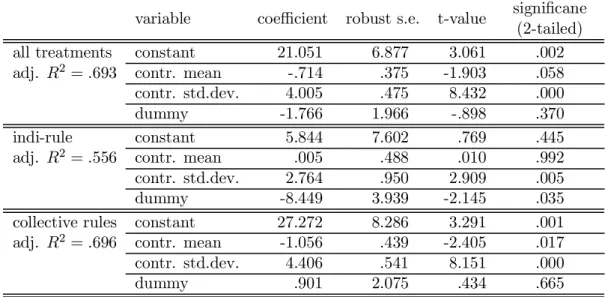
Apart from the influence described above, we recognize the contribution’s mean and standard deviation as possible determinants for punishment activity. Thus, we performed a linear regression explaining the total amount of punishment proposals in a period by the mean and standard deviation of contributions of that period, and a dummy variable with values 0 or 1 for observations for the first and the last five periods, respectively. Since it is reasonable that a particular group is more or less active in punishment throughout all periods, we applied a fixed effect estimation which allows each group to have its own intercept. Moreover, the regression was done separately for the indi-rule, the collective rule, and all rules
7Total amount of punishment proposals means the sum of all proposals one participant suggested for the others, aggregated over all four participants.
variable coefficient robust s.e. t-value significane (2-tailed)
all treatments constant 21.051 6.877 3.061 .002
adj. R2 =.693 contr. mean -.714 .375 -1.903 .058
contr. std.dev. 4.005 .475 8.432 .000
dummy -1.766 1.966 -.898 .370
indi-rule constant 5.844 7.602 .769 .445
adj. R2 =.556 contr. mean .005 .488 .010 .992
contr. std.dev. 2.764 .950 2.909 .005
dummy -8.449 3.939 -2.145 .035
collective rules constant 27.272 8.286 3.291 .001 adj. R2 =.696 contr. mean -1.056 .439 -2.405 .017
contr. std.dev. 4.406 .541 8.151 .000
dummy .901 2.075 .434 .665
Table 3: Linear regression of the total amount of punishment proposals in a period on a constant, contri- butions’ mean and standard deviation of that period, and a dummy indicating whether an observation belongs to the former or the latterfive periods.
together. Eventually, we chose to report (White’s) robust standard deviations and t-ratios to account for possible dependencies within the ten observations from one group. The results are reported in Table 3.
As can be seen, the dummy is only significant for the indi-rule. There is no sign of weakening punishment behaviour under the collective rules. One possible explanation is that other (emotional) motives grow as the strategic motive loses strength. We conjecture that in the collective rules increasing emotional punishment neutralizes lower strategic punishment in the last periods whereas emotional punishment is dampened by the volunteer’s dilemma in the indi-rule. If one person repeatedly bore the costs for punishment alone she may feel exploited and understandably abstains from future engagement in punishment. However, this explanations cannot be verified in this study.
The existence of emotional punishment can be checked easily. If we observe punishment activity in the very last period of a treatment, we have to deduce that emotional punishment plays an important role since strategic punishment is futile in the last period. The data strongly supports emotional punishment.
In 24 out of 32 groups (indi: 5/8, maxi: 5/8, medi: 7/8, mini: 7/8) punishment proposals occurred in period 10. One may object that there is still reason for strategic punishment in period 10 of the first phase since people may speculate that they encounter each other in a similar game in the second or
third part of the experiment. Thus, we also looked at the last period of the third phase, which definitely contained the last period of the entire experiment.8 Again we found punishment activity across all rules (indi: 9/12, maxi: 1/2, medi: 9/12, mini: 5/6).
Subjects anticipate, however, punishment to be strategic rather than to be emotional and decrease their contribution to the public good at the end of the phase. To the contrary, at least some individuals seem to be more emotional than anticipated which can be seen by the punishment curve of the maxi treatment.
The punishment curve for the indi-rule resembles best the characteristics of a standard public good dilemma. Carried out punishment starts rather high and decreases towards the end. It carries features of a so-called volunteer’s dilemma.9 The positive effects of punishment on cooperation can be enjoyed by everyone, whereas the costs are borne by that participant who proposed the highest amount. This dilemma in its various forms has been described and analysed by Diekmann (1993), Weesie (1993),(1994) and Weesie and Franzen (1998). Most relevant is the work by Weesie and Franzen in which they show both theoretically and experimentally that the probability of the public good (here: punishment) being provided increases under the condition of cost sharing. In our setting this translates into more and heavier punishment proposals under the collective rules. One may also take on a simpler view:
Punishment is, for an individual, less costly under a collective rule than under the indi-rule; strictly speaking, the costs reduce to one third. Hence, we state:
Hypothesis 2 Punishment activity (measured by proposals) is weaker under the indi-rule than under the collective rules.
In order to analyse this, we confront the total extent of punishment proposals in a period averaged over ten periods in indi-treatments with the same measure from collective ones. In order to control for the influence of the contributions’ mean and standard deviation, as well averaged over ten periods, we again applied a linear regression including a dummy variable with value 0 for observations from indi treatments and value 1 for those from collective treatments. Table 4 reports on the results. We find
8This was known by the subjects.
9Strictly speaking, we assume the existence of an asymmetric volunteer’s timing dilemma for individual punishment.
Following Weesie (1993) the person with the strongest need for the provision of the good (punishment) is most likely to go ahead and provide and pay for it while the others who are able to observe this will then abstain from provision.
Assuming that the person with the highest need for punishment will propose the highest amount, our design of the indi-rule reflects both the selection mechanism and the consequences for those with lower needs for provision in a volunteer’s timing dilemma.
indi vs. coll. variable coefficient std. error significance
constant -3.050 17.114 .860
∅ contrib. -.231 .868 .792
adj. R2: ∅ std.dev. 5.656 1.908 .006
.423 dummy 14.822 5.557 .013
Table 4: Linear regression of the averaged total amount of punishment proposals on a constant, contri- butions’ mean and standard deviation, and a dummy indicating whether an observation belongs to the indi- or the collective rules.
our hypothesis confirmed by the estimation: punishment activity is weaker under the indi-rule, as the highly significant dummy indicates.
4.1.2 Enforcement of punishment proposals
Concerning the rules, the punishment which was enforced depending on the proposals is straightfor- ward. In both the maxi and the indi-rule, the most severe proposal is enforced, in the medi-rule the median proposal, and in the mini-rule the least severe proposal is put into action. Given all other things equal, carried-out punishments in the four rules should be related in the following way: indi/
maxiÂmediÂmini. However, the rules concerning the enforcement of punishment differ only if there are three different proposals with respect to one person. Moreover, the size of these relations crucially depends on the characteristics (spread, skewness) of the distribution of the three proposals within a triplet.
From our data, we calculated descriptive measures for this distribution. Taking into account all triplets in which at least one proposal was greater than zero we found that the average distance between the maximum and the median proposal was 5.80 while the average distance between the median and the minimum proposal was 1.77. Furthermore we calculated an average ratio of the min-med-span to the (whole) max-min-span over all triplets of a 4-person group. The ratios have a mean of 0.251 and a standard deviation of 0.125. There was no group with an average ratio greater than 0.5. Thus, appart from the variation within the triplets we find that the distribution is highly skewed. The medium proposal is much closer to the minimum than to the maximum proposal.
variable coefficient std. error significance
all periods constant 1.200 1.618 .465
∅contrib. .023 .078 .768
∅std.dev. .564 .166 .002
indi-dummy -1.555 .602 .016
adj. R2: medi-dummy -1.996 .621 .003
.491 mini-dummy -3.237 .644 .000
Table 5: Linear Regression of averaged carried-out punishment on a constant, the averaged contributions’
mean and standard deviation, and dummies.
4.1.3 Carried-out punishment
The occurrence of punishment is essentially influenced by the number and extent, as well as the enforce- ment of punishment proposals. Following hypothesis 2 the indi-rule generates less punishment activity than the collective rules. Since, under the aspect of enforcement, the indi-rule is equivalent to the maxi-rule, we expect:
Hypothesis 3 In the maxi-rule punishment occurs more extensively than in the indi-rule.
Following our reasoning on enforcement, and since we have no reason to expect different punishment behaviour across the collective rules, we expect:
Hypothesis 4 Concerning the extent of punishment carried out, the following relation holds: maxi  medi mini.
In a linear regression we explained the carried-out punishment averaged over ten periods. We introduced dummy variables for three of the four rules (indi, medi, and mini), and controlled for the contribution’s mean and standard deviation, as well averaged over ten periods. The intercept reflects the influence of the maxi-rule, and the dummies reflect the additional influences of either rule relative to the maxi-rule.
The results are reported in Table 5. The values of the dummies support the relations we proposed:
maxiÂindi, and maxiÂmedi Âmini. In order to check for the statistical significance of the proposed relations, we performed restricted regressions and applied F-tests for each relevant pair of rules. All relations are supported by the F-tests (see Table 6).
For further considerations, we will refer to a rule that is superior to another rule in terms of the carried-out punishment as the more severe rule.
restriction / H0: SSR unrestr. SSR restr. F-stat. significance
indi = maxi 35.163 44.198 6.68 .016
maxi = medi 35.163 49.150 10.34 .003
medi = mini 35.163 41.193 4.46 .044
maxi = mini 35.163 69.298 25.24 .000
Table 6: In a restricted regression we assigned dummies to the remaining rules only, thereby forcing the two rules which are to be tested to assume the same intercept.
4.2 Contribution and punishment
In a public good game without punishment opportunities, an important determinant of a participant’s contribution decision is the past contributions of the group’s remaining participants, and her expectation about their future contributions. This is in line not only with Yamagishi’s approach (Yamagishi 1986), but has recently been supported also experimentally by Fischbacher, Gächter and Fehr (2001). With the additional introduction of punishment opportunities occurrence or absence of punishment, as well as prior expectations about this, influence the decision on whether or not to contribute to the public good.
It is intuitively appealing that relatively small contributions are perceived as unfair, whereas higher contributions are seen as fair. In this context, Fehr and Gächter (2000) found that mainly negative deviations from average contribution levels were punished.10 Consequently we expect to find similar behaviour in our experiment.
Hypothesis 5 Lower contributions (relative to the group average) receive heavier punishment proposals than higher contributions.
The correlation between a person’s deviation from the average group contribution and the amount of punishment proposals she received in the same period was calculated as -.580 from all available data, supporting the assumption. The relation is stable across all rules. However, this number is calculated from the total of 1280 observations that are partly dependent. In order to check for statistical significance we calculated a correlation coefficient for each group and applied a t-test on the 3111resulting
1 0They also found that some low contributers engaged in punishment against high contributers but the extent was small though.
1 1In one out of 32 groups no punishment proposal occurred in thefirst ten-period treatment making it impossible to calculate a correlation coefficient.
independent measures. The correlation coefficients have a mean of -.660 with an estimated standard deviation of .037. Based on a sample of size 31 one can reject the hypothesis of a non-negative correlation at any reasonable significance level.
In a similar way we consider one’s own contribution as a major determinant of how fair or unfair one regards another persons contribution, i.e. a person with a very high contribution may feel a stronger need to educate a free rider than a person with an average or even lower contribution.
Hypothesis 6 Participants with above average contributions propose heavier punishment than others.
As with hypothesis 5, we calculated the correlation between a person’s deviation from the group average and the total amount of punishment she proposed. The Pearson correlation coefficient is .257 if all observations are included. If one separates indi from collective treatments, the coefficients are .256 and .271, respectively, indicating a stable relationship. The 31 correlation coefficients for each single group have a mean of .278, with an estimated standard deviation of .050. Again, we can reject the hypothesis of a non-positive correlation by a t-test at any reasonable significance level, strongly supporting the hypothesis.
4.3 Contribution
Having an idea of who punishes whom we turn to the effects which punishment causes. A person’s natural reaction to a received punishment should be to change her behaviour. Following hypothesis 5 this means above all that she will raise her contribution.12 All other contributions unchanged, this would lead to a higher cooperation level in the group. Keeping one’s own contribution constant in an environment of rising cooperation, however, also means facing a higher risk of being punished. Therefore, the observation of someone else suffering a punishment, and the expectation of higher contributions by the punished person may induce other group members to raise their contributions as well as a second order effect.
1 2Hypothesis 5 contains a link between a person’s contribution and the punishment proposals she receives, while for a change in a person’s behaviour actual punishment was needed. However, more or higher punishment proposals generally lead to higher (at least not smaller) carried-out punishment within any rule.
contribution mean prds. 1 to 10 minimum maximum range level (prds. 6 to 10) prds. 1 to 10 prds. 1 to 10 prds. 1 to 10
indi 14.65 (15.04) 10.98 20.00 9.02
maxi 16.94 (18.31) 14.13 19.13 5.00
medi 13.73 (14.19) 10.43 17.75 7.32
mini 13.06 (12.74) 6.58 20.00 13.42
Table 7: Descriptive measures on contribution levels under different rules. The former columns refer to averages from all ten periods of a treatment. Therefore, the minimum/maximum contribution levels present the smallest/highest averaged contribution levels observed under a certain rule. There may be, of course, even smaller/greater contribution levels in single periods.
The fear of being punished is not the only motive to raise one’s contribution. As explained above, people are willing to contribute more in expectation of higher cooperation by other group members, even in the absence of punishment opportunities. The credible threat of a punishment should be sufficient to trigger the same dynamics. Accordingly, we expect lower cooperation levels, if punishment fails to be credible.
From the results of hypotheses 3 and 4 we saw that the occurence (and thus the credibility) of punishment varies within the rules. Therefore, contribution should also be different according to the following
Hypothesis 7 Concerning the performance of contributions, the following relation holds: maxiÂindi, and maxi Âmedi Âmini.
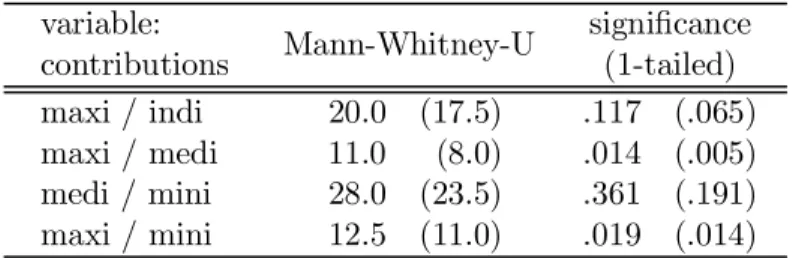
Table 7 shows that the contribution levels averaged over all participants and periods under a certain rule relate as proposed though there are large dispersions within each group. The relations become clearer when only contributions of the last five periods of a treatment are averaged. The results of pairwise comparisons using a Mann-Whitney-U test are reported in Table 8. The relations between maxi and medi as well as maxi and mini are significant at the 5% level. If a 10% level of significance is adopted one might also reject that maxi and indi generate equal contribution behaviour in the lastfive periods.
As indicated above, the distribution of the three proposals within a triplet is strongly skewed, i.e. the median proposal lies much closer to the minimum proposal than to the maximum one. Consequently, the
variable:
contributions Mann-Whitney-U significance (1-tailed) maxi / indi 20.0 (17.5) .117 (.065) maxi / medi 11.0 (8.0) .014 (.005) medi / mini 28.0 (23.5) .361 (.191) maxi / mini 12.5 (11.0) .019 (.014)
Table 8: Test statistics and significance levels for the Mann-Whitney test on all relevant pairs of rules.
Numbers in parentheses are the respective values using the averages of the lastfive periods.
punishment amount resulting from a typical triplet would rise only modestly if the medi-rule instead of the mini-rule was applied but substantially if the maxi rule was applied instead of the medi- or mini-rule.
Finally, it is worth mentioning that applying the same test to initial contribution levels under the different rules did not lead to any significant difference. As noted before, this shows that people’s anticipation about the rule was limited.
4.4 Efficiency
On one hand punishment raises contribution on the other hand it reduces income. Obviously the question arises which of the rules performs best in terms of efficiency.13 Does the benefit from more cooperation outweigh the costs of the punishment needed to establish that additional cooperation? We abstain from generating a hypothesis to this question since it requires quantitative assumptions on the effects of punishment which are difficult to make.
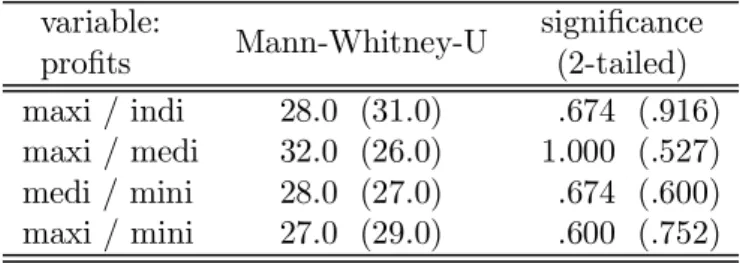
Interestingly enough, the relations between the rules in terms of efficiency (maxi ≺ indi, and maxi ≺ medi ≺ mini) are opposite to the relations predicted and found for the occurrence of pun- ishment and for contributions, as Table 9 shows. However, these relations do not withstand a statistical test as Table 10 reports, partly due to the high dispersion in profit levels among the observations from a certain rule. Note in Figure 3 that the relations in terms of efficiency are not stable throughout the course, mostly due to the striking pattern exhibited by the maxi-rule. While the maxi-rule performs best in some intermediate periods it lies far behind in the beginning and in the last period. This pattern can be explained when looking at Figures 1 and 2. Obviously, the heavy use of punishment to establish
1 3By efficiency we understand the group’s total profit after all sanction costs have been covered, e.g. thefinal profit as defined in the Experimental Design section summed over all four members.
profit level mean minimum maximum range
indi 25.65 (27.05) 20.75 32.00 11.25
maxi 24.35 (26.61) 16.68 31.02 14.34
medi 25.54 (25.74) 21.78 28.25 6.47
mini 26.96 (26.84) 23.45 31.28 7.83
Table 9: Descriptive measures on profit levels under different rules.
variable:
profits Mann-Whitney-U significance (2-tailed) maxi / indi 28.0 (31.0) .674 (.916) maxi / medi 32.0 (26.0) 1.000 (.527) medi / mini 28.0 (27.0) .674 (.600) maxi / mini 27.0 (29.0) .600 (.752)
Table 10: Test statistics and significance levels for the Mann-Whitney test on all relevant pairs of rules.
A two-tailed test was performed since no prior assumption on the relation was available.
cooperation was both successful and expensive. In the intermediate periods cooperation stabilized on a high level accompanied by few punishments, allowing the participants to earn generous profits. However, when the end of the treatment approached contribution levels decayed generally. This effect could not be stopped even in the maxi-rule though heavy punishment had to be expected. The immense extent of carried-out, emotional punishment in the last period consequently left the participants with relatively poor profits.
The medi- and mini-rule, in contrast, exhibit a rather stable pattern in terms of efficiency, while the indi-rule’s evolution resembles the maxi-rule in the beginning but not in the last period.
4.5 Justice
Beside efficiency people turn their attention to justice if they judge allocations or have to choose between different alternatives.14 In our view, the highest degree of justice would be reached if the most generous contributors earned the highest profits. Additionally, we would also regard a situation without any dispersion in both contributions and profits as just.15
1 4One may reason that justice is of importance for a long-term stabilization of cooperation. Given repeated free-rider attacks occurred, repeated punishment would be needed to stabilize cooperation. If, though, a rule generates permanently and strongly unjust results after punishment, the willingness to punish and to cooperate may decay.
1 5Alternatively, one could simply regard the variance in profits within a group as a measure of justice, i.e. low variance means higher justice than high variance. This definition rests on the fact that in each period every group member starts with the same endowment.
In a linear public good game without punishment opportunities, different profits can only be at- tributed to different privately kept amounts. Therefore, the correlation between profits and contri- butions is perfectly negative. Moreover, the variance in contributions translates completely into the variance of profits. According to our definition, this is a very unjust situation.
We recognize three channels through which punishment is able to improve justice:
1. Through weakening or even reversing the negative correlation between contributions and profits, and, given a negative correlation rate,
2. by reducing variance in profits related to variance in contributions, 3. by reducing variation in contributions themselves.
Let’sfirst turn to channel one and two, which can be considered the direct influences of punishment.
Since, following Hypotheses 5 and 6, mainly below average contributions are punished from above average contributers, the relative benefit from free-riding may be reduced or even reversed. This is for the better of justice. The costs of punishment, however, lessen this improvement. While the extent of lessening is straightforward in the collective rules, it is of particular importance, who bears the costs for punishment in the indi-rule. In most cases, participants who already have relatively small preliminary profits after the public good stage, suffer a further deterioration in pay-offs due to punishment costs.
For the collective rules the results of the Hypotheses 3 and 4 suggest that the more severe a rule is the more likely free-riders were punished and thus the greater the improvements in justice will be.
We come to the same conclusion when turning to channel 3, the indirect effect of punishment. The more severe a rule is, the less deviations from a social norm (e.g. the average contribution) are tolerated.
And, the less tolerant a rule is, the more it is able to generate homogeneity in contributions.
Taking all three channels into account we arrive at the following proposition:
Hypothesis 8 In terms of justice, the following relations hold: maxi Âindi and maxi medi mini.
variable: β Mann-Whitney-U significance (1-tailed)
maxi / indi 5.0 .003
maxi / medi 19.0 .098
medi / mini 23.0 .191
maxi / mini 8.0 .005
Table 11: Pairwise Mann-Whitney tests on the variableβ.
In order to keep our analysis simple we designed a measure β that captures the first two channels in one number:16
β =Corr(prof, contr)∗ stddev(prof)
stddev(contr) = Cov(prof, contr) V ar(prof)
A weakening of the correlation between contributions and profits as well as a reduction of the variance in profits given a negative correlation improve the measure. Furthermore, a rise in the variance of profits improves the measure only if the correlation is positive. This is compatible with our view of justice. Note that for a public good without punishment, this measure would take on the value−1 for mathematical reasons unless no variance in contributions existed.17
From contributions and profits averaged over ten periods we calculatedβ’s for each group. The mean β’s in the different rules relate as predicted: maxi (∅-.32) >indi (∅-1.09), and maxi> medi (∅-.73) >
mini (∅-.88) We tested the relations between the rules using the Mann-Whitney test (see Table 11).
Two of the relations are highly significant.
Turning to the third channel or the indirect effects of punishment, we checked whether the rules enforce different degrees of homogeneity on contribution behaviour. For this purpose we used standard deviations of contributions within a group and averaged them over ten periods. The relations resulting from the described measures are as predicted: maxi (∅2.33)< indi (∅2.81), and maxi < medi (∅3.24)
< mini (∅3.85). In order to verify our results we again employed the Mann-Whitney test and report
our findings in Table 12. The results are less convincing, as a significant difference concerning the
homogeneity of contributions can be only detected in the comparison of maxi- and mini-rule.18
1 6This measure is an imitation of theβ known as a stock characteristic in capital markets.
1 7The measure is disputable in particular if the component of the correlation between profits and contribution is positive.
However, since other possible measures like the variance in profits or the correlation component only also have downsides, and since only one of the 31 groups show a positive measure, we neglect this problem.
1 8The results of Section 4.5 do not change substantially if the variance in profits only is taken as justice measure instead (compare Footnote 15). However, only the maxi-mini relation is significant then.
variable:
stddev(contr.) Mann-Whitney-U significance (1-tailed)
maxi / indi 26.0 .287
maxi / medi 24.0 .221
medi / mini 22.0 .164
maxi / mini 13.0 .025
Table 12: Pairwise Mann-Whitney tests on contributions’ standard deviations averaged over ten periods.
alternatives number of
persons votes for coll. rule votes for indi-rule
maxi / indi 32 16 (50.0%) 16 (50.0%)
indi / medi 32 22 (68.8%) 10 (31.2%)
medi / indi 32 20 (62.5%) 12 (37.5%)
mini / indi 32 22 (68.8%) 10 (31.2%)
Table 13: People’s decisions on the rule to be applied in the last five-period treatment.
4.6 Institutional Choice
In previous subsections we compared collective rules in terms of normative criteria, e.g. efficiency and justice. Now we turn to the question whether and to what extent people are willing to support a collective rule when their alternative is the individual rule.
Before we turn to identify the determinants of the decisions made by the participants we present some aggregate results. As Table 13 shows, the general approval of the collective rule is highest if the mini-rule is lined up against the indi-rule, and lowest if the maxi-rule is the alternative.19
The bids submitted by the participants to support their votes average ECU 14.18, which is nearly 25% of the amount they received for this purpose. The most prominent bids were ECU 0, 1, 10 and 20, the maximal amount of ECU 60 occurred four times.
With respect to the decision determinants we expect individuals to weigh their costs and benefits.
One variable which is easily observable and comparable is personal profit. We expect:
Hypothesis 9 Differences in personal profits are of importance; a person will tend to choose the rule under which she can expect higher profits.
1 9The order in which the rules are applied does not seem to influence the rate of approval as the comparison between indi/medi and medi/indi- treatment shows ( two-sample test for equality of proportions with continuity correction, p=.792).
Besides profits we consider personal freedom essential to a person’s evaluation of punishment rules.
Any collective rule constitutes a restriction to an individual’s freedom of action which can be regarded as a cost in a non-pecuniary sense. The restriction occurs in two possible ways:
1. A participant has to bear the costs for a carried-out punishment (one third of the amount) even if she proposed a lower punishment or no punishment at all.
2. A participant has to be satisfied with lower carried-out punishment though she proposed a higher amount.
Crucial to the restriction of a person’s freedom by a rule is the degree of consent required by the rule.
The mini-rule requires the agreement of all three proposers tofix the punishment amount. Consequently, in the mini-rule thefirst kind of restriction can be ignored, while the second kind may occur frequently.
On the other hand, in the maxi-rule the most severe person decides on the punishment amount. Thus, the second kind of restriction is negligible, whereas the first kind may play an important role. The medi-rule lies between the two extremes.
Hypothesis 10 Both kinds of restriction will weaken peoples approval to the collective rule.
If the choice is between indi and maxi, a person who is very keen to punish others will prefer the maxi-rule as this rule would enable her to put through a high level of punishment while she can share the costs with the remaining subjects. On the other hand, a person who wishes few or no punishment and is not willing to share costs will prefer the indi-rule. A similar reasoning applies when people are up to choose between the mini-rule and the indi-rule. A person very willing to punish may feel too restrained under this collective rule and vote for the indi-rule.
There are some other possible influences on a person’s attitude towards a rule, for example the extent to which a person was target of past punishments, the extent of unduly punishments to one person, and the degree of justice of a rule. However, we consider them of playing a minor role since the first is at least partially included in the profits and the second does rarely happen.20 Justice is difficult to
2 0Fehr and Gächter (2000) observed that behaviour in their experiments. They report that punishment from participants with relatively low contributions against those contributing relatively much occurred to a non-negligible but small extent.
observe for the participants because they had to keep track with all the payments of the other subjects (the accumulated payoffs are only reported to the persons themselves).
According to the distinction concerning the restriction to a person’s freedom, we calculated two measures:21
1. drag-in: the absolute value of the total extent of negative differences between a person’s proposed and the actual punishment carried-out averaged over ten/five periods.
2. curb: the total extent of positive differences between a person’s proposed and the actual punish- ment carried-out averaged over ten/five periods.
In order to measure the degree of approval for a particular collective rule we assigned a sign to each bid, depending on whether the amount was dedicated to support a vote for the indi-rule (−) or a collective rule (+). A bid for the indi-rule, therefore, is translated into a negative number indicating aversion to the collective rule.
On these measures we performed a linear regression in order to estimate the influence of drag-in, curb and profit differences on the approval of a rule. We use aggregated measures in order to base the estimation on independent observations. As the dependent variable we calculated the total approval for the collective rule in a group as the sum of the adjusted bids over the four members of the group, i.e. bids for the collective rule were added and bids for the indi-rule were subtracted. As independend variables we used the averaged profit differences, and summed up the variables “curb” and “drag-in”
over four group members. The results confirm our hypotheses (see Table 14).
Profit differences as well as “drag-in” contribute most strongly to the explanation of participants’
approval for the collective rule, but also curb has an influence. Given our prior assumptions on the sign of these influences a 1-tailed test is appropriate. Based on this the variables are significant at the 5%
level and the 10% level, respectively.
2 1The measures were, of course, calculated from thefirst phase. For groups starting with the indi-rule the second phase was accounted.
variable:
total adj. bid variable coefficient std. error significance (1-tailed)
constant 30.893 13.043 .013
profit diff. 2.982 1.551 .033
adj. R2: curb -.723 .518 .087
.182 drag-in -1.499 .860 .046
Table 14: Linear regressions of the total approval of the collective rule in a group on profit difference, restrictions to personal freedom.
5 Conclusion
Like Elinor Ostrom we are aware that: ”[...]whether or not an equilibrium would be an improvement for the individuals involved (or for others who are in turn affected by these individuals) will depend on the particular structures of the institutions. [...] Further, the particular structure of the physical environment involved also will have a mayor impact on the structure of the game and its results. Thus, a set of rules used in one physical environment may have vastly different consequences if used in a different physical environment” (Ostrom 1990, p.22)
We consider our experimental design as one of many possible structures to be found in practice.
Changing certain characteristics of the design, e.g. the number of players, the number of periods, the cost or information structure, or the degree of anonymity in the voting process, may lead to changes of particular results. Therefore, we cannot generalize each particular finding, but we want to make some general remarks about the insights we gained from our investigation that we consider important when implementing collective punishment rules in public good settings.
Our experiments were designed so as to learn about people’s behaviour under different punishment rules and to answer several questions. First we asked:
Are collective punishment rules able to bring about stronger cooperation and /or higher profits in a public good setting than an individual rule, and to what extent do different collective rules perform differently from each other?
As we have seen in our experiment the mere existence of punishment opportunities brings about stronger and more sustainable cooperation, regardless of the punishment rule applied in the public good setting.
Punishment rules differ only marginally from each other. This marginal differences stem from dif- ferences in the occurrence of punishment proposals and their enforcement. Collective rules generally induce heavier punishment activity, but can be distinguished from each other by their degree of the enforcement of punishment proposals.
Supposing that a higher probability of being punished leads to higher contribution, it is no surprise that the maxi-rule performs best in terms of contribution. But when comparing punishment rules it is not enough to consider contribution behaviour only. One has to take punishment costs into account as well. In our setting relations in terms of contributions reversed completely when efficiency was considered. This finding and our investigation into this point suggest several remarks:
Remark 1 More punishment, though it is able to enforce more cooperation, does not necessarily gen- erate higher profits.
Our data verify that emotional punishment exists and that it has a major impact on efficiency. In the maxi-rule, though it performed best in terms of contribution, emotional punishment was not sufficiently suppressed and consequently damaged the gains from cooperation. We conclude:
Remark 2 When designing punishment rules, the ability to suppress exaggerated emotional punishment is at least as important as providing a sufficient punishment threat.
Turning to justice, we argued that the extent to which a rule is able to generate and enforce punish- ment is responsible for the improvement of justice provided that contributions below average are heavier punished than that above. This argument was confirmed by our empiricalfindings, where the maxi-rule turned out to be superior to all other rules.
Altogether, considering efficiency and justice, collective rules do not perform worse than the individ- ual rule. Moreover, depending on their design, they are, in different aspects, able to surpass individual punishment. The question remains:
Will participants agree to submit themselves to a collective rule, even if this means to give up some individual freedom?
Since in practice the possibility of individual punishment usually exists, we consider it the initial rule. Therefore, implementation of a collective rule implies a change of the status quo and requires support by the participants. We investigated influences on participants’ agreement to or rejection of collective rules and conclude:
Remark 3 As far as collective rules allow for higher profits, people support them. On the other hand, restrictions to the personal freedom weaken the support for collective rules or even cause support for the individual rule.
Mainly participants who had to bear the costs of a carried-out punishment higher than the one they have proposed are likely to oppose the collective rule. Thisfinding suggests that the higher the required degree of consent by the collective rule the more likely it is to be supported by the participants. This may explain the high popularity of unanimity voting and veto rights in institutions of the UNO as well as the EU. The other kind of restriction - that participants have to accept a certain punishment even if they proposed a higher amount - turned out to be less influential.
Finally, we turn to the last question: Is there an optimal punishment rule?
To design an optimal punishment rule one has to solve several trade-offs. The punishment rule has to provide sufficiently high probability of being punished on one hand, but it should be able to suppress exaggerated emotional punishment on the other hand. What extent of punishment is sufficient or exaggerated can be answered only case by case taking into account the very environment and the characteristics of the individuals involved. A particular result of our experiment is that a rule which is severe enough to establish cooperation in one group may fail to provide sufficient punishment in another group. Moreover, a rule providing sufficient but not exaggerated punishment in one group may allow for too excessive punishment in another group. Since both people and groups differ in their initial inclination to cooperate and to punish, and environments are special and unique, we arrive at thefinal remark, that a generally optimal punishment rule does not exist.
References
[1] Andreoni, James and Miller, John. “Giving According to GARP: An Experimental Test of the Consistency of Preferences for Altruism.”Econometrica, 70 (March 2002), 737—53.
[2] Bates, Robert H., “Contra Contractarianism: Some Reflections on the New Institutionalism”, Politics and Society,16 (1988), 169-217.
[3] Bolton, Gary E., and Axel Ockenfels, “ERC - A Theory of Equity, Reciprocity, and Competition”, American Economic Review, 90 (March 2000), 166—193.
[4] Dawes, Robin M., and Richard Thaler, “Cooperation”,Journal of Economic Perspectives,II (1988), 187-197.
[5] Diekmann, Andreas, “Cooperation in an Asymmetric Volunteer’s Dilemma Game - Theory and Experimental Evidence”, International Journal of Game Theory, 22 (1993), 75-85.
[6] Fehr, Ernst, Simon Gächter, and Georg Kirchsteiger, “Reciprocity as a Contract Enforcement Device”, Econometrica,LXV (1996), 833-860.
[7] Fehr, Ernst, and Simon Gächter, “Cooperation and Punishment in Public Goods Experiments ”, American Economic Review, 90, (September 2000), 980-994.
[8] Fehr, Ernst, and Klaus M.Schmidt, “A Theory of Fairness, Competition, and Cooperation”,Quar- terly Journal of Economics, CXIV (1999), 817-868.
[9] Fischbacher, Urs, Simon Gächter, and Ernst Fehr, “Are people conditionally cooperative? Evidence from a public goods experiment”, Economics Letters 71/3 (2001), 397-404
[10] Fischbacher, Urs, “z-Tree. Zurich Toolbox for Readymade Economic Experiments”, University of Zurich (1999). See also http:/www.iew.unizh.ch/ztree (visited: April 8th, 2002).
[11] Güth, Werner, and Reinhard Tietz, “Ultimatum Bargaining Behavior—A Survey and Comparison of Experimental Results”, Journal of Economic Psychology,11 (1990), 417-449.
[12] Ledyard, John O., Public Goods: A Survey of Experimental Research”, In : J. Kagel and A. Roth (eds.): Handbook of Experimental Economics, Princeton: Princeton University Press (1995).
[13] Levine, David K., “Modeling Altruism and Spitefulness in Experiments”, Review of Economic Dynamics, 1 (1998), 593-622.
[14] Oliver, Pamela, “Rewards and Punishments as Selective Incentives for Collective Action: Theoret- ical Investigations”, American Journal of Sociology,85 (1980), 356-375.
[15] Ostrom, Elinor, “Governing the Commens—The Evolution of Institutions for Collective Action”, Cambridge University Press (1990).
[16] Pruitt, Dean G. and Melvin J. Kimmel, “Twenty years of experimental gamining: Critique, syn- thesis, and suggestions for the future”, American Review of Psychology, 28 (1977), 362-396.
[17] Rabin, Matthew, “Incooperating Fairness into Game Theory and Economics”,American Economic Review, 83 (1993), 1281-1302.