Research Collection
Master Thesis
Moving Towards a Sustainable Swiss Food System: An Estimation of the True Cost of Food in Switzerland and Implications for
Stakeholders
Author(s):
Perotti, Alessa Publication Date:
2020-09
Permanent Link:
https://doi.org/10.3929/ethz-b-000473289
Rights / License:
In Copyright - Non-Commercial Use Permitted
This page was generated automatically upon download from the ETH Zurich Research Collection. For more information please consult the Terms of use.
Moving Towards a Sustainable Swiss Food System:
An Estimation of the True Cost of Food in Switzerland and Implications for Stakeholders
Master Thesis in the Field of Food Science Department of Environmental Systems Science
ETH Zurich
Submitted by: Alessa Perotti
Supervised by: Prof. Dr. Johan Six, Dr. Martijn Sonnevelt
Zurich, September 2020
ABSTRACT
Whilst the benefits of food production and consumption are unarguably large, scientific consensus on the need for food system transformation is increasing. The global food system is one of the main contributors to climate change, biodiversity and ecosystem service loss, human health and animal welfare issues, as well as to insufficient livelihood conditions along the entire food supply chain.
Creating a common, transparent standard for identifying food system impacts, their measurement and cost to society is key for the transformation towards a sustainable and resilient food system.
By proposing a concrete methodology to calculate the true cost of food and applying it to Switzerland, this thesis aims to contribute to the discussion and highlight its importance.
The methodology defined assesses food system impacts on natural resources, livelihoods, human health, economy and animal welfare. 100 externalities were collected across all of these areas, of which 28 were prioritized based on their relevance and feasibility to be quantified. The true cost of (i) the national Swiss food system and (ii) eight conventionally produced Swiss products (apple, potato, carrot, wheat, milk, cheese, chicken and beef) is then approximated based on the prioritized externalities. This results in (i) national level external costs of 0.87 (0.61 - 1.12) CHF per CHF spent.
Total national level costs amount to 70 (60 - 79) billion CHF, i.e. the sum of 37 billion CHF of national food expenditure and 33 (23-42) billion CHF of external costs. The latter are driven by human health, (14.8 billion CHF) and biodiversity (10.4 billion CHF) costs, with livelihood costs underestimated due to limited data availability. On a product level (ii), based only on environment, biodiversity and human health costs, cheese, chicken, and beef cause the highest external costs: 0.20 CHF (53%
higher than retail price), 0.49 CHF (+38%) and 2.14 CHF (+125%) per 100 kcal, respectively.
The results illustrate the urgency of Swiss food system transformation. This is evident despite an underestimation of true costs by focusing on only 28 externalities, limited data availability and data accessibility. Swiss food system stakeholders are called to design a food system where sustainable choices are facilitated and incentivized along the entire supply chain. Based on both a transparent standard for measuring food system impacts and focusing on increasing consumer awareness, two things in particular should be strived for. First, reducing external costs of the current food system, e.g. by reducing food waste. Second – more crucially –, reducing external costs by shifting current production and consumption patterns. This includes redirecting agricultural support from products with high external costs, such as intensively farmed beef, to products with low external costs.
In 2021, the United Nations will host a Food Systems Summit targeting food system transformation.
Switzerland could play a key role in this transformation by co-creating an improved methodology for measuring food system impacts with all relevant stakeholders. Food system transformation, based on measurable and transparent targets, both in terms of food system costs and benefits, represents an unmissable opportunity for achieving sustainable development, and now is the time to take it.
ACKNOWLEDGEMENTS
The following people deserve a special mentioning for their support throughout this thesis:
Prof. Dr. Johan Six, for making this thesis possible.
Dr. Martijn Sonnevelt, for all the fruitful discussions, helpful inputs and great guidance. Thank you for being interested when I approached you about this thesis.
Dr. Claudio Beretta, for readily providing me with data from his doctoral thesis.
Daniel Thuerig, Anna Gilgen, Camilla Perotti, Sofia Perotti, Rebecca Ward and Sian McDonald, for their valuable comments and error-detecting skills when mine stopped working.
Many experts have given their time to answer my questions. Amongst others, these include Daniel Langmeier (Biovision), Adrian Mueller (FiBL), Michelle Grant (ETH Zurich), Joe Robertson (Food System Economics Commission), Pietro Galgani (True Price), Thomas Nemecek (Agroscope), Harry Wilting (PBL Netherlands Environmental Assessment Agency), Christie Walker (ETH Zurich), Felix Schlaepfer (Kalaidos University of Applied Sciences), Andreas Peter (Water Supply Zurich), Lukas Fesenfeld (ETH Zurich), Fabienne Vukotic (Nutrition Forum Zurich), Peter Braun (ETH Zurich), Esther Grossenbacher (FOAG), and Wolfgang Langhans (ETH Zurich).
Thank you.
I sincerely hope this thesis will contribute to (Swiss) food system transformation and look forward to continuing my work on this topic.
TABLE OF CONTENTS
1 Introduction ... 1
1.1 The state of the planet ... 1
1.2 The role of food... 2
1.3 The situation in Switzerland... 4
1.4 Food system transformation ... 5
1.4.1 The role of food prices... 5
1.4.2 Creating true cost transparency ... 6
2 Methodology ... 8
2.1 Impact area definition ... 8
2.2 Externality collection ... 9
2.3 Externality prioritization ... 15
2.4 Data sources ... 16
2.5 Monetization ... 17
2.6 National level quantification ... 19
2.6.1 Example calculation: Env1 ... 21
2.7 Product level quantification ... 22
2.7.1 Example calculation: Env1 ... 25
3 Results ... 27
3.1 National level true costs ... 27
3.2 Product level true costs ... 29
4 Discussion ... 32
4.1 Methodology ... 32
4.2 National level results ... 33
4.3 Product level results ... 34
4.4 Implications ... 34
4.4.1 Seizing the moment... 37
5 Conclusion... 38
6 References ... 39
7 Appendix ... 49 Supplementary information ... A1 Declaration of originality ... A22 Initial project proposition ... A23
LIST OF FIGURES
Figure 1: The food system impact framework ... 9
Figure 2: Direct expenditure vs. true cost of the Swiss food system in 2018 ... 27
Figure 3: True cost per kg of selected food products ... 29
Figure 4: True cost per 100 kcal of selected food products ... 30
LIST OF TABLES
Table 1: Methodology overview including relevant steps ... 8Table 2: Main impact areas of the food system ... 9
Table 3: Overview of globally relevant food-system externalities including the respective source 10 Table 4: Overview of prioritized food system externalities ... 15
Table 5: Data availability for system and product level quantification ... 17
Table 6: Unit-specific monetization factors ... 18
Table 7: Main data sources and exhaustiveness of data used at system level ... 20
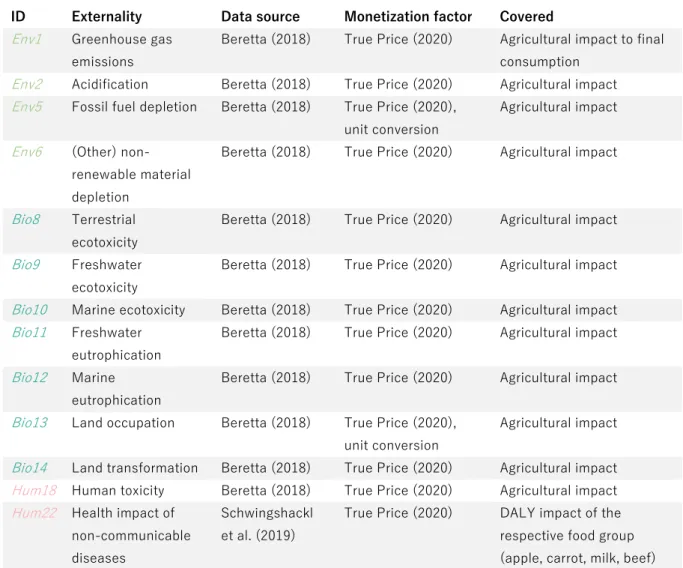
Table 8: Main data sources and exhaustiveness of data used at product level ... 23
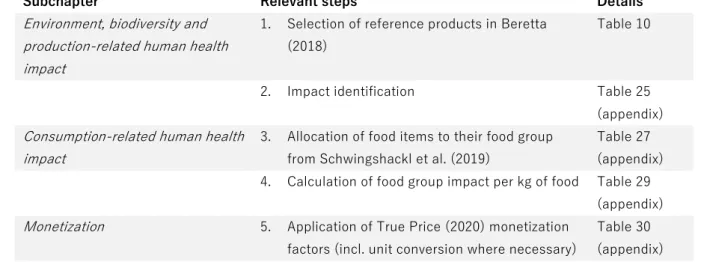
Table 9: Methodology used for product level quantification including reference table ... 24
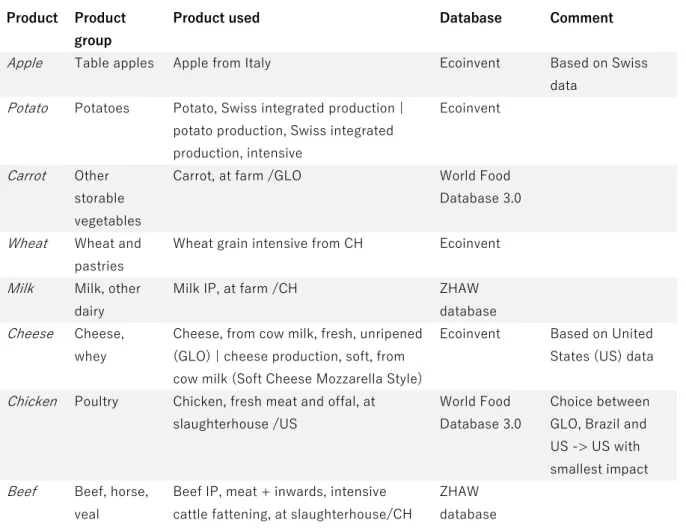
Table 10: Reference products for environment, biodiversity and production-related externalities 25 Table 11: True cost calculation based on greenhouse gas emissions ... 26
Table 12: National level cost for all quantifiable externalities ... 28
Table 13: Externalities not quantified on a Swiss food system level ... 28
Table 14: Cost (in CHF) per 100 kcal of product ... 30
Table 15: Externalities not quantified on a product level... 31
Table 16: Recommendations for Swiss food system transformation ... 35 Table 17: Types of capital generally considered in TCA approaches ... A1 Table 18: Cost types considered in monetization factors ... A1 Table 19: Share of biodiversity loss due to food consumption in European countries ... A5 Table 20: Weekly time consumption of farm-related activities for women ... A6 Table 21: Direct and indirect costs of major non-communicable diseases in Switzerland ... A8 Table 22: Support for market structure, sales, animal welfare and the environment ... A10 Table 23: Support for research, development and administration ... A12 Table 24: Impact areas included in the external cost estimation of locally produced food ... A13 Table 25: Share of national level costs attributable to food waste and animal-based products . A14 Table 26: Impact per product for all quantified externalities ... A15 Table 27: Greenhouse gas emissions at consumption level (ENV1) ... A15 Table 28: Allocation of food items to their respective food group ... A16 Table 29: DALYs connected to under- or overconsumption of food groups ... A17
Table 30: Definition of cost/savings per additionally consumed kg of food group ... A17 Table 31: External costs for each externality, per kg of food product ... A18 Table 32: Selection of reference product for average retail price definition ... A18 Table 33: Definition of average chicken price ... A19 Table 34: Definition of average beef price ... A19 Table 35: Selection of reference product for kg to kcal conversion ... A20
GLOSSARY
1,4-DB 1,4-dichlorobenzene
ALYs Animal life years suffered
ARE Federal Office for Spatial Development
CH Switzerland
CHF Swiss franc
CO2 Carbon dioxide
COVID-19 Coronavirus
Cu Copper
DALY Disability-adjusted Life Year EFSA European Food Safety Authority
EMF Ellen MacArthur Foundation
-eq equivalent
FAO Food and Agriculture Organization FOAG Federal Office for Agriculture FOEN Federal Office for the Environment FoodSIVI Food System Impact Valuation Initiative FOPH Federal Office of Public Health
FSO Federal Statistical Office
FSVO Federal Food Safety and Veterinary Office
FTE Full-time equivalent
GAFF Global Alliance for the Future of Food
GBD Global Burden of Disease
GBP Pound sterling
GHG Greenhouse gas
GLO Global production
Gt Gigaton
ha Hectare
H&S Health and safety
ID Identifier
IFAD International Fund for Agricultural Development
IPBES Intergovernmental Science-Policy Platform on Biodiversity and Ecosystem Services
Kg Kilogram
LCA Life Cycle Assessment
m2 Square meter
m3 Cubic meter
MJ Megajoule
MF Monetization factor
MSA Mean species abundance
N Nitrogen
NH3 Ammonia
NMVOC Non-methane volatile organic compound
n/a Not available
OECD Organization for Economic Co-operation and Development
OHCR Office of the United Nations High Commissioner for Human Rights
P Phosphorus
PAF Population attributable factor
PEP Proof of Ecological Performance
PM2.5 Particulate matter ≤ 2.5 micrometers diameter PM10 Particulate matter ≤ 10 micrometers diameter
SBLV Swiss female farmers and women in agriculture association
SDGs Sustainable Development Goals
SO2 Sulfur dioxide
SOC Soil organic carbon
TCA True cost accounting
TEEB AgriFood The Economics of Ecosystems and Biodiversity for Agriculture and Food TMREL Theoretical minimum risk exposure Level
UN United Nations
UNEP United Nations Environment Program
UNFCCC United Nations Framework Convention on Climate Change UNICEF United Nations International Children’s Emergency Fund
US United States
USD United States Dollar
WBCSD World Business Council for Sustainable Development
WEF World Economic Forum
WFP World Food Programme
WHO World Health Organization
WWF World Wildlife Fund
Yr Year
ZHAW Zurich School of Applied Sciences
1 INTRODUCTION
The following chapter highlights how creating transparency on food system impacts and their costs to society is key to achieving sustainable development. It examines the current state of the planet, the role of food systems in the context of global sustainable development and the costs caused by current consumption patterns. It then gives a brief input on the situation in Switzerland, making a case for Swiss food system transformation. True cost accounting – the practice of analyzing and accounting for all costs and benefits related to food production systems and the consumption of their products – will be introduced as a crucial methodology to understand current cost drivers and build the basis for an informed transformation towards a sustainable (Swiss) food system.
1.1. THE STATE OF THE PLANET
Planet Earth is facing unprecedented environmental, human health and socioeconomic challenges.
According to the United Nations Environment Programme (UNEP) (2019), global greenhouse gas (GHG) emissions reached a record high of 55.3 Gt CO2-eq in 2018. It elaborates that meeting the 2015 Paris Agreements and hence limiting global warming to 1.5 degrees Celsius above pre- industrial levels requires a 55% reduction of global GHG emissions by 2030. Regardless, under the environmental policies currently in place, the programme expects emissions to reach 60 Gt CO2-eq by the end of the decade, prompting over 11’000 scientists to declare a climate emergency in January 2020 (Ripple, Wolf, Newsome, Barnard, & Moomaw, 2019). Biodiversity is declining rapidly and the Intergovernmental Science-Policy Platform on Biodiversity and Ecosystem Services (IPBES) (2019) warns that current global rates of species extinction are exceeding the average rate over the last 10 million years by factor of 10 to 100. In terms of human health challenges, non-communicable diseases (NCDs) – for which unhealthy diets are a key risk factor – caused 71% of global deaths in 2016 (FAO, IFAD, UNICEF, WFP, & WHO, 2020). Since 2014, after steadily declining over the previous years, the number of people suffering from undernourishment has been rising, reaching 9% of the population in 2019. This results in a total of 25% of the global population being classified as food insecure, having only irregular access to sufficient, nutritious food (FAO et al., 2020). The current coronavirus (COVID-19) pandemic is further challenging socioeconomic development. With millions of people slipping back into poverty, the World Bank (2020a) estimates that extreme poverty will affect 9% of the population in 2020, reversing the progress made over the last five years.
The international community’s failure to progress towards sustainable development represents a huge economic risk. The World Economic Forum (WEF) recently identified climate action failure as the most threatening global risk in terms of impact and second-highest risk in terms of likelihood over the next decade (WEF, 2020a). It estimates that a total of 44 trillion USD of global value generation is either moderately or highly dependent on nature and its services. This equals to more than half of the global GDP being vulnerable in regards to climate change, biodiversity loss and ecosystem collapse (WEF, 2020b). The surpassing of system thresholds and dependencies between different industries are expected to lead to non-linear socioeconomic impacts, making even higher societal costs likely (McKinsey Global Institute, 2020). Already today, terrestrial surface productivity has declined by 23% compared to 1970 due to land degradation, resulting in an annual cost of 235
- 577 billion USD (IPBES, 2019). In terms of human health, public health costs related to non- communicable diseases are expected to reach a yearly cost of 1.3 trillion USD (FAO et al., 2020). In low- to middle-income nations, the cost of productivity losses due to malnutrition are estimated to 130 - 850 billion USD per year (Wellesley et al., 2020).
Over 30 years after first discussions about the term global sustainable development in the renowned Brundtland Report and five years after agreeing on 17 Sustainable Development Goals (SDGs) within the 2030 Agenda for Sustainable Development, global communities remain far from achieving it (UN, 2019). It is high time to rethink the way humans live on this planet and initiate a large-scale transformation of the systems responsible for the status quo.
1.2 THE ROLE OF FOOD
“Getting it right on food is not only a prerequisite for achieving the Paris Agreements and deliver on the UN Sustainable Development Goals – it might indeed be our greatest opportunity to improve the lives of people everywhere and help secure our common future on Planet Earth”
– Gunhild Stordalen, Founder and President of the EAT Foundation (EAT Forum, 2019)
The global agriculture and food industry are widely recognized to play a crucial role in reducing the environmental impacts of humankind (Gates, 2018; Poore & Nemecek, 2018; Willett et al., 2019). It is estimated that 26% of anthropogenic GHG emissions are currently emitted by agriculture and food production systems. Furthermore, no other industry consumes as much water, covers as much ice- and desert-free land, or contributes as significantly to biodiversity loss. Agriculture and food production systems are accountable for roughly 32% of global terrestrial acidification and roughly 78% of global eutrophication, both of which bear long-lasting impacts on natural ecosystems and contribute to the reduction of ecological resilience (Poore & Nemecek, 2018). Food production systems are the main drivers of natural land conversion, which is happening at a rate and causing a level of biodiversity loss that has led scientists to define the current period as the sixth mass extinction (Ceballos, Ehrlich, & Raven, 2020). Simultaneously, unhealthy diets are the leading risk factor for deaths worldwide (Afshin et al., 2019). In the context of the current pandemic, unhealthy diets have also been shown to increase the risk for severe COVID-19 outcomes (Burridge, Bradfield, Jaffee, Broadley, & Ray, 2020). Whilst consumption-related health costs are rising, production- related health costs are doing so too. The Ellen MacArthur Foundation (EMF) (2019) estimates that by 2050, five million deaths yearly could be caused by excessive use of pesticides in farming and antibiotics in livestock farming, as well as by poor fertilizer management. Widespread suboptimal production practices lead to air, soil and water pollution, and contribute to the development of antimicrobial resistance; all of which can be severely problematic. In terms of citizens affected by extreme poverty, the majority live in rural areas and work in agriculture (World Bank, 2015). Overall, it appears clear that food production systems play a key role in achieving sustainable development.
A significant part of environmental food system impacts are generated by animal-based products.
According to Poore and Nemecek (2018), 83% of global farmland is used for meat, aquaculture, eggs and dairy production systems. Animal-based products contribute to 56-58% of the food system
emissions, whilst only providing 37% of global protein intake and a mere 18% of global calorie intake.
Poore and Nemecek found that average GHG emissions, eutrophication, acidification and land use impacts of plant-based products are typically surpassed by even the lowest impact animal-based products. Despite there being a large potential to reduce environmental impacts in existing animal production systems, reducing consumption of animal products will thus yield larger environmental benefits. The environmental impact of beef is particularly big. If cattle-related GHG emissions were treated like a country, the land of cattle would be accountable for roughly 10% of global greenhouse gas emissions (FAO, 2013). The argument to reduce the consumption of animal-based foods, particularly beef – where it lies significantly above the recommended intake, and thus also benefits human health – is therefore strong. It is important to note that the above does not suggest to completely eliminate meat consumption, but merely adapt it to the natural limits for its production.
Whilst the environmental impact of agriculture and food production systems is unarguably substantial, it is especially problematic when food products are lost or wasted along the food supply chain. Food waste accounts for 6% of global GHG emissions, making it the third-largest emitter of GHG emissions after China (21%) and the United States (13%), if treated as a country (Ritchie, 2020). It is estimated that one third of all food produced worldwide is lost or wasted along the food supply chain (FAO, 2017). According to the FAO, the economic value of this food amounts to 1 trillion USD every year, resulting in an additional 700 billion USD in environmental costs and 900 billion USD in social costs (FAO, 2014). Overall, global food loss and waste thus results in a loss of 2.6 trillion USD per year, a value roughly four times the size of the Swiss GDP (FSO, 2018).
By 2050 – using a 2013 baseline – the FAO expects that population growth combined with economic development will increase food demand by another 50% (FAO, 2017). Despite enabling consumers to purchase more diverse products, increasing economic development has historically correlated with an increased consumption of animal products and processed foods, as well as higher rates of food waste. This is not only a challenge due to the high environmental impact of animal products and unnecessary impact of food waste, but also because typical high-income diets are associated with higher rates of both adult and child obesity as well as increasing rates of diet-related NCDs (FAO, 2018a). Assuming that the current average share of meat consumption is not reduced, agricultural greenhouse gas emissions are expected to increase by a further 15-20% by 2050 (McKinsey & Company, 2020). According to the Ellen MacArthur Foundation, every dollar spent on food today requires an additional spending of two dollars in health, environmental and economic costs. The foundation estimates that this hidden cost of food amounts to 5.7 trillion USD per year, elaborating that half of this additional cost can be led back to current production practices (EMF, 2019). In an examination of the hidden cost of food in the United Kingdom, the Sustainable Food Trust estimates that every British pound spent on food is associated to roughly another pound of hidden costs (Fitzpatrick et al., 2019). In the previously mentioned report on the cost of food waste, the FAO (2014) estimates the social and environmental cost of global food loss and waste to 1.6 USD per dollar spent. These numbers – which all reports highlight as underestimations – lie in similar orders of magnitude and will increase if food production continues as is. Transforming the food system could hugely contribute to reducing humankind’s environmental impact, whilst simultaneously improving human health and livelihoods worldwide.
Whereas Planet Earth clearly faces global challenges, solutions will require to be adapted to the local environments. This thesis focuses on the situation in Switzerland.
1.3 THE SITUATION IN SWITZERLAND
According to the Federal Office for the Environment (FOEN) (2011), Swiss diets are responsible for 30% of the national environmental footprint. The FOEN also states that biodiversity is unsatisfactory in Switzerland and that roughly a third of species are endangered (FOEN, 2018). In terms of the population’s health, the situation in Switzerland is typical for a highly developed country. Hunger and undernourishment are almost non-existent, whereas unhealthy diets represent a major national issue (Federal Food Safety and Veterinary Office (FSVO), (2017a)). 42% of Swiss adults are classified as overweight, whereof roughly a third are classified obese (FSO, 2020a). Overweight and obesity are one of the key risk factors for NCDs such as cardiovascular diseases, diabetes type 2, and several forms of cancer, and thus present a substantial challenge to the Swiss health care system (FSVO, 2017a). Out of a population of over 8 million citizens, 2.2 million are currently affected by NCDs. NCDs account for 80% of current health care costs (around 80 billion CHF), which are expected to further increase substantially in line with the ageing population (FOPH, 2016). In the first national survey measuring the actual nutritional intake of the Swiss population, conducted in 2014-2015, it was concluded that insufficient amounts of plant-based foods, and excessive amounts of animal-based foods, animal fat, sugar and salt are consumed (FSVO, 2017b). Swiss citizens consume three times the recommended amount of red meat, and four times the recommended amount of animal-based fat, sweet, salty and alcoholic products. In turn, only 3.6 out of 5 recommended portions of fruits and vegetables per day are consumed. The recommended amount of whole grain and pulses are also not met (FSVO, 2017a).
The Swiss government spends roughly 4 billion CHF a year on financial support for agriculture, as visualized in Table 22 in the appendix (based on Avenir Suisse, 2020). 71% of the payments listed in Table 22 either potentially, partially or fully harm biodiversity in Switzerland (Gubler, Ismail, &
Seidl, 2020). Gubler et al. also note that although an estimated 400 million CHF of payments are used to promote biodiversity across all sectors, a large majority of payments promote the opposite.
As also derived from Table 22 in the appendix, an estimated 24% of payments support animal production systems. The system in place – with both harmful and conflicting subsidies – incentivizes the maintenance of an unsustainable Swiss food system. In addition to direct governmental support, Swiss agricultural products and food are subject to strong border protection. Whilst this is intended to primarily benefit producers, the Federal Office for Agriculture (FOAG) (2018) states that border protection is both costly and inefficient, despite enabling stable high domestic prices.
Tackling the way food is produced, consumed and regulated is not only key to reducing the national environmental footprint, but presents a huge opportunity to improve Swiss diets, as well as creating a more equitable, just and food secure society both inside and outside of Switzerland. It also offers a chance to reconsider and redirect governmental support of the system. The Food and Land Use Coalition (FOLU) (2019) estimates the benefits of food system transformation to exceed investment costs by factor of 15. Transformation should therefore be considered an economic imperative.
1.4 FOOD SYSTEM TRANSFORMATION
Healthy diets are at the core of food system transformation (FOLU, 2019). There is growing evidence and consensus on the environmental and health benefit of diets with a reduced share of animal- based foods and instead a stronger focus on plant-based foods. Early 2019, the EAT-Lancet Commission published the planetary health diet, a diet optimizing both human and planetary health.
The commission found that in order to reach such a diet, global consumption of healthy foods such as fruits, vegetables, legumes and nuts is required to double, whereas the consumption of foods considered to be less healthy – such as added sugars, saturated fats and red meat – is required to be cut down to less than half of the current consumption. High-income countries in particular will have to stem most of the reduction of unhealthier foods, as their consumption thereof lies significantly above the healthy amount defined by the Commission, and even significantly above their own national guidelines. The report emphasizes the importance of using multiple strategies for achieving a sustainable and healthy food system. If the global community desires to stay below the defined boundaries, the world food system is required to 1) significantly improve food production practices, 2) halve food loss and waste and 3) achieve the dietary shift towards the planetary health diet (Willett et al., 2019). A food system that incentivizes sustainable production practices and the reduction of food loss and waste, disadvantages unsustainable production practices, and promotes the consumption of foods enabling human and planetary health, is urgently needed. As decisions along the entire food supply chain are driven by food prices, which in turn are influenced by policies, a deeper understanding of their role in the status quo is needed (Gittelsohn, Trude, & Kim, 2017).
1.4.1 THE ROLE OF FOOD PRICES
In highly developed countries such as Switzerland the share of income spent on food has decreased significantly in recent decades. Whilst this has been viewed as a big success and enabled the consumption of more diverse goods, consumers have started paying for cheap food through other channels. Food is paid for directly by consumers in-store, indirectly through taxes and through the payment of external costs (Fitzpatrick et al., 2019). The United Nations environment initiative The Economics of Ecosystems and Biodiversity for Agriculture and Food (TEEB AgriFood) (2018, p. 2) defines external costs or externalities as “third-party costs (or benefits) of bilateral economic transactions whose counterparties have not accounted for these costs (or benefits) when undertaking their transaction”. Throughout this thesis, all costs which are not directly reflected in current food procures will be referred to as externalities.
The major components influencing price determination of products at agricultural stage in Switzerland are agricultural inputs such as seed and plant material, feed, fertilizers and pesticides, as well as energy and maintenance costs (FSO, 2020b). Whilst the cost of all agricultural inputs are reflected in food prices, many additional factors influence prices: labor costs, overhead costs, as well as profit margins. This repeats at every step of the food supply chain until a product reaches consumers. However, as indicated above, food prices do not generally reflect the environmental, social and human health impacts of their products’ production and consumption.
There is growing consensus that current food pricing and agricultural policies are part of the problem (FOLU, 2019). The FAO states that food prices should be “right”, elaborating that both the nutritional value of a food item as well as its production- and consumption-associated costs along the food supply chain should be represented in food prices (FAO, 2018a, p. 30). However, the FAO also stresses that an increase in food prices could negatively affect the ability of the poor to buy food and that options to increase their purchasing power need to be considered. Similarly, the Eat- Lancet Commission states that “food prices should fully reflect the true costs of food”. (Willett et al., 2019, p. 479). The Commission also emphasizes that vulnerable populations need to be protected from a potential increase of food prices. The effects of changing food prices - or alternatives to directly changing food prices - therefore need to be considered.
Food prices and what they do or do not include, as well as the financial support of unsustainable production systems, play a key role in the current food system. For the transformation towards such a sustainable food system, creating a common understanding of all externalities of the food system, their measurement and reduction targets is crucial.
1.4.2 CREATING TRUE COST TRANSPARENCY
True cost accounting (TCA), the practice of defining, quantifying and monetizing (food system) impacts, has seen a rise in international interest over the past few years. Multiple organizations have recently published reports on the need to create true cost transparency in order to enable stakeholders such as producers, consumers, regulators and investors to make better, more sustainable decisions along the entire food supply chain (Food Tank, 2015; GAFF, 2019; TEEB AgriFood, 2018; WBCSD, 2018). However, most of these reports remain on a relatively high level and do not specify which concrete externalities need to be considered – in which unit and with which monetization factor – to calculate a holistic true cost of food. In May 2020, the Food System Impact Valuation Initiative (FoodSIVI) (2020), led by the Oxford University Environmental Change Institute, published the report Valuing the impact of food: Towards practical and comparable monetary valuation of food system impacts. It concludes that an intergovernmental standard on the footprint of food and therefrom derived measurable reduction targets are urgently needed, stating that the scientific knowledge to initiate this process is available. The development of such a standard requires a framework defining which impacts should be included, how they can be measured, as well as a better understanding of where data availability is currently insufficient.
Creating transparency on how much these impacts cost society further allows the prioritization of reduction targets and gives governments an indication of the savings connected to these targets.
Developing true cost transparency is key to food system transformation and is exactly what this thesis aspires to contribute towards.
This thesis aims to provide a comprehensive overview of food system externalities and propose a new methodology to calculate the true cost of food based on these externalities. The next chapter explains the methodology defined for assessing the true cost of food and how it is applied to calculate the true cost of the Swiss food system, national level true costs, and the true cost of eight selected Swiss food products, i.e. product level true costs. Chapter 3 illustrates national and product
level results. All results are visualized in order to provide easily communicable results. The discussion chapter then reviews the methodology defined, the national level true cost results as well as the product level true cost results, highlighting where more data and research are required.
It also gives concrete recommendations for action along the entire food supply chain in Switzerland.
The thesis concludes with summary of the insights and a call for action.
2 METHODOLOGY
This chapter explains the methodology defined to calculate the true cost of food within this thesis.
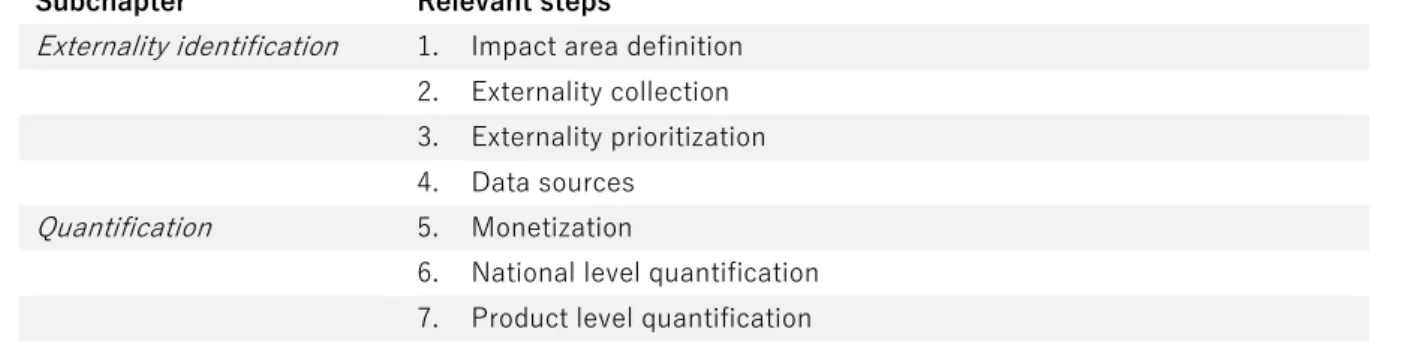
It details how externalities were identified and prioritized, which data sources were used, and how the methodology was applied to calculate the true cost of both the national Swiss food system and of eight different, conventionally produced Swiss food products. Aiming to serve as the basis for a universal true cost calculation, the following methodology can also be applied to other food systems and products with slight adaptions to the local context. Results of the quantification will be presented in the following chapter (Table 1).
Table 1: Methodology overview including relevant steps (explained in following subchapters)
Subchapter Relevant steps
Externality identification 1. Impact area definition 2. Externality collection 3. Externality prioritization 4. Data sources
Quantification 5. Monetization
6. National level quantification 7. Product level quantification
2.1 IMPACT AREA DEFINITION
In a first step, a clear definition of food system impact areas is needed. According to the FAO (2018b, p. 1), a sustainable food system is “a food system that delivers food security and nutrition for all in such a way that the economic, social and environmental bases to generate food security and nutrition for future generations are not compromised”. As such, it should be profitable, benefit society and positively or at least neutrally affect the natural environment. TEEB AgriFood, a UNEP initiative, is widely referred to as the standard for evaluating food system impacts (Aspenson, 2020).
The initiative differentiates between four types of capitals to assess in terms of evaluating food system impacts: natural, human, social and produced capital (TEEB AgriFood, 2018). The capitals are explained in detail in the appendix in Table 17. This thesis builds on these capitals, replacing the terminology used by TEEBAgriFood with food system impact areas, which are assumed to be easier to understand and communicate outside of academia.
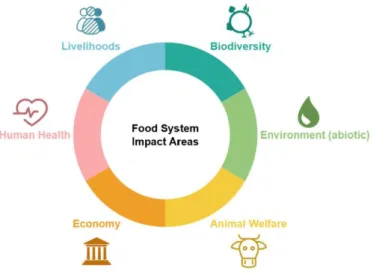
In order to clearly distinguish between the impact on non-living natural resources and the impact on non-human life on Earth, this thesis divides impacts on natural capital into the a) environment (abiotic) and b) biodiversity impact area. Impacts on human and social capital are accounted for in the human health and livelihood impact area, whilst impacts on produced capital are embedded in the economy impact area. This thesis further adds animal welfare as an impact area, as current food production systems often heavily affect animal welfare (Scherer, Tomasik, Rueda, & Pfister, 2018). As illustrated in Table 2, this results in a definition of six main food system impact areas.
Table 2: Main impact areas of the food system
Impact area Definition
Environment (abiotic) Impact on quality and quantity of non-living natural resources Biodiversity Impact on living non-human life and ecosystem services
Livelihoods Impact on the quality of life of all human food system participants Human Health Impact on human health connected to food production or consumption Economy Impact on the local and global economy, including policies
Animal Welfare Impact on the quality and duration of animal lives held for food
2.2 EXTERNALITY COLLECTION
In a second step, each of the defined impact areas were researched in order to understand which concrete measurable food system externalities cause the defined impact areas to be negatively affected. This thesis focuses on negative externalities of the food system, which are at the heart of the current unsustainable food system. Positive externalities, such as carbon sequestration, should also be considered in the creation of a sustainable food system but are beyond the scope of this thesis. The framework presented in Figure 1 can however also be used as a basis for understanding positive food system externalities.
Overall, 100 negative externalities attributable to different steps of the food supply were collected.
The majority of externalities are directly connected to the production or consumption of food, such as the emission of GHGs. A small number of indirect externalities, such as higher suicide rates among farmers, are included to demonstrate the need for a deeper understanding of complex food system externalities. Some food system externalities affect multiple of the defined impact areas. In that case, the externality was allocated to its main impact area, although the secondary and even tertiary impacts may also be significant. This was the case for several of the externalities impacting the environment and biodiversity. In addition, some externalities were challenging to identify in a measurable manner. Externalities that are considered important but lack clear scientific indicators are listed in the overview without units.
Figure 1: The food system impact framework
Externalities in the environment and biodiversity impact area were predominantly derived from the impact assessment methodology most commonly used in life cycle assessments (LCA), ReCiPe (Huijbregts et al., 2016). ReCiPe was also used as the basis for the monetization factors used in this thesis. Livelihood indicators were largely derived from the set of social externalities defined by the monetization standard used in this thesis. These indicators in turn are based on human rights, labor rights and corporate responsibility standards (True Price, 2020). Human health as well as economy externalities were partly derived from the WBCSD (2018) framework. Human health externalities are measured by disability-adjusted life years (DALYs), which are calculated by adding years of life lost and years of life lost due to disability (WHO, 2020). Animal welfare externalities are accounted for with an indicator proposed by Scherer et al. (2018).
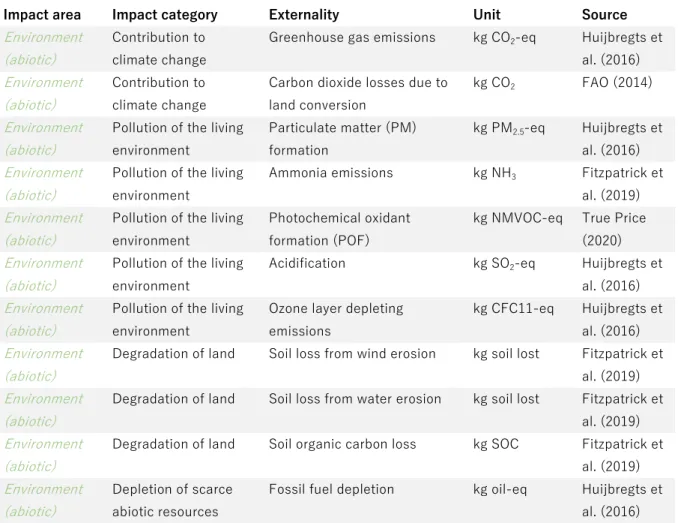
All externalities collected including their sources are listed in Table 3, which divides impact areas into impact categories in order to illustrate different types of impacts within each impact area. For both livelihood and economy externalities, the framework is unlikely to be exhaustive. Additional expert input is needed to improve the framework in those areas. The framework also requires further development to better reflect animal welfare externalities. As the basis for true cost calculation, Table 3 requires frequent updates to reflect current scientific knowledge and incorporate new insights on interactions between different externalities.
Table 3: Overview of globally relevant food-system externalities including the respective source (*: included to better reflect diversity of food system workers and highlight unpaid/insufficiently insured labor, **:
included based on discussions with food system experts, further research required)
Impact area Impact category Externality Unit Source
Environment (abiotic)
Contribution to climate change
Greenhouse gas emissions kg CO2-eq Huijbregts et al. (2016) Environment
(abiotic)
Contribution to climate change
Carbon dioxide losses due to land conversion
kg CO2 FAO (2014)
Environment (abiotic)
Pollution of the living environment
Particulate matter (PM) formation
kg PM2.5-eq Huijbregts et al. (2016) Environment
(abiotic)
Pollution of the living environment
Ammonia emissions kg NH3 Fitzpatrick et al. (2019) Environment
(abiotic)
Pollution of the living environment
Photochemical oxidant formation (POF)
kg NMVOC-eq True Price (2020) Environment
(abiotic)
Pollution of the living environment
Acidification kg SO2-eq Huijbregts et al. (2016) Environment
(abiotic)
Pollution of the living environment
Ozone layer depleting emissions
kg CFC11-eq Huijbregts et al. (2016) Environment
(abiotic)
Degradation of land Soil loss from wind erosion kg soil lost Fitzpatrick et al. (2019) Environment
(abiotic)
Degradation of land Soil loss from water erosion kg soil lost Fitzpatrick et al. (2019) Environment
(abiotic)
Degradation of land Soil organic carbon loss kg SOC Fitzpatrick et al. (2019) Environment
(abiotic)
Depletion of scarce abiotic resources
Fossil fuel depletion kg oil-eq Huijbregts et al. (2016)
Impact area Impact category Externality Unit Source Environment
(abiotic)
Depletion of scarce abiotic resources
(Other) non-renewable material depletion
kg Cu-eq Huijbregts et al. (2016) Environment
(abiotic)
Depletion of scarce abiotic resources
Scarce water use (blue water) m3 Huijbregts et al. (2016) Biodiversity Pollution of the living
environment
Terrestrial ecotoxicity (air pollution)
kg 1,4-DB-eq Huijbregts et al. (2016) Biodiversity Pollution of the living
environment
Freshwater ecotoxicity (air pollution)
kg 1,4-DB-eq Huijbregts et al. (2016) Biodiversity Pollution of the living
environment
Marine ecotoxicity (air pollution)
kg 1,4-DB-eq Huijbregts et al. (2016) Biodiversity Pollution of the living
environment
Terrestrial ecotoxicity (water pollution)
kg 1,4-DB-eq Huijbregts et al. (2016) Biodiversity Pollution of the living
environment
Freshwater ecotoxicity (water pollution)
kg 1,4-DB-eq Huijbregts et al. (2016) Biodiversity Pollution of the living
environment
Marine ecotoxicity (water pollution)
kg 1,4-DB-eq Huijbregts et al. (2016) Biodiversity Pollution of the living
environment
Freshwater eutrophication kg P-eq to freshwater
Huijbregts et al. (2016) Biodiversity Pollution of the living
environment
Marine eutrophication kg N-eq to marine water
True Price (2020) Biodiversity Pollution of the living
environment
Terrestrial ecotoxicity (soil pollution)
kg 1,4-DB-eq Huijbregts et al. (2016) Biodiversity Pollution of the living
environment
Freshwater ecotoxicity (soil pollution)
kg 1,4-DB-eq Huijbregts et al. (2016) Biodiversity Pollution of the living
environment
Marine ecotoxicity (soil pollution)
kg 1,4-DB-eq Huijbregts et al. (2016) Biodiversity Degradation of
biodiversity and ecosystems
Land occupation MSA ha yr True Price (2020)
Biodiversity Degradation of biodiversity and ecosystems
Land transformation ha True Price
(2020)
Livelihoods Labor Underage workers below
minimum age (12-13)
child FTE True Price (2020) Livelihoods Labor Underage workers that are
not attending school
children True Price (2020) Livelihoods Labor Labor force to be audited for
child labor
FTE (full-time equivalent)
True Price (2020)
Livelihoods Labor Forced workers FTE True Price
(2020) Livelihoods Labor Forced workers in debt
bondage
FTE True Price
(2020)
Livelihoods Labor Forced workers who are
victims of abuse
FTE True Price
(2020) Livelihoods Labor Labor force to be audited for
forced labor
FTE True Price
(2020)
Impact area Impact category Externality Unit Source
Livelihoods Labor Unpaid labor (work-related) FTE *
Livelihoods Labor Unpaid labor (other, e.g. care) FTE *
Livelihoods Discrimination Female workers without maternity leave provision
FTE True Price
(2020) Livelihoods Discrimination Value of denied maternity
leave
$ True Price
(2020) Livelihoods Discrimination Male workers without
paternity leave provision
FTE *
Livelihoods Discrimination Value of denied paternity leave
$ *
Livelihoods Discrimination Wage gap from gender discrimination
$ True Price
(2020) Livelihoods Discrimination Wage gap from unequal
opportunities (gender discr.)
$ True Price
(2020) Livelihoods Discrimination Labor force to be audited for
gender discrimination
FTE True Price
(2020) Livelihoods Discrimination Wage gap from racial
discrimination
$ *
Livelihoods Discrimination Wage gap from unequal opportunities (racial discr.)
$ *
Livelihoods Discrimination Labor force to be audited for racial discrimination
FTE *
Livelihoods Discrimination Wage gap from religious discrimination
$ *
Livelihoods Discrimination Wage gap from unequal opportunities (religious discr.)
$ *
Livelihoods Discrimination Labor force to be audited for religious discrimination
FTE *
Livelihoods Non-guarantee of a decent living standard
Wage gap of workers earning below minimum wage
$ True Price
(2020) Livelihoods Non-guarantee of a
decent living standard
Wage gap of workers earning above minimum but below decent living wage
$ True Price
(2020)
Livelihoods Non-guarantee of a decent living standard
Labor force to be audited for insufficient wages
FTE True Price
(2020) Livelihoods Non-guarantee of a
decent living standard
Workers without legal social security
$ True Price
(2020) Livelihoods Non-guarantee of a
decent living standard
Workers with insufficient social security
$ *
Livelihoods Non-guarantee of a decent living standard
Value of denied paid leave $ True Price (2020) Livelihoods Non-guarantee of a
decent living standard
Value of denied sick leave $ *
Livelihoods Non-guarantee of a decent living standard
Labor force to be audited for insufficient social security
FTE True Price
(2020)
Impact area Impact category Externality Unit Source Livelihoods Non-guarantee of a
decent living standard
Workers performing illegal overtime
FTE True Price
(2020) Livelihoods Non-guarantee of a
decent living standard
Workers performing underpaid overtime
FTE True Price
(2020) Livelihoods Non-guarantee of a
decent living standard
Overtime wage gap $ True Price
(2020) Livelihoods Non-guarantee of a
decent living standard
Labor force to be audited for illegal overtime
FTE True Price
(2020) Livelihoods Non-guarantee of a
decent living standard
Income gap $ True Price
(2020) Livelihoods Non-guarantee of a
decent living standard
Lack of access to education $ True Price (2020) Livelihoods Occupational health
and safety risks
Workers who experienced harassment
workers True Price (2020) Livelihoods Occupational health
and safety risks
Labor force to be audited for harassment
FTE True Price
(2020) Livelihoods Occupational health
and safety risks
Non-fatal occupational incidents (insured)
incidents True Price (2020) Livelihoods Occupational health
and safety risks
Non-fatal occupational incidents (uninsured)
incidents True Price (2020) Livelihoods Occupational health
and safety risks
Fatal occupational incidents incidents True Price (2020) Livelihoods Occupational health
and safety risks
Occupational incidents with breach of H&S standards
incidents True Price (2020) Livelihoods Occupational health
and safety risks
Work performed in violation of H&S standards
FTE True Price
(2020) Livelihoods Occupational health
and safety risks
Labor force to be audited for H&S
FTE True Price
(2020) Livelihoods Occupational health
and safety risks
Exposure to pesticides DALYs WBCSD
(2018) Livelihoods Lack of union rights Instances of denied freedom
of association
violations True Price (2020) Livelihoods Lack of union rights Labor force to be audited for
denied freedom of association
FTE True Price
(2020) Livelihoods Loss of livelihood Income loss due to price
volatility
$ **
Livelihoods Loss of livelihood Income loss due to conflict $ **
Livelihoods Loss of livelihood Lack of access to financial services
$ **
Livelihoods Mental health Contribution to increased divorce rates in agriculture (indirect)
n/a **
Livelihoods Mental health Contribution to increased suicide rates in agriculture (indirect)
n/a **
Impact area Impact category Externality Unit Source Livelihoods Mental health Impact of working away from
home (seasonal workers) (indirect)
n/a **
Human Health Production-related human health impacts
Human toxicity (air pollution) DALYs Huijbregts et al. (2016) Human Health Production-related
human health impacts
Human toxicity (water pollution)
DALYs Huijbregts et al. (2016) Human Health Production-related
human health impacts
Human toxicity (soil pollution) DALYs Huijbregts et al. (2016) Human Health Consumption-related
human health impacts
Health impact of undernutrition
DALYs Fitzpatrick et al. (2019) Human Health Consumption-related
human health impacts
Health impact of malnutrition DALYs WBCSD (2018) Human Health Consumption-related
human health impacts
Health impact of overweight and obesity
DALYs WBCSD
(2018) Human Health Consumption-related
human health impacts
Health impact of hypertension DALYs WBCSD (2018) Human Health Consumption-related
human health impacts
Health impact of non- communicable diseases
DALYs WBCSD
(2018) Human Health Consumption-related
human health impacts
Health impact of dementia DALYs Fitzpatrick et al. (2019) Human Health Consumption-related
human health impacts
Health impact of food poisoning
DALYs WBCSD
(2018) Human Health Consumption-related
human health impacts
Health impact of pesticide exposure
DALYs WBCSD
(2018) Human Health Public health threats
from livestock production
Health impact of antibiotic use
DALYs Fitzpatrick et al. (2019)
Human Health Public health threats from livestock production
Contribution to the exposure to zoonotic diseases (indirect)
DALYs **
Economy Additional spending through taxes
Taxes for food system- targeted subsidies
$ Fitzpatrick et
al. (2019) Economy Additional spending
through taxes
Taxes for regulation and research
$ Fitzpatrick et
al. (2019) Economy Additional spending
through taxes
Taxes for welfare and social services (received from food workers) (indirect)
$ **
Economy System stability Reduction of small family farms (indirect)
n/a **
Economy System stability Decline of rural communities (indirect)
n/a **
Economy System stability Creation of local jobs FTEs **
Animal welfare
Animal welfare Animal years suffered ALYs Scherer et al.
(2018)
For a full true cost of food picture, the cost of all of these externalities need to be considered. In reality, many of them are currently not quantifiable due to limited data availability or accessibility.
For the true cost quantification of this thesis, the true cost is therefore approximated with a selection of externalities most relevant to the Swiss food system.
2.3 EXTERNALITY PRIORITIZATION
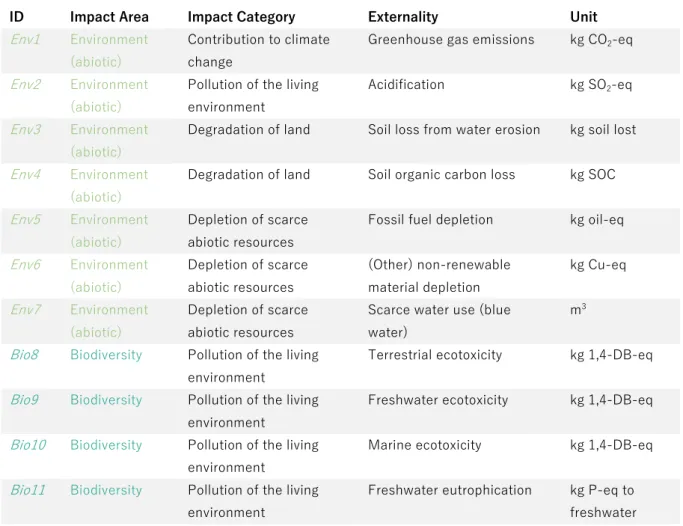
In a final externality selection step, 28 externalities were prioritized for the true cost quantification undertaken in this thesis (Table 4). Whilst the overall goal was to select the most important and impactful externalities in the Swiss context, externalities of some impact areas were selected based on the feasibility of their quantification. For environment, the most important indicators in the Swiss context were chosen. For biodiversity, all indicators were chosen. For livelihoods, only three of over 50 externalities were chosen due to a significant lack of data. The prioritized externalities represent issues relevant in Swiss agriculture. For human health, almost all indicators are represented in the selection below. For economy externalities, the framework assesses the amount of taxes used for food system-targeted subsidies, market support as well as taxes for regulation and research. These costs do not fall into the classic definition of externalities but are included because they are not directly reflected in what consumers pay for food today. Other economic externalities should be considered in future holistic true cost accounting frameworks. Last but not least, in the case of animal welfare externalities, the single indicator identified was included.
Table 4: Overview of prioritized food system externalities
ID Impact Area Impact Category Externality Unit
Env1 Environment (abiotic)
Contribution to climate change
Greenhouse gas emissions kg CO2-eq
Env2 Environment (abiotic)
Pollution of the living environment
Acidification kg SO2-eq
Env3 Environment (abiotic)
Degradation of land Soil loss from water erosion kg soil lost
Env4 Environment (abiotic)
Degradation of land Soil organic carbon loss kg SOC
Env5 Environment (abiotic)
Depletion of scarce abiotic resources
Fossil fuel depletion kg oil-eq
Env6 Environment (abiotic)
Depletion of scarce abiotic resources
(Other) non-renewable material depletion
kg Cu-eq
Env7 Environment (abiotic)
Depletion of scarce abiotic resources
Scarce water use (blue water)
m3
Bio8 Biodiversity Pollution of the living environment
Terrestrial ecotoxicity kg 1,4-DB-eq
Bio9 Biodiversity Pollution of the living environment
Freshwater ecotoxicity kg 1,4-DB-eq
Bio10 Biodiversity Pollution of the living environment
Marine ecotoxicity kg 1,4-DB-eq
Bio11 Biodiversity Pollution of the living environment
Freshwater eutrophication kg P-eq to freshwater
ID Impact Area Impact Category Externality Unit Bio12 Biodiversity Pollution of the living
environment
Marine eutrophication kg N-eq to marine water Bio13 Biodiversity Degradation of
biodiversity and ecosystems
Land occupation MSA ha yr
Bio14 Biodiversity Degradation of biodiversity and ecosystems
Land transformation ha
Liv15 Livelihoods Non-guarantee of a decent living standard
Workers with insufficient social security
$
Liv16 Livelihoods Non-guarantee of a decent living standard
Workers performing free labor
$
Liv17 Livelihoods Occupational health and safety
Exposure to pesticides DALYs
Hum18 Human Health Production-related human health impacts
Human toxicity DALYs
Hum19 Human Health Consumption-related human health impact
Health impact of malnutrition DALYs
Hum20 Human Health Consumption-related human health impact
Health impact of overweight and obesity
DALYs
Hum21 Human Health Consumption-related human health impact
Health impact of hypertension
DALYs
Hum22 Human Health Consumption-related human health impact
Health impact of non- communicable diseases
DALYs
Hum23 Human Health Consumption-related human health impact
Health impact of food poisoning
DALYs
Hum24 Human Health Consumption-related human health impact
Health impact of pesticide exposure (consumption)
DALYs
Hum25 Human Health Consumption-related human health impact
Health impact of antibiotic use
DALYs
Eco26 Economy Additional spending through taxes
Taxes for food system- targeted subsidies
$
Eco27 Economy Additional spending through taxes
Taxes for regulation and research
$ Ani28 Animal Welfare Animal Welfare Animal years suffered ALYs
Based on these 28 externalities, the goal is to approximate a true cost picture as complete as possible with currently available data.
2.4 DATA SOURCES
Data was sourced for both the Swiss food system as well as for eight selected products. Data availability was found to be limited on both the system and product level (Table 5). This is discussed in more detail in the discussion part of this thesis.
Table 5: Data availability for system and product level quantification (red: no or very limited data, yellow:
limited data availability, green: data available)
Impact area System level quantification Product level quantification Environment (abiotic) System level emissions and
natural capital degradation
Product-specific
life-cycle assessment (LCA) Biodiversity System level state of biodiversity
and ecosystems
Product-specific
life-cycle assessment (LCA) Livelihoods System level statistics on quality
of life of all human food system participants
Product-specific social life-cycle assessment (S-LCA)
Human Health Public health costs for environmental and personal human health externalities, share attributable to diet
Environmental human health externalities (production- related): LCA
Personal human health externalities (consumption- related): DALYs attributable to diet/food group intake
Economy Taxes and subsidies for food system sectors, economic data
Product-specific taxes and subsidies
Animal Welfare System level statistics on animal welfare
Product-specific animal welfare impact
Despite some of the externalities being quantifiable on both a system and product level, direct comparability due to different data sources and monetization factors is limited. System level studies often provide impacts in monetary terms, whilst product level externalities require monetization factors specific to their respective units.
2.5 MONETIZATION
The missing link between the defined externalities and the cost they represent to society are unit- specific monetization factors (MF). In order to be as consistent as possible, this thesis uses only one set of monetization factors to translate measurable externalities into monetary costs, global monetization factors published by the Dutch True Price Foundation. The standard was published in May 2020 and was specifically developed for the comparison of different human activity-related externalities. It is thus highly suitable for this thesis. The monetization factors are derived from four different types of costs: restoration, compensation, prevention of re-occurrence and retribution costs, which are combined to define a remediation cost for every externality. The exact definition of each type of cost is defined in Table 18 in the appendix. The foundation cites Article 22 of the UN Guiding Principles on Business and Human Rights as the basis for this approach, which states that
“Where business enterprises identify that they have caused or contributed to adverse impacts, they should provide for or cooperate in their remediation through legitimate processes” (True Price, 2020, p. 12). All monetization factors listed in Table 6 were converted from Euro to Swiss francs with the average conversion rate between January and June 2020, 1.06 (European Central Bank, 2020).
Monetization factors are especially useful for the product level estimations, where the units can simply be monetized with the factors. On a system level, externalities are often not monetized based on system level externalities or emissions but quantified in terms of system level expenditure. In this thesis, only the GHG emissions, soil organic carbon loss and DALY monetization factor is used on a system level. The cost of all other externalities is derived from other, Swiss-specific system level costs. On a product level, the True Price monetization factors are used for all quantifiable externalities. The foundation provides no monetization factors for the consumption-related human health, animal welfare and economy impact areas. For the DALYs caused by the consumption of food, it is assumed that the DALY monetization factor for production-related DALYs can be used.
Animal welfare and economy costs can only be assessed on a system level using Swiss-specific sources. In terms of livelihood externalities, True Price does not provide monetization factors.
Livelihood costs on a system level are approximated as explained in chapter 2.4 of the appendix.
Table 6: Unit-specific monetization factors
ID Impact area Externality Unit CHF/unit
Env1 Environment (abiotic)
Greenhouse gas emissions kg CO2-eq 0.16
Env2 Environment (abiotic)
Acidification kg SO2-eq 3.56
Env3 Environment (abiotic)
Soil loss from water erosion kg soil lost 0.03
Env4 Environment (abiotic)
Soil organic carbon loss kg SOC 0.03
Env5 Environment (abiotic)
Fossil fuel depletion kg oil-eq 0.46
Env6 Environment (abiotic)
(Other) non-renewable material depletion
kg Cu-eq 0.24
Env7 Environment (abiotic)
Scarce water use (blue water) m3 1.35
Bio8 Biodiversity Terrestrial ecotoxicity kg 1,4-DB-eq 7.71
Bio9 Biodiversity Freshwater ecotoxicity kg 1,4-DB-eq 0.03
Bio10 Biodiversity Marine ecotoxicity kg 1,4-DB-eq 0.01
Bio11 Biodiversity Freshwater eutrophication kg P-eq to freshwater
322.24
Bio12 Biodiversity Marine eutrophication kg N-eq to marine water
67.20
Bio13 Biodiversity Land occupation (land type “other forest”)
MSA ha yr 1’060
Bio14 Biodiversity Land transformation (land type “other forest”)
ha 2’173
Liv15 Livelihoods Workers with insufficient social security
$ -
Liv16 Livelihoods Workers performing free labor $ -
Liv17 Livelihoods Exposure to pesticides DALYs 123’808
Hum18 Human Health Human toxicity DALYs 123’808
ID Impact area Externality Unit CHF/unit Hum19 Human Health Health impact of malnutrition DALYs 123’808 Hum20 Human Health Health impact of overweight and
obesity
DALYs 123’808
Hum21 Human Health Health impact of hypertension DALYs 123’808 Hum22 Human Health Health impact of non-communicable
diseases
DALYs 123’808
Hum23 Human Health Health impact of food poisoning DALYs 123’808 Hum24 Human Health Health impact of pesticide exposer
(consumption)
DALYs 123’808
Hum25 Human Health Health impact of antibiotic use DALYs 123’808 Eco26 Economy Taxes for food system-targeted
subsidies
$ -
Eco27 Economy Taxes for regulation and research $ -
Ani28 Animal Welfare Animal years suffered ALYs n/a
All monetization factors are globally applicable monetization factors, with the exception of the cost of one DALY. Whilst True Price has defined country-specific monetization factors, these are not publicly available. The foundation has however provided the information that the DALY cost in Switzerland equals more than double the global value. This thesis therefore uses twice the global value for the cost per DALY in Switzerland (P. Galgani, personal communication, August 10, 2020).
2.6 NATIONAL LEVEL QUANTIFICATION
Current true cost estimates generally focus on food systems and not individual products. System level quantifications are especially useful for understanding which impact areas drive external costs and for quantifying externalities that are most easily quantified at a system level. This thesis thus first undertakes a system level quantification of the Swiss food system true cost based on the previously prioritized 28 externalities. As many of these externalities are not only caused by the food system, it is necessary to define how much of the system level external costs are connected to the food system. As visualized in the equation below, the external cost connected to each individual externality (i) is summed up to represent the external cost of each food impact area. The sum of external costs is then added to the current national expenditure on food and non-alcoholic drinks.
𝑇𝑟𝑢𝑒 𝑐𝑜𝑠𝑡 (𝑠𝑦𝑠𝑡𝑒𝑚) = 𝑁𝑎𝑡𝑖𝑜𝑛𝑎𝑙 𝑓𝑜𝑜𝑑 𝑒𝑥𝑝𝑒𝑛𝑑𝑖𝑡𝑢𝑟𝑒
+ ∑(𝑁𝑎𝑡𝑖𝑜𝑛𝑎𝑙 𝑒𝑥𝑡𝑒𝑟𝑛𝑎𝑙 𝑐𝑜𝑠𝑡 ∗ 𝑠ℎ𝑎𝑟𝑒 𝑎𝑡𝑡𝑟𝑖𝑏𝑢𝑡𝑎𝑏𝑙𝑒 𝑡𝑜 𝑡ℎ𝑒 𝑓𝑜𝑜𝑑 𝑠𝑦𝑠𝑡𝑒𝑚)𝑖
𝑛
𝑖 =1
In a first step, total consumer expenditure on food and non-alcoholic drinks in Switzerland in 2018 is estimated. This was done based on FSO (2019a) data on private and collective household (e.g.
schools, hospitals, prisons) expenditure at the retail and wholesale level, as well as in hospitality.
In a second step, all externalities prioritized are quantified for 2018. Table 7 illustrates which data sources were used for the externalities possible to quantify in this thesis and what collected data covers. Many externalities cover only a part of total external costs and are thus underestimations.