doi: 10.3389/fmars.2018.00522
Edited by:
Michael Arthur St. John, Technical University of Denmark, Denmark Reviewed by:
Antonio Bode, Instituto Español de Oceanografía (IEO), Spain Mario Barletta, Universidade Federal de Pernambuco (UFPE), Brazil
*Correspondence:
Ying Wu wuying@sklec.ecnu.edu.cn
Specialty section:
This article was submitted to Marine Ecosystem Ecology, a section of the journal Frontiers in Marine Science Received:03 September 2018 Accepted:21 December 2018 Published:11 January 2019 Citation:
Wang F, Wu Y, Chen Z, Zhang G, Zhang J, Zheng S and Kattner G (2019) Trophic Interactions of Mesopelagic Fishes in the South China Sea Illustrated by Stable Isotopes and Fatty Acids.
Front. Mar. Sci. 5:522.
doi: 10.3389/fmars.2018.00522
Trophic Interactions of Mesopelagic Fishes in the South China Sea
Illustrated by Stable Isotopes and Fatty Acids
Fuqiang Wang1, Ying Wu1* , Zuozhi Chen2, Guosen Zhang1, Jun Zhang2, Shan Zheng3 and Gerhard Kattner4
1State Key Laboratory of Estuarine and Coastal Research, East China Normal University, Shanghai, China,2South China Sea Fisheries Research Institute, Chinese Academy of Fishery Sciences, Guangzhou, China,3Jiao Zhou Bay Marine Ecosystem Research Station, Institute of Oceanology, Chinese Academy of Sciences, Qingdao, China,4Alfred Wegener Institute, Helmholtz Centre for Polar and Marine Research, Bremerhaven, Germany
As the most abundant fishes and the least investigated components of the open ocean ecosystem, mesopelagic fishes play an important role in biogeochemical cycles and hold potentially huge fish resources. There are major gaps in our knowledge of their biology, adaptations and trophic dynamics and even diel vertical migration (DVM). Here we present evidence of the variability of ecological behaviors (migration and predation) and trophic interactions among various species of mesopelagic fishes collected from the South China Sea indicated by isotopes (δ13C, δ15N), biomarker tools [fatty acids (FAs), and compound- specific stable isotope analysis of FAs (CSIA)].
Higher lipid contents of migrant planktivorous fishes were observed with average values of 35%, while others ranged from 22 to 29.5%. These high lipids contents limit the application ofδ13Cbulk(bulk–tissueδ13C) as diet indicator; insteadδ13Cextraction(the lipid extracted δ13C) values were applied successfully to reflect dietary sources. Theδ15N values of non-migrant planktivorous and piscivorous fishes varied in a narrow range (10.0–10.8h). This small difference may be caused by the low temperature in deep ocean, which results in low metabolic rates of nitrogen. The piscivorous fishes had higher FA ratios of DHA (22:6n−3)/EPA (20:5n−3) than planktivorous fishes, which mirrored their potential carnivory. CSIA can reveal small changes in biochemical composition and distinguishes between possible dietary sources such as between the non-migrant piscivorous and the semi-migrant piscivorous fishes with significantly different δ13C values of the 20:4n−6 and 20:5n−3 FAs (p<0.01). Mesopelagic fishes exhibit complex trophic interactions revealed by molecular and CSIA tools and play a vital role in the marine “biological pump.” This knowledge is important to comprehensively evaluate the role of mesopelagic fishes in global carbon budgets.
Keywords: mesopelagic fishes,δ13Cextraction,δ15N, fatty acids,δ13C of individual fatty acids, South China Sea
Abbreviations:δ13Cbulk,bulk–tissueδ13C;δ13Cextraction,lipid extractedδ13C; CSIA, compound- specific stable isotope analysis; DHA (22:6n−3), docosahexaenoic acid; DVM, diel vertical migration; EPA (20:5n−3), eicosapentaenoic acid; FA, fatty acids.
INTRODUCTION
Mesopelagic fishes are the most abundant fishes in the oceanic waters but are least studied and underutilized by mankind (Catul et al., 2010; Olivar et al., 2012); their biomass has recently been estimated at 10 billion metric tons (Irigoien et al., 2014; St. John et al., 2016). Most mesopelagic fishes perform DVM in the twilight zone (Klevjer et al., 2012).
They move to the mesopelagic layer in daytime in search of predator refuge and ascend to the surface layer at night time for feeding following the nightly ascension of zooplankton (Davison et al., 2013; Olivar et al., 2018). Therefore, this behavior plays an important role in the active transport of carbon (C) throughout the water column and is essential for understanding deep-ocean C sequestration dynamics (Choy et al., 2015;Jonasdottir et al., 2015;Cavallaro et al., 2016). However, there is also a great variability in migration patterns within the mesopelagic fishes (Catul et al., 2010). The study of their biology, adaptations and trophic dynamics is important for evaluating their profound implications for food web dynamics and global carbon budgets.
Biochemical tracers, such as FAs,δ13Cbulk (bulk–tissue13C), δ15N, and compound-specific isotope analysis (CSIA) of13C in FAs, have been proven to be particularly useful for studying trophic ecology (Fry, 1988; Stowasser et al., 2009; Gillikin et al., 2017;Kristensen et al., 2017). These biomarker methods provide temporally and spatially integrated insights into trophic relationships among organisms and have thus considerably improved the understanding of food webs (Layman et al., 2012).
Many FAs in the marine environment are only biosynthesized by certain bacteria, phytoplankton, zooplankton, and macroalgae species (Dalsgaard et al., 2003;Leu et al., 2013;Kohlbach et al., 2016). Thus, they can become essential dietary components for higher trophic level species and are used as dietary tracers in food web studies (Connan et al., 2010). Consumers preferentially retain varying levels of 13C and 15N in their tissues during metabolic processing, and therefore δ13Cbulk and δ15N values can reveal quantitative estimates of the trophic positions of food web components (DeNiro and Epstein, 1977; Petursdottir et al., 2008;Svensson et al., 2014;Choy et al., 2015;Gloeckler, 2016).δ13Cbulk is mainly used to indicate the foraging habitats of predators, while δ15N indicates the trophic position of a consumer (Fry, 1988; Cherel et al., 2010). More recently, the combination of FA and stable isotope analysis (FA-CSIA) has also been used to clarify complex trophic dynamics and produces more accurate dietary relationships that might be overlooked through stable isotopes or FAs only (Gladyshev et al., 2012, 2016;Pollierer et al., 2012; Budge et al., 2016;Kohlbach et al., 2016).
Previous studies recognized that mesopelagic fishes performed DVM and had high lipid contents (Salvanes and Kristofersen, 2001; Stowasser et al., 2009). Lipids are isotopically depleted relative to proteins and carbohydrates (DeNiro and Epstein, 1977;
Cherel et al., 2010). The δ13Cbulk of tissue with a high lipid content is lower than that with a low lipid content, potentially confounding interpretations of food web structure (Post et al., 2007;Hoffman and Sutton, 2010). Until now, few studies have
used δ13C to elucidate dietary sources of mesopelagic fishes (Olivar et al., 2018). δ15N often serves as an indicator of the trophic position of consumers (Fry, 1988; Cherel et al., 2010), but recent studies found thatδ15N enrichment was low between trophic levels in the deeper waters (Choy et al., 2012; Nerot et al., 2015; Gillikin et al., 2017). This phenomenon limits the application of δ15N to study mesopelagic fishes. Previous studies have mainly focused on mesopelagic fishes that perform DVM but information about the biological diversity and trophic interactions of non-migrant and semi-migrant fishes is lacking (Battaglia et al., 2014;Olivar et al., 2018). Studying non-migrant mesopelagic fishes will help to also understand the fate of the nutrient cycling in ocean (Catul et al., 2010;Olivar et al., 2012;
Davison et al., 2013).
This study was the first investigation to characterize the trophic interactions of mesopelagic fishes from the South China Sea (SCS) using stable isotopes, FAs and CSIA. The limitations and implications of direct isotope tools in mesopelagic fishes’
ecological studies were explored in detail. We expect that our multivariate biomarker approach will provide further evidence on the diversity of life cycle and history of mesopelagic fishes from extreme environments. Based on the biological diversity, we furthermore consider the impact of the variability of biological behaviors of mesopelagic fishes on the global carbon budgets in the open-ocean ecosystem.
MATERIALS AND METHODS
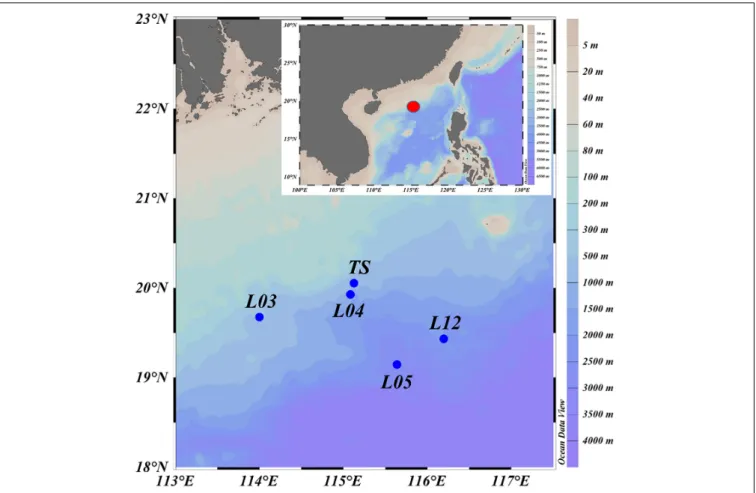
Fishes were collected from the north continental slope of the SCS during a cruise in June 2015 (R/V Nan Feng) (Figure 1).
The mesopelagic fishes were the dominant species, especially the migrant planktivorous fishes. The fishes were caught using a mid- water trawl that had a 136.1 m straightening mouth perimeter and a 30 m head rope length. The trawl was composed of four panels with a stretched mesh size of 10 mm, square-shaped codend meshes extending 20 m from the codend, and a 40 mm mesh in the forward section of the net. When towed pelagically, the mean vertical opening height of the mid-water trawl was 8 m. Hauls were performed at specific layers in the mesopelagic or epipelagic zones based on echogram during day and night (Zhang et al., 2018). Sampling details and fish species are listed inTables 1,2.
This study was exempt from ethics approval. It was allowed by local legislation.
Upper-layer (0–200 m) zooplankton, collected by a vertical trawling net with mesh sizes of 76 and 200 µm, were termed microzooplankton and mesozooplankton, respectively. Middle- layer (400–600 m) zooplankton was collected by a multiple opening-closing net fitted with a 200µm mesh. The zooplankton was caught during day and night time, respectively. The samples were rinsed with filtered seawater and filtered onto pre- combusted (450◦C, 5 h) 47-mm GF/F filters (glass-fiber filter, Whatman, United States).
Classification of Fish Groups
The mesopelagic fishes from 5 stations were assigned to 5 functional groups based on their migrating habit and feeding
FIGURE 1 |Map of sample collection locations (L03, L04, L05, and L12 are the stations used in the National Key Program for Basic Research. TS is a time series station. The red dot represents the study area in the detail map below).
behavior (Table 2) (Sutton and Hopkins, 1996;Catul et al., 2010;
Choy et al., 2012, 2013; Battaglia et al., 2014; Trueman et al., 2014). Every species had at least 3 replicates of similar size. Group 1 exhibits active DVM, feeds on plankton and is termed migrant planktivorous fishes, and had the largest number of individuals.
Group 2 shows passive DVM, mainly feeds on small mesopelagic fishes and is named migrant piscivorous fishes. Group 3 has a non-migrating habit, feeds on plankton and is called non-migrant planktivorous fishes. Group 4 has a non-migrating habit, mainly feeds on small fishes and is called non-migrant piscivorous fishes.
Group 5 has a semi-migrating habit, mainly preys on small fishes and is named semi-migrant piscivorous fishes. In total, 46 fishes were analyzed individually.
Sample Selection
All fish and zooplankton samples were stored at −20◦C and transferred to the laboratory. There, fish muscle tissue was excised from below the dorsal fin, and skin and scales were removed. The tissue and zooplankton samples were lyophilized in a freeze-dryer (LOC-1; Christ, Germany) and stored at −40◦C until analysis (Wan et al., 2010). The dried fish muscle of the samples was powdered using a mortar and pestle.
Fatty Acid Analysis
The FA composition was determined from a known quantity of tissue extracted using dichloromethane: methanol (2:1 v/v,
TABLE 1 |Sampling locations, dates, and water depths.
Bottom Sample
Station Longitude Latitude Date (2015) Time depth (m) depth (m)
L03 114◦39.180E 18◦54.630N 06/16 17:57–18:57 1310 450
L04 115◦01.640E 18◦54.490N 06/15 19:50–20:00 2800 500
L05 115◦36.380E 19◦12.440N 06/14 22:40–23:40 2770 65
L12 116◦07.680E 19◦32.470N 06/21 16:00–17:00 1760 600
TS 115◦08.580E 20◦01.060N 06/26 10:25–11:25 790 450
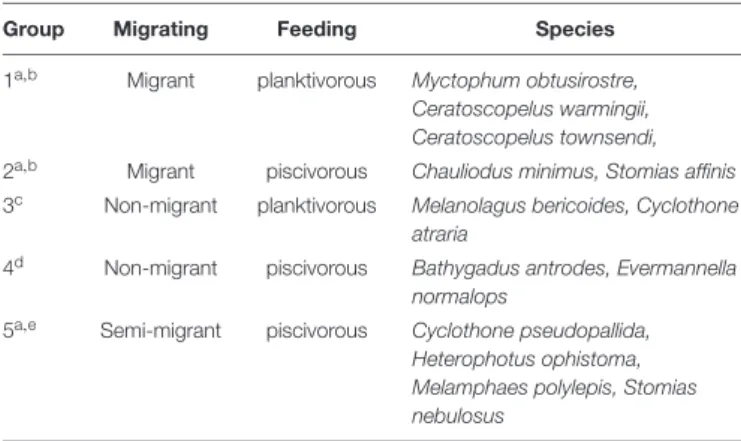
TABLE 2 |Fish groups based on migrating and feeding behavior.
Group Migrating Feeding Species
1a,b Migrant planktivorous Myctophum obtusirostre, Ceratoscopelus warmingii, Ceratoscopelus townsendi, 2a,b Migrant piscivorous Chauliodus minimus, Stomias affinis 3c Non-migrant planktivorous Melanolagus bericoides, Cyclothone
atraria
4d Non-migrant piscivorous Bathygadus antrodes, Evermannella normalops
5a,e Semi-migrant piscivorous Cyclothone pseudopallida, Heterophotus ophistoma, Melamphaes polylepis, Stomias nebulosus
(a:Catul et al., 2010; b:Choy et al., 2012; c:Battaglia et al., 2014; d:Sutton and Hopkins, 1996; e:Trueman et al., 2014).
including 0.01% BHT) based on the Folch method for total lipid determination (Folch et al., 1957; Wan et al., 2010). For the extraction of the dorsal muscle samples, approximately 15 mL of dichloromethane: methanol (2:1) was added to 100 mg of the sample. The mixture was extracted and centrifuged (3000 rpm, 10 min), and the upper organic solvent layer was transferred to a flask using a pipette. The solvent was evaporated to dryness under a stream of N2at room temperature and weighed, and the lipid content was calculated as percentage of the mass of unextracted freeze-dried tissue (Svensson et al., 2014). The extracted tissue has been dried under a stream of N2at room temperature and was used to measure13C.
The FAs were transesterified to FA methyl esters (FAMEs) in a mixture of methanol (containing 5% HCl) and n-hexane at 50◦C for approximately 12 h (Eder, 1995). The FAMEs were analyzed using gas chromatography (7890A GC; Agilent, United States) equipped with a DB-FFAP capillary column (30 m in length, 0.25 mm i.d., 0.25µm film thickness; Agilent, United States). As an internal recovery standard, C21:0 was added to the samples, and C19:0 methyl ester was added as an internal quantification standard. The injector and detector temperatures were both 250◦C. Injections (1 µL) were made at 60◦C, and the temperature was increased to 170◦C at a rate of 30◦C/min. The temperature was held constant for 5 min, increased to 220◦C at 1◦C/min and held at this temperature for 10 min. Nitrogen (N2) was used as carrier gas at a flow rate of 1 mL/min. FAMEs were identified by comparing retention times with commercial standards (37 Component FAME Mix;
Sigma, United States). The individual FAs were expressed as percentage of the total FA content based on peak areas. The FA recovery rate in the analysis was>85%. If more than one sample was analyzed, the data were reported as the mean ±standard deviation (SD).
Stable Isotope Analysis
Tissue stable C isotope ratios (δ13C) were measured before (unextracted tissue; δ13Cbulk) and after extraction (extracted tissue; δ13C extraction). Dried powdered samples were weighed into tin cups, and stable C and N isotopes were measured using
an isotope ratio mass spectrometer (Finnegan Delt plus XP;
Thermo, Germany). The results were normalized to the Vienna Pee Dee Belemnite standard (PDB) forδ13C and to atmospheric N (N2) forδ15N (Cherel et al., 2010). The stable isotope ratios are expressed inδnotation of units per mill as follows (Svensson et al., 2014):
δX(h) = ((Rsample/Rstandard) − 1) × 1000
whereX=13C or15N andR=13C/12C or15N/14N.
The precision of the stable isotope analyses was±0.1h.
Compound-Specific
13C Fatty Acids Analysis
The compound-specific13C FAs were analyzed using a Trace GC Ultra gas chromatograph coupled to a Delta V mass spectrometer via a GC combustion interface using helium (He) as carrier gas (Thermo Scientific, Germany). The FAMEs were separated on a DB-5MS column (50 m, 0.32 mm i.d., 0.25µm film thickness).
Theδ13C values of the FAMEs were calibrated by analyzing the certified standard C18:0 FAME (certified:−23.24h, measured:
−23.34h ± 0.1h) supplied by Indiana University, and the analytical precision was ≤0.3h. All samples were analyzed in triplicate.
To obtain isotope data for the FAs, FAME isotopes were corrected for the isotopes of the methyl moiety originating from methanol using the following formula:
δ13CFA = [(n + 1)∗δ13CFAME−δ13CMeOH]/n,
where δ13CFA is the isotope of the FAs; δ13CFAME is the isotope of the FAME;δ13CMeOHis the isotope of the methanol derivatization reagent (−37.4 ±0.1h); n is the number of C atoms in the FAs.
Statistical Analysis
SPSS 23.0 and Primer 7.0 were used to perform data analysis.
For δ13C values, paired comparisons were made between extracted tissue (δ13Cextraction) and unextracted tissue (δ13Cbulk).
FA compositions and stable isotope data are presented in the Supplementary Material (Supplementary Table S1). Cross- validation using a discriminant analysis was applied to test the efficiency of FA data (Stowasser et al., 2009), and linear regression was used to examine the relationship between lipid content and 1δ13C (δ13Cextraction − δ13Cbulk) values (all fish species). A cluster analysis based on FAs and stable isotopes was performed using Primer 7.0. Based on the coefficients in the linear combinations of variables making up PC’s (principal component), the dominant parameters were chosen to characterize the different fish groups. To illustrate the reliability of the data, the Spearman correlation coefficient and the p value (two-tailed) were used to evaluate the significance of the correlation.
RESULTS
Lipid Content and Fatty Acid Composition
The lipid content of migrant planktivorous fishes exceeded 32%
of dry mass and was significantly higher than that of the other groups (p<0.05,Supplementary Table S1). The non-migrant planktivorous fishes had values of 28.9±0.6%. The other groups showed larger variations (Table 3).
In general, 14 FAs of more than 0.5% of total FAs were detected in all mesopelagic fishes (Table 3; for detailed FA composition, see the data inSupplementary Table S1). 22:6n−3 was the dominant FA in most fishes (16–40.9%), though it was significantly lower in the non-migrant planktivorous fishes (p <0.01). The other major FA was 16:0, which ranged from 19.7 to 28.9%. Other important FAs were 18:1n−9 (10.5–30%), 18:0 (4.2–8.5%), and 20:5n−3 (4.8–8.5%).
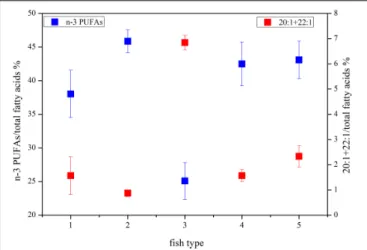
The DHA (22:6n−3)/EPA (20:5n−3) ratios (Supplementary Table S1) in the migrant planktivorous fishes ranged from 3.7 to 4.4, and in the non-migrant planktivorous fishes from 3.0 to 3.7. The highest DHA/EPA ratios were found in the migrant piscivorous fishes; ratios in the non-migrant and semi- migrant piscivorous fishes ranged from 5.3 to 5.7 and 5.1 to 7.8, respectively. Overall, piscivorous fishes had significantly higher DHA/EPA ratios than planktivorous fishes (p<0.01). All groups had more than 34% ofn−3 polyunsaturated FAs (n−3 PUFAs), except the non-migrant planktivorous fishes whosen−3 PUFA content was 21–29%. Conversely, the sum of the 20:1 and 22:1 FAs in non-migrant planktivorous fishes was approximately 7%, which was significantly higher than that in the other groups (p<0.01) (Figure 2).
FIGURE 2 |Some characteristic fatty acid combinations of the different fish groups (group 1, migrant planktivorous fishes; group 2, migrant piscivorous fishes; group 3, non-migrant planktivorous fishes; group 4, non-migrant piscivorous fishes; group 5, semi-migrant piscivorous fishes).
δ
13C and δ
15N Values
Theδ13Cbulk(unextracted tissue) of zooplankton from the upper layer (0–200 m) was more negative than that of the fishes (−22.3 to−21.3h). Two fishes,Melanolagus bericoidesof group 3 and Stomias nebulosus of group 5, were in breeding mode. These fishes had the most negativeδ13Cbulk of all studied fish species (−21.3h). The migrant planktivorous fishes had the largest ranges of δ13Cbulk (−21 to−20h). The other groups showed some overlap inδ13Cbulk(Figure 3A).
TABLE 3 |Lipids and isotopes [lipids % of dry mass (DM)],δ13Cbulk(h),δ13Cextraction(h),δ15N (h), and fatty acids (% of total fatty acids) in fish groups.
Group (number of samples) 1 (10) 2 (5) 3 (9) 4 (7) 5 (15)
Lipids (% DM) 34.6±1.5 24.5±1.7 28.9±0.6 24.8±2.1 25.3±2.4
δ13Cbulk(h) −20.5±0.3 −19.3±0.2 −20.4±0.6 −19.2±0.3 −19.5±0.6
δ13Cextraction(h) −19±0.3 −18.9±0.3 −18.5±0.2 −18.7±0.2 −18.4±0.3
δ15N (h) 8.6±0.4 9.5±0.5 10.4±0.2 10.5±0.2 10.3±0.3
Fatty acids (%)
14:0 1.9±0.8 1.0±0.1 3.5±0.6 1.8±0.5 1.4±0.3
16:0 25.3±2.6 21.8±2.1 21.6±0.6 23.5±0.5 20.6±1.1
16:1n−7 3.5±0.8 2.4±0.1 4.0±0.2 2.9±0.6 2.9±0.9
17:0 1.5±0.4 0.8±0.1 2.4±0.4 0.8±0.1 0.7±0.1
18:0 7.0±1.3 5.3±0.2 5.9±1.1 5.0±0.6 5.2±0.7
18:1n−9 12.5±1.6 15.0±0.3 25.6±2.1 16.8±2.5 17.4±1.7
18:1n−7 2.6±0.7 0.4±0.4 0.5±0.5 1.3±0.5 1.8±0.7
18:2n−6 1.6±0.2 1.0±0.2 0.7±0.1 1.1±0.3 0.8±0.2
20:1n−9 0.8±0.3 0.6±0.1 4.4±0.2 1.2±0.3 1.9±0.3
20:4n−6 3.0±0.7 3.8±0.5 3.3±0.6 3.4±0.5 3.4±0.7
20:5n−3 6.8±0.8 5.2±0.3 5.8±0.5 6.3±0.5 6.0±0.7
22:1n−9 0.3±0.1 0.2±0.1 2.5±0.1 0.4±0.2 0.7±0.2
22:5n−3 1.4±1.3 1.6±0.7 0.9±0.1 1.4±0.1 1.3±0.7
22:6n−3 30.9±1.1 39.5±2.8 18.2±1.7 35.1±2.4 36.9±2.0
FIGURE 3 |δ15N versusδ13C in different fish groups:(A)δ15N versusδ13Cbulk
(bulk–tissueδ13C);(B)δ15N versusδ13Cextraction(the lipid extractedδ13C) (group 1, migrant planktivorous fishes; group 2, migrant piscivorous fishes;
group 3, non-migrant planktivorous fishes; group 4, non-migrant piscivorous fishes; group 5, semi-migrant piscivorous fishes; special fishes:Melanolagus bericoidesof group 3 andStomias nebulosusof group 5 in breeding mode).
After lipid extraction, the microzooplankton and mesozoo- plankton showed large differences inδ13C. The migrant fishes had similarδ13C values, andδ13C of some non-migrant piscivorous fishes were also close to these values (−18.6 to−17.8h). The fishes of the other groups and those in breeding mode had values of−18.6 to−18.3h(Figure 3B).
Theδ13Cbulkand theδ13Cextractionvalues were clearly different (Figures 3A,B). After lipid extraction, the variation inδ13C of the fishes showed a linear relationship with the lipid content, and the lipid content and1δ13C (δ13Cextraction−δ13Cbulk) were highly significantly correlated (R2= 0.76,p<0.001;Figure 4).
The fishes in breeding mode, M. bericoides and S. nebulosus, with the highest lipid content were also considered in the regression analysis. Excluding the breeding fishes caused only small changes in the regression parameters (y = 0.08x−1.31, p<0.001,R2= 0.82).
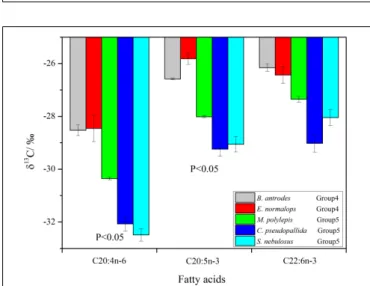
The δ13C values of individual FAs ranged from −32.8 to
−25.6h. Theδ13C values of the 20:4n−6 and 20:5n−3 FAs were significantly higher (p<0.05) in the non-migrant piscivorous
FIGURE 4 |The relationship between1δ13C (δ13Cextraction–δ13Cbulk) and lipid content in all fish groups (special fishes:M. bericoidesof group 3 and S. nebulosusof group 5 in breeding mode).
FIGURE 5 |Compound-specific13C of fatty acids (Bathygadus antrodesand Evermannella normalopsclassified as non-migrant piscivorous fishes;
Melamphaes polylepis,Cyclothone pseudopallidaandS. nebulosusclassified as semi-migrant piscivorous fishes).
fishes than the semi-migrant piscivorous fishes (Figure 5). There were more negativeδ13C values of 22:6n−3 in the semi-migrant piscivorous fishes than the non-migrant piscivorous fishes, but this variation was not significant. Groups 1 and 4 had similar δ13C values of the individual FAs, as well as groups 5 and 3 (Supplementary Table S1).
The migrant planktivorous fishes had δ15N values with the largest range (8–9.1h). The migrant piscivorous fishes had slightly higher values (8.9–10h). Highest δ15N values, larger than 10h, occurred in the other groups as well as in the breeding fishes, M. bericoides and S. nebulosus. The zooplankton had the lowestδ15N values (7.2–7.8h). Theδ15N of the microzooplankton changed very little in the upper layer, independent of day or night time (Table 4). However, δ15N of the mesozooplankton increased from day to night time in
TABLE 4 |δ15N of zooplankton in different layers and at different times.
Layer Time Size of zooplankton δ15N (mean±SD)
Upper layer Daytime Microzooplankton 7.5±0.3
(0–200 m) Nighttime Microzooplankton 7.3±0.3
Daytime Mesozooplankton 7.2±0.1
Nighttime Mesozooplankton 7.8±0.3
Middle layer Daytime Mesozooplankton 8.1±0.2∗
(400–600 m) Nighttime Mesozooplankton 9.1±0.1∗
∗p<0.05.
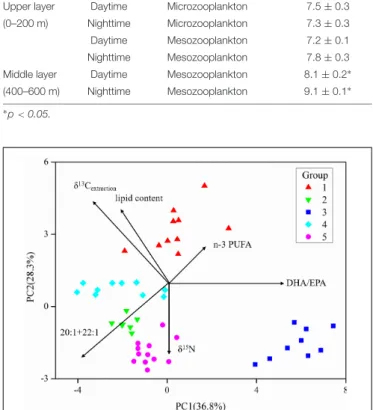
FIGURE 6 |Principal component analysis (PCA) of fatty acids and stable isotopes of the five groups of fishes (data in theSupplementary Material) (the length of vectors represents their contributions to axis).
the upper layer. The mesozooplankton in the middle layer showed the same tendency but being more variable (p<0.05) (Figures 3A,B).
Principal Component Analysis (PCA) Based on Fatty Acids and Stable Isotopes
The five fish groups were classified applying their FA and stable isotope data (Figure 6 and Supplementary Table S1). PC1, explaining the highest variance in the data set, separated group 3, the non-migrant planktivorous fishes, from the others. PC2 separated group 1, the migrant planktivorous fishes, from the others exhibiting higher lipid contents. There were higherδ15N values in group 2 than in group 1, but the values of group 2 were lower than those of groups 3, 4, and 5. In addition, theδ13Cbulk and theδ13Cextractionvalues of group 1 differed with those of other groups (Figures 3A,B). Compared to the other groups, group 3 had significantly higher proportions of the sum of 20:1 and 22:1 FAs and lower proportions ofn−3 PUFAs (p<0.01). Groups 4 and 5 were separated inFigure 6, but had similar stable isotope and FA compositions. This was due to differences in theδ13C of the individual FAs.
DISCUSSION
The Role of Lipids in Vertically Migrating Fishes
There were higher lipid contents in the migrant planktivorous fishes than in the fishes of the other groups which is consistent with previous reports (Saito and Murata, 1998;Petursdottir et al., 2008;Connan et al., 2010). The active vertical migration of these mesopelagic fishes is related to the structure of their myotomes;
they have a large proportion of lipid-rich, red muscle fibers.
When mesopelagic fishes move upward at a high cruising speed (moving to the surface layer within an hour) to search for food, the metabolic cost is mainly related to the requirements of the red muscle (Salvanes and Kristofersen, 2001). Therefore, the high lipid content helps the fishes to reach the high speed during vertical migration. Comparing the body density of mesopelagic fishes between day and night, that of migrant planktivorous fishes decreases during the daytime (when they discharge feces in the deep water layers) and increases during the night time (when active feeding begins) (Radchenko, 2007; Bernal et al., 2012). Thus, the high lipid content can supply energy for the mid-water activity of these fishes during the daytime (Lindstedt and Boyce, 1985; Busch and Mehner, 2011). Additionally, the high caloric content of lipids constitutes an energy–rich food for their predators, especially the migrant piscivorous fishes (Catul et al., 2010), which are able to passively migrate and follow the planktivorous fishes to feed on them (Choy et al., 2012). Thus, migrant planktivorous fishes occupy a trophic position between zooplankton and migrant piscivorous fishes.
The two fishes in breeding mode, M. bericoides and S. nebulosus, had a large amount of spawn in their bodies.
Their physiological status was probably the reason for the high lipid content. To sustain reproduction under very different food availabilities, the energetic composition of these fishes (high lipid content) is an important prerequisite (Derickson, 1976;van de Putte et al., 2006).
Trophic Interactions Illustrated by δ
13C
bulkand δ
13C
extractionStable isotopes have emerged as one of the primary means to examine the structure and dynamic of food webs (Layman et al., 2012). Compared to other biochemical compounds, lipids have a more negative δ13C value due to kinetic isotopic effects that occur during the conversion of pyruvate to acetyl coenzyme A during lipid synthesis (DeNiro and Epstein, 1977;Logan et al., 2008). Therefore,δ13Cbulkmight simply mirror the lipid content overshadowing theδ13C of the other food components.
To overcome this potential error, the effects of variation in lipid content on δ13C should be considered (Post et al., 2007; Hoffman and Sutton, 2010). Direct chemical extraction and mathematical normalization are the two main methods for lipid correction (Logan et al., 2008). Based on the mathematical normalization of our results, the relationship between lipid content and1δ13C showed a slope similar to the results ofPost et al. (2007), but the intercept differed considerably. The major difference was that most mesopelagic fishes in our study had lipid
contents of more than 20%, while most fishes studied by Post et al. (2007)had lower lipid contents. Therefore, mathematical normalization might not account for different lipid levels among different species and different areas (Hoffman and Sutton, 2010;
Kohlbach et al., 2016). To evidence more realistic feeding relationships, the mathematical normalization method needs to be verified by further studies.
In our study, the direct chemical extraction method was used to determine predator-prey relationships. Our results showed that the lipid content had an evident impact on δ13Cbulk; the higher the lipids, the more negative theδ13Cbulk. Thus,δ13Cbulk showed an inaccurate predator-prey relationship. After lipid extraction, migrant planktivorous fishes and migrant piscivorous fishes had similar δ13Cextraction values, demonstrating their predator-prey relationship in accordance withChoy et al. (2012).
The non-migrant fishes and semi-migrant fishes also had similar δ13Cextractionvalues reflecting similar feeding behavior, but there are no details known about the feeding habits of these fish species.
The Predator-Prey Relationships Among Zooplankton and Fishes
Stable isotopes of δ13Cextraction and δ15N data showed that microzooplankton and mesozooplankton in the upper layer were mixed diet sources to migrant planktivorous fishes. However, the middle layer zooplankton had similar δ15N values as the migrant planktivorous fishes. This is because these fishes exhibit active DVM, and their feeding habits in tropical and temperate waters have common alimentary patterns (Choy et al., 2012; Dypvik et al., 2012; Kaartvedt et al., 2012): they mainly feed on zooplankton, generally in the upper hundreds of meters at night, and exhibit preferences for large crustaceans, such as euphausiids (Bernal et al., 2012; Battaglia et al., 2014). In addition, the δ13Cextraction values also suggest that migrant planktivorous fishes slightly prefer mesozooplankton over microzooplankton. In contrast, small mesopelagic fishes mostly relied on microzooplankton items in the upper 200 m of the water column (Bernal et al., 2012); therefore, there might be a dietary shift from early stages to adulthood.
The δ15N values showed that the migrant planktivorous and piscivorous fishes had different trophic levels. The migrant piscivorous fishes are larger, but the migrant planktivorous fishes have higher lipid contents. Thus, compared to the piscivorous fishes, the smaller planktivorous fishes have a higher vertical migration speed (Busch and Mehner, 2011), whereas the piscivorous fishes exhibit passive DVM (Radchenko, 2007;
Catul et al., 2010), mainly feeding on small migrant planktivorous fishes (Choy et al., 2012;D’Elia et al., 2016). However, theδ15N enrichment of only 1hwas far below the trophic discrimination factor (TDF: the difference between the isotope composition of the tissue of a predator and its diet). The TDF is assumed to be 2.4hper trophic step across marine fishes (Vanderklift and Ponsard, 2003;Young et al., 2014). This difference has also been shown to occur in other fish species (Caut et al., 2009;Choy et al., 2012;Hussey et al., 2014). Therefore, the stable isotope ofδ15N might not accurately reflect the trophic position especially when the fish lived in more extreme environments.
Compared to the migrant piscivorous fishes, non-migrant planktivorous fishes had a higher δ15N and a less negative δ13Cextraction value; therefore, non-migrant planktivorous fishes were not a major diet of the migrant piscivorous fishes. In other studies, these fishes have been thought to be the dominant upper- trophic-level predators (Sutton and Hopkins, 1996;Radchenko, 2007). The migrant piscivorous fishes may also feed in the surface layer during night time and discharge feces in deep layers during daytime. Upper-layer zooplankton, migrant planktivorous fishes and migrant piscivorous fishes probably form a food chain, and the only small δ15N enrichment might be caused by low temperatures (Pusch et al., 2004;Choy et al., 2012). In the study area, the migrant fishes resided at a depth of 450 m during the daytime, where the water temperature can be lower than 4◦C.
Low temperatures can result in a low metabolic rate and slow protein turnover in mesopelagic fishes (Choy et al., 2012).
The large changes of δ15N values in the middle layer mesozooplankton support that the mesozooplankton also performs DVM, feeds in the upper layer during the night time and excretes at depth during the daytime (Brierley, 2014;Giering et al., 2014). The DVM of zooplankton is the largest daily migration by biomass in the oceans (Last et al., 2016). When these organisms migrate to the middle layer, isotopic fractionation associated with heterotrophic degradation might affect its δ15N by increasing with depth (Hannides et al., 2013). In addition, the active migration of zooplankton from deep layers to middle layers also leads to 15N enrichment (Bode and Hernández- León, 2018). Thus, the trophic baseline changes, which results in higherδ15N in the non-migrant planktivorous fishes than in the migrant piscivorous fishes (Bollens et al., 2011). Compared to the other groups, the non-migrant planktivorous fishes had lower n-3 PUFAs, which may indicate that phytoplankton were a less important food item (Saito and Aono, 2014). However, these fishes had a higher proportion of 20:1 and 22:1 FAs than other groups, which mainly originate from zooplankton (Kattner and Hagen, 2009;Stowasser et al., 2009), demonstrating that the non-migrant planktivorous fishes feed on zooplankton.
Considering the 1h enrichment of δ15N and the FA signals, the mesozooplankton in the middle water might be a main food sources for the non-migrant planktivorous fishes (Dypvik et al., 2012;Battaglia et al., 2014). The highδ15N of the middle-layer zooplankton also verifies that the migrant planktivorous fishes mainly feed on the upper-layer zooplankton at night, as described above (Pusch et al., 2004;Cavallaro et al., 2016).
Lipids (FAs as trophic markers) might depict trophic relationships better than isotopes (Connan et al., 2007;Cherel et al., 2010). A high DHA/EPA ratio can be used to estimate carnivory and trophic position (Dalsgaard et al., 2003; Wan et al., 2010) which was found for the non-migrant piscivorous and semi-migrant piscivorous fishes, reflecting their carnivorous behavior (Stowasser et al., 2009). Compared to the non-migrant planktivorous fishes, these piscivorous fishes had higher n−3 PUFAs; therefore, primary products have an important impact on feeding behavior (Saito and Aono, 2014). Since the non- migrant planktivorous fishes had a very different FA composition, compared to the other fishes, the zooplankton, undergoing DVM, seem to be a less important dietary component of
the non-migrant and semi-migrant piscivorous fishes, but the migrant planktivorous fishes were likely a major prey item for both groups. However, both groups of piscivorous fishes had stable isotopes similar to those of non-migrant planktivorous fishes, which are also important food items. Thus, the stable isotope and FA composition results were inconsistent. According to Gloeckler (2016), fishes living in mesopelagic waters might feed on migrant planktivorous fishes. Unfortunately, there is little information on the diets of non-migrant fishes (Battaglia et al., 2014;Gloeckler, 2016). Due to the limitations of stable isotopes, FAs might better elucidate the actual diets of non-migrant and semi-migrant piscivorous fishes.
The non-migrant and semi-migrant piscivorous fishes might have different diets reflected by the CSIA data. The non-migrant piscivorous fishes and migrant planktivorous fishes had similar values, as well as the semi-migrant piscivorous fishes and non- migrant planktivorous fishes. Thus, the migrant planktivorous fishes (migrating from 400 to 600 m) might be a food source for the non-migrant piscivorous fishes (Gloeckler, 2016), and the semi-migrant piscivorous fishes likely feed on the non-migrant
planktivorous fishes. However, more research is needed to verify these results.
The Impact of the Diversity of Mesopelagic Fishes on Global Carbon Budgets
Most mesopelagic fishes exhibit DVM patterns, but some species are considered non-migratory fishes (Catul et al., 2010). There are marked differences in the proportions of migrating fishes between regions, ranging from 20% in the Indian Ocean to 90% in the Eastern Pacific (Klevjer et al., 2016). In our study area, the migrating proportion is approximately 50%
based on catch data. Two previous studies quantified the active transport by vertically migrating myctophids, which could account for 8% (Hidaka et al., 2001) and 15–28%
(Davison et al., 2013) of passively sinking particulate organic C. However, recent acoustic observations have shown that the mesopelagic fish biomass could be clearly larger than previously estimated (Irigoien et al., 2014), which would
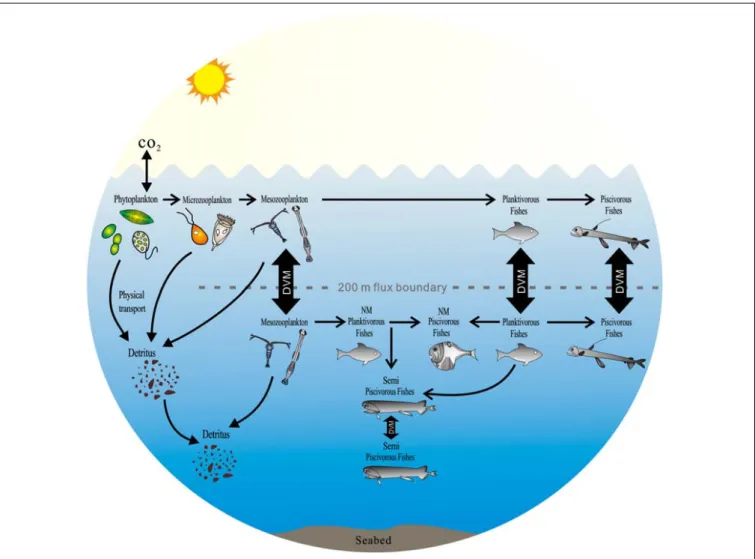
FIGURE 7 |The potential impact of the diversity of mesopelagic species on global carbon budgets in the ocean (DVM, diel vertical migration; NM, non-migration) [modify fromSutton and Hopkins (1996),Catul et al. (2010),Choy et al. (2012),Battaglia et al. (2014),Trueman et al. (2014)].
significantly increase the contributions to the C flux by vertically migrating fishes (Hudson et al., 2014).
In this study, five groups of mesopelagic fishes with diverse migrating and feeding behaviors were investigated, and this complex diversity led them to play different roles in the ‘biological pump.’ The migrant planktivorous and piscivorous fishes make a major contribution to the ‘biological pump’ (Brierley, 2014).
These communities play an integral role in C sequestration and are fundamental to estimating global C budgets (Hudson et al., 2014). The other fish groups, the non-migrant planktivorous and piscivorous fishes and semi-migrant piscivorous fishes, also contribute indirectly to active C transport. The non-migrant planktivorous fishes feed on zooplankton undertaking DVM.
Thus, the actively vertically transported organic matter by zooplankton remains in the mesopelagic layer. This process will also sequester C and act as a sink in the global C cycle (Hern´αndez-León et al., 2010; Jonasdottir et al., 2015).
The non-migrant piscivorous fishes interact trophically with the migrant planktivorous fishes, and their relationship also accelerates C sequestration in the mesopelagic layer. The semi- migrant piscivorous fishes prey on the planktivorous fishes near the mesopelagic layer and transport organic matter into the deeper ocean interior, thus supplying nutrients to benthic and bentho-pelagic demersal fish communities (Trueman et al., 2014).
The magnitude of the total C transport by mesopelagic fishes is noticeable in comparison with the estimated entire particulate organic matter flux (Radchenko, 2007). C transport by mesopelagic fishes might account for a larger proportion of exported C at lower mesopelagic and bathypelagic depths, which has often been neglected when estimating global C budgets (Hudson et al., 2014). In view of the diversity of mesopelagic fishes revealed by our study, their impact on global C budgets should be more considered in the future.
SUMMARY AND FUTURE RESEARCH
The combination of FAs and stable isotopes characterized the diversity and potential feeding behavior of mesopelagic fishes (Figure 7). The migrant planktivorous fishes mainly feed in the surface layer at night and move to the mesopelagic layer during the day (Catul et al., 2010). Their behavior builds a bridge between photosynthates and piscivorous fishes in the mesopelagic layer. The migrant piscivorous fishes, however, conduct a passive vertical migration. Their migration is linked to the migrant planktivorous fishes (Catul et al., 2010;Choy et al., 2012). In the mesopelagic layer, the non-migrant planktivorous
fishes get diet sources from zooplankton moving from surface or deep layer (Battaglia et al., 2014;Bode and Hernández-León, 2018). Both non-migrant and semi-migrant piscivorous fishes can prey on different planktivorous fishes (Sutton and Hopkins, 1996;Catul et al., 2010). But there are some differences in their diet composition.
Future work based on protein and lipid metabolisms should be conducted to indicate the diets of mesopelagic fishes, and multivariate biomarker methods should be combined to determine the diversity of mesopelagic fishes from extreme environments. However, there is a major lack of knowledge regarding the global composition and diversity of mesopelagic fishes as well as their function in the oceanic ecosystem (Robison, 2009;St. John et al., 2016). This diversity makes the ‘biological pump’ more complex than previously thought. Thus, studying the variability of biological behaviors of mesopelagic fishes is important to re-evaluate the role of mesopelagic fishes in global C budgets.
AUTHOR CONTRIBUTIONS
FW, YW, ZC, JZ, SZ, and GK contributed to conception and design of the study. FW and GZ organized the database. FW, YW, and GK performed the statistical analysis. FW and YW wrote the first draft of the manuscript. ZC, GZ, JZ, and SZ wrote the sections of the manuscript. All authors contributed to manuscript revision, read, and approved the submitted version.
FUNDING
This study was supported by the National Key Program for Basic Research (973 program, Grant No. 2014CB441502).
ACKNOWLEDGMENTS
We greatly appreciate help of the captain and crew of the ‘Nan Feng’ investigation ship. We also thank M. Graeve and V. Adrian for analyses at AWI.
SUPPLEMENTARY MATERIAL
The Supplementary Material for this article can be found online at: https://www.frontiersin.org/articles/10.3389/fmars.
2018.00522/full#supplementary-material
REFERENCES
Battaglia, P., Esposito, V., Malara, D., Falautano, M., Castriota, L., and Andaloro, F.
(2014). Diet of the spothead lanternfishDiaphus metopoclampus(Cocco, 1829) (Pisces: Myctophidae) in the central Mediterranean Sea.Ital. J. Zool.81, 530–
543. doi: 10.1080/11250003.2014.948500
Bernal, A., Olivar, M. P., Fernández, and De Puelles, M. L. (2012). Feeding patterns of Lampanyctus pusillus (Pisces: Myctophidae) throughout its ontogenetic development.Mar. Biol.160, 81–95. doi: 10.1007/s00227-012-2064-9
Bode, A., and Hernández-León, S. (2018). Trophic diversity of plankton in the epipelagic and mesopelagic layers of the tropical and equatorial atlantic determined with stable isotopes.Diversity10:48. doi: 10.3390/d10020048 Bollens, S. M., Breckenridge, J. K., Vanden Hooff, R. C., and Cordell, J. R. (2011).
Mesozooplankton of the lower San Francisco Estuary: spatio-temporal patterns, ENSO effects and the prevalence of non-indigenous species.J. Plank. Res.33, 1358–1377. doi: 10.1093/plankt/fbr034
Brierley, A. S. (2014). Diel vertical migration. Curr. Biol. 24, R1074–R1076.
doi: 10.1016/j.cub.2014.08.054
Budge, S. M., Aucoin, L. R., Ziegler, S. E., and Lall, S. P. (2016). Fractionation of stable carbon isotopes of tissue fatty acids in Atlantic pollock (Pollachius virens).
Ecosphere7:e01437. doi: 10.1002/ecs2.1437
Busch, S., and Mehner, T. (2011). Size-dependent patterns of diel vertical migration: smaller fish may benefit from faster ascent.Behav. Ecol.23, 210–217.
doi: 10.1093/beheco/arr177
Catul, V., Gauns, M., and Karuppasamy, P. K. (2010). A review on mesopelagic fishes belonging to family Myctophidae. Rev. Fish Biol. Fish. 21, 339–354.
doi: 10.1007/s11160-010-9176-4
Caut, S., Angulo, E., and Courchamp, F. (2009). Variation in discrimination factors (115N and113C): the effect of diet isotopic values and applications for diet reconstruction.J. Appl. Ecol.46, 443–453. doi: 10.1111/j.1365-2664.2009.
01620.x
Cavallaro, M., Ammendolia, G., Andaloro, F., and Battaglia, P. (2016). First record of the mesopelagic fishDiaphus dumerilii(Bleeker, 1856) in the Mediterranean Sea.Mar. Biodivers.47, 585–588. doi: 10.1007/s12526-016-0492-3
Cherel, Y., Fontaine, C., Richard, P., and Labatc, J.-P. (2010). Isotopic niches and trophic levels of myctophid fishes and their predators in the Southern Ocean.
Limnol. Oceanogr.55, 324–332. doi: 10.4319/lo.2010.55.1.0324
Choy, C. A., Davison, P. C., Drazen, J. C., Flynn, A., Gier, E. J., Hoffman, J. C., et al.
(2012). Global trophic position comparison of two dominant mesopelagic fish families (Myctophidae, Stomiidae) using amino acid nitrogen isotopic analyses.
PLoS One7:e50133. doi: 10.1371/journal.pone.0050133
Choy, C. A., Popp, B. N., Hannides, C. C. S., and Drazen, J. C. (2015). Trophic structure and food resources of epipelagic and mesopelagic fishes in the North Pacific Subtropical Gyre ecosystem inferred from nitrogen isotopic compositions.Limnol. Oceanogr.60, 1156–1171. doi: 10.1002/lno.10085 Choy, C. A., Portner, E., Iwane, M., and Drazen, J. C. (2013). Diets of five important
predatory mesopelagic fishes of the central North Pacific.Mar. Ecol. Progr. Ser.
492, 169–184. doi: 10.3354/meps10518
Connan, M., Cherel, Y., and Mayzaud, P. (2007). Lipids from stomach oil of procellariiform seabirds document the importance of myctophid fish in the Southern Ocean.Limnol. Oceanogr.52, 2445–2455. doi: 10.4319/lo.2007.52.6.
2445
Connan, M., Mayzaud, P., Duhamel, G., Bonnevie, B. T., and Cherel, Y. (2010).
Fatty acid signature analysis documents the diet of five myctophid fish from the Southern Ocean. Mar. Biol.157, 2303–2316. doi: 10.1007/s00227-010- 1497-2
Dalsgaard, J., St. John, M. S., Kattner, G., Müller-Navarra, D., and Hagen, W.
(2003). Fatty acid trophic markers in the pelagic marine environment.Adv.
Mar. Biol.46, 225–340. doi: 10.1016/S0065-2881(03)46005-7
Davison, P. C., Checkley, D. M., Koslow, J. A., and Barlow, J. (2013). Carbon export mediated by mesopelagic fishes in the northeast Pacific Ocean.Prog. Oceanogr.
116, 14–30. doi: 10.1016/j.pocean.2013.05.013
D’Elia, M., Warren, J. D., Rodriguez-Pinto, I., Sutton, T. T., Cook, A., and Boswell, K. M. (2016). Diel variation in the vertical distribution of deep-water scattering layers in the Gulf of Mexico.Deep Sea Res. Part I Oceanogr. Res. Papers115, 91–102. doi: 10.1016/j.dsr.2016.05.014
DeNiro, M. J., and Epstein, S. (1977). Mechanism of carbon isotope fractionation associated with lipid synthesis. Science197, 261–263. doi: 10.1126/science.
327543
Derickson, W. K. (1976). Lipid storage and utilization in reptiles.Am. Zool.16, 711–723. doi: 10.1093/icb/16.4.711
Dypvik, E., Røstad, A., and Kaartvedt, S. (2012). Seasonal variations in vertical migration of glacier lanternfish,Benthosema glaciale.Mar. Biol.159, 1673–1683.
doi: 10.1007/s00227-012-1953-2
Eder, K. (1995). Gas chromatographic analysis of fatty acid methyl esters.
J. Chromatogr. B Biomed. Sci. Appl.617:18. doi: 10.1016/0378-4347(95)00142-6 Folch, J., Lees, M., and Sloane-Stanley, G. H. (1957). A simple method for the isolation and purification of total lipids from animal tissues.J. Biol. Chem.226, 497–509.
Fry, B. (1988). Food web structure on Georges Bank from stable C. N, and S isotopic compositions.Limnol. Oceanogr.33, 1182–1190. doi: 10.4319/lo.1988.33.5.1182 Giering, S. L., Sanders, R., Lampitt, R. S., Anderson, T. R., Tamburini, C., Boutrif, M., et al. (2014). Reconciliation of the carbon budget in the ocean’s twilight zone.Nature507, 480–483. doi: 10.1038/nature13123
Gillikin, D. P., Lorrain, A., Jolivet, A., Kelemen, Z., Chauvaud, L., and Bouillon, S.
(2017). High-resolution nitrogen stable isotope sclerochronology of bivalve
shell carbonate-bound organics. Geochim. Cosmochim. Acta 200, 55–66.
doi: 10.1016/j.gca.2016.12.008
Gladyshev, M. I., Makhutova, O. N., Kravchuk, E. S., Anishchenko, O. V., and Sushchik, N. N. (2016). Stable isotope fractionation of fatty acids ofDaphnia fed laboratory cultures of microalgae.Limnol. – Ecol. Manage. Inland Waters 56, 23–29.
Gladyshev, M. I., Sushchik, N. N., Kalachova, G. S., and Makhutova, O. N. (2012).
Stable isotope composition of fatty acids in organisms of different trophic levels in the Yenisei River.PLoS One7:e34059. doi: 10.1371/journal.pone.0034059 Gloeckler, K. (2016).Amino Acid- Compound Specific Stable Isotope Analysis
of Micronekton Around Hawaii reveals Suspended Particles are an Important Nutritional Source in the Meso/Bathypelagic. Manoa: University of Hawaii at Manoa.
Hannides, C. C. S., Popp, B. N., Choy, C. A., and Drazen, J. C. (2013). Midwater zooplankton and suspended particle dynamics in the North Pacific Subtropical Gyre: a stable isotope perspective.Limnol. Oceanogr.58, 1931–1946. doi: 10.
4319/lo.2013.58.6.1931
Hernαndez-León, S., Franchy, G., Moyano, M., Menéndez, I., Schmoker, C., and´ Putzeys, S. (2010). Carbon sequestration and zooplankton lunar cycles: could we be missing a major component of the biological pump?Limnol. Oceanogr.
55, 2503–2512. doi: 10.4319/lo.2010.55.6.2503
Hidaka, K., Kawaguchi, K., Murakami, M., and Takahashi, M. (2001). Downward transport of organic carbon by diel migratory micronekton in the western equatorial Pacific: its quantitative and qualitative importance.Deep Sea Res. Part I Oceanogr. Res. Papers48, 1923–1939. doi: 10.1016/S0967-0637(01)00003-6 Hoffman, J. C., and Sutton, T. T. (2010). Lipid correction for carbon stable isotope
analysis of deep-sea fishes.Deep Sea Res. Part I Oceanogr. Res. Papers57, 956–964. doi: 10.1016/j.dsr.2010.05.003
Hudson, J. M., Steinberg, D. K., Sutton, T. T., Graves, J. E., and Latour, R. J.
(2014). Myctophid feeding ecology and carbon transport along the northern Mid-Atlantic ridge.Deep Sea Res. Part I Oceanogr. Res. Papers93, 104–116.
doi: 10.1016/j.dsr.2014.07.002
Hussey, N. E., Macneil, M. A., Mcmeans, B. C., Olin, J. A., Dudley, S. F., Cliff, G., et al. (2014). Rescaling the trophic structure of marine food webs.Ecol. Lett.17, 239–250. doi: 10.1111/ele.12226
Irigoien, X., Klevjer, T. A., Røstad, A., Martinez, U., Boyra, G., Acuña, J. L., et al.
(2014). Large mesopelagic fishes biomass and trophic efficiency in the open ocean.Nat. Commun.5:ncomms4271.
Jonasdottir, S. H., Visser, A. W., Richardson, K., and Heath, M. R. (2015). Seasonal copepod lipid pump promotes carbon sequestration in the deep North Atlantic.
Proc. Natl. Acad. Sci. U.S.A. 112, 12122–12126. doi: 10.1073/pnas.151211 0112
Kaartvedt, S., Staby, A., and Aksnes, D. L. (2012). Efficient trawl avoidance by mesopelagic fishes causes large underestimation of their biomass.Mar. Ecol.
Prog. Ser.456, 1–6. doi: 10.3354/meps09785
Kattner, G., and Hagen, W. (2009). “Lipids in marine copepods: latitudinal characteristics and perspective to global warming,” in Lipids in Aquatic Ecosystems,eds M. T. Arts, M. T. Brett, M. J. Kainz (New York, NY: Springer), 257–280.
Klevjer, T. A., Irigoien, X., Rostad, A., Fraile-Nuez, E., Benitez-Barrios, V. M., and Kaartvedt, S. (2016). Large scale patterns in vertical distribution and behaviour of mesopelagic scattering layers.Sci. Rep.6:19873. doi: 10.1038/srep19873 Klevjer, T. A., Torres, D. J., and Kaartvedt, S. (2012). Distribution and diel vertical
movements of mesopelagic scattering layers in the Red Sea.Mar. Biol.159, 1833–1841. doi: 10.1007/s00227-012-1973-y
Kohlbach, D., Graeve, M., A. Lange, B., David, C., Peeken, I., and Flores, H. (2016).
The importance of ice algae-produced carbon in the central Arctic Ocean ecosystem: food web relationships revealed by lipid and stable isotope analyses.
Limnol. Oceanogr.61, 2027–2044. doi: 10.1002/lno.10351
Kristensen, E., Lee, S. Y., Mangion, P., Quintana, C. O., and Valdemarsen, T.
(2017). Trophic discrimination of stable isotopes and potential food source partitioning by leaf-eating crabs in mangrove environments.Limnol. Oceanogr.
62, 2097–2112. doi: 10.1002/lno.10553
Last, K. S., Hobbs, L., Berge, J., Brierley, A. S., and Cottier, F. (2016). Moonlight drives ocean-scale mass vertical migration of zooplankton during the arctic winter.Curr. Biol.26, 244–251. doi: 10.1016/j.cub.2015.11.038
Layman, C. A., Araujo, M. S., Boucek, R., Hammerschlag-Peyer, C. M., Harrison, E., Jud, Z. R., et al. (2012). Applying stable isotopes to examine food-web structure: