Bachelor-Thesis im Fach Biologie Hochschule Bremen, Fakultät 5
Bremen
in Kooperation mit dem
Alfred-Wegener-Institut Helmholtz-Zentrum für Polar- und Meeresforschung/
Biologische Anstalt Helgoland
Die Auswirkung von Umweltveränderungen auf die Plastizität von gemäßigtem Meeresplankton
Erstprüfer: Prof. Dr. Heiko Brunken Zweitprüfer: Dr. Nelly Tremblay
Datum: 02.05.2019
Hannes Seidel Matrikel Nr.: 5002108
ISTAB, 17. Jahrgang
Bachelor-thesis in the subject Biology Hochschule Bremen, Faculty 5
Bremen
in cooperation with
Alfred-Wegener-Institut Helmholtz-Zentrum für Polar- und Meeresforschung/
Biologische Anstalt Helgoland
The effect of environmental changes on temperate marine plankton plasticity
First examiner: Prof. Dr. Heiko Brunken Second examiner: Dr. Nelly Tremblay
Date: 02.05.2019
Hannes Seidel Matrikel Nr.: 5002108
ISTAB, 17th year
Table of Contents
List of Abbreviations ... 1
Abstract... 2
Zusammenfassung ... 3
1. Introduction ... 4
2. Hypothesis ... 8
3. Methodology ... 8
3.1 Plankton sampling ... 8
3.2 Experimental design ... 9
3.3. Abiotic parameters ...11
3.4. Routine metabolic rate measurements ...12
3.5 Oxidative stress indicators ...14
3.6 Data treatment and analysis...15
4. Results ...16
4.1 Species composition ...16
4.2 Abiotic parameters ...17
4.3 Routine metabolic rates ...18
4.4 Oxidative stress indicators ...18
5. Discussion ...21
1. Does short-term exposure to CO2 concentrations predicted by the 2100 climate scenario have a negative impact on the organism’s oxidative status? ...21
2. Does a higher temperature negatively affect the oxidative status by increasing ROS as a by-product of increased respiration? ...22
3. Will higher CO2 concentrations decrease the plasticity of temperate marine plankton to increasing temperature? ...22
General considerations ...24
References ...25
Acknowledgments ...28
Eigenständigkeitserklärung ...28 Appendix ...
1 List of Abbreviations
ADP adenosine diphosphate
ANOVA analysis of variance
ATP adenosine triphosphate
CAT catalase
CO2 carbon dioxide
DNA deoxyribonucleic acid
DW dry weight
ETS electron transport system
GSH reduced glutathione
GST glutathione S-transferase
IBR integrated biomarker response
IPCC Intergovernmental Panel on Climate Change
MDA malondialdehyde
MO2 oxygen consumption
pCO2 partial pressure of carbon dioxide
pH potential of hydrogen
ppm parts per million
RMR routine metabolic rate ROS reactive oxygen species
SOD superoxide dismutase
TA total alkalinity
2 Abstract
Acidification, deoxygenation and rising water-temperatures in our oceans are becoming an omnipresent issue for most marine organisms. Abiotic factors play an important role in the trophic system and slight changes might already have significant effects on various trophic levels. Not only larger animals like fish and marine mammals suffer from temperature and pH-level fluctuations, but also smaller organisms such as plankton are challenged coping with them. These alterations may affect the organism’s fitness and ability to adapt to certain environmental changes. On a cellular level this effect is expressed as a stress response, which can have an extensive impact on the organism’s metabolism and oxidative state (generation of reactive oxygen species (ROS)). The overall aim of this thesis was to understand how a temperate plankton community copes with future multi-stressors in terms of plasticity as a result of an increasing temperature (global warming) and Carbon dioxide (CO2) concentrations (acidification) of the ocean. Field samples of plankton, mostly containing copepods of the genus Acartia sp., were collected with a 150 µm plankton net at the Helgoland Roads and shortly after exposed to different treatment-combinations of CO2
(450, 800, 1000 ppm) and temperature (5, 7, 10, 12, 15 °C) for seven days. Metabolism and four different oxidative stress indicators were analysed to determine oxidative status and possible damages of planktonic tissue and cells. Routine metabolic rates (RMR) of different CO2 treatments were very high in variability at the acclimation temperatures 10 and 12 °C, they were lower and more distinct at 7 and 15 °C and organisms had very similar RMR at 5
°C. The integrated biomarker response (IBR) model demonstrated that plankton for all CO2
concentrations were affected negatively when temperature increased. At the highest temperature, exposed organisms of the higher CO2 concentrations still responded with antioxidant defence but suffered oxidative damage to lipids. According to achieved results, it is assumed that temperate plankton of the North Sea can cope with the acidification that is predicted by the 2100 climate scenario (IPCC 2007) until reaching a certain temperature. But temperature alone can be considered a stressor and in addition to higher CO2
concentrations, organisms’ antioxidant capacity is outbalanced by lipid damage (oxidative stress), which can be presumed to have a significant impact on their homeostasis. Future studies realizing similar experimental setups as in this pilot study should improve the significance of their results by implementing repetitive collection of data.
3 Zusammenfassung
Versauerung, Sauerstoffentzug und steigende Wassertemperaturen in unseren Ozeanen werden zu einer allgegenwärtigen Problematik für die meisten Meeresorganismen.
Abiotische Faktoren spielen im trophischen System eine wichtige Rolle und geringe Veränderungen in diesem könnten schon erhebliche Folgen in verschiedenen trophischen Ebenen bewirken. Nicht nur größere Tiere wie Fische und Meeressäuger leiden unter Temperatur und pH Schwankungen, sondern auch kleinere Organismen wie Plankton haben schwierige Zeiten damit zurecht zu kommen. Diese Veränderungen könnten sich auf die Fitness und Anpassungsfähigkeit des Organismus zu bestimmten Umweltveränderungen auswirken. Dieser Effekt wird auf zellulärer Ebene durch eine Stressreaktion geäußert und kann einen weitreichenden Einfluss auf Metabolismus und oxidativen Zustand (Erzeugung von reaktiven Sauerstoffspezies (ROS)) haben. Das Gesamtziel dieser Abschlussarbeit war es, zu verstehen wie eine gemäßigte Planktongemeinschaft, infolge von steigenden Temperaturen (globale Erwärmung) und Kohlenstoffdioxid (CO2) Konzentrationen (Versauerung) im Meer, mit mehreren künftigen Stressfaktoren hinsichtlich auf ihrer Plastizität zurechtkommt. Feldproben von Plankton, größtenteils Ruderfußkrebse der Gattung Acartia sp. beinhaltend, wurden mit einem 150 µm Plankton Netz in der Helgoland Reede gefangen und kurz danach Kombinationen verschiedener CO2 Konzentrationen (450, 800, 1000 ppm) und Temperaturen (5, 7, 10, 12, 15 °C) für 7 Tage ausgesetzt. Stoffwechsel und vier verschiedene Indikatoren für oxidativen Stress wurden untersucht um den oxidativen Zustand und möglichen Schaden an planktonischem Gewebe und Zellen festzustellen. Stoffwechsel-Grundumsätze (RMR) aller CO2 Behandlungen hatten eine sehr hohe Variabilität für die Akklimatisierung bei 10 und 12 °C, wobei RMR niedriger und ausgeprägter bei 7 und 15 °C und sehr ähnlich zwischen allen Konzentrationen bei 5 °C waren. Das Modell der integrierten Biomarker Reaktion zeigt, dass das Plankton aller CO2
Konzentrationen bei Erhöhung der Temperatur negativ beeinflusst wird. Mit der höchsten CO2 Konzentration behandelte Organismen zeigten bei maximaler Akklimatisation immer noch eine Reaktion des Antioxidantien-Abwehrsystems, erlitten aber oxidativen Schaden an ihren Lipiden. Zufolge erlangter Resultate wird angenommen, dass gemäßigtes Meeresplankton in der Nordsee mit prognostizierter Versauerung laut dem Klima Szenario 2100 (IPCC) bis zu einer bestimmten Temperatur zurechtkommen kann. Jedoch kann Temperatur einzig und allein als Stressfaktor betrachtet werden und zusätzlich zu steigenden CO2 Konzentrationen im Meer gerät die antioxidative Kapazität der Organismen aus dem Gleichgewicht durch Schäden an Lipiden. Es wird vermutet, dass dies einen erheblichen Einfluss auf die Homöostase des Organismus hat. Künftige Studien die mit einem ähnlichen
4 experimentellen Aufbau wie in dieser Pilotstudie arbeiten, sollten die Aussagekraft ihrer Resultate steigern, indem eine Reihe von gleichen Experimenten durchgeführt wird.
1. Introduction
The consequences of climate change affect the goods and services provided by marine ecosystems, and the way we need to manage them sustainably. Currently, there is a need to develop models that integrate stress responses of marine organisms to climate change and their interactions with other anthropogenic impacts such as pollution and fisheries.
Phytoplankton, micro- and mesozooplankton taxa represent good biological models to understand the cell stress mechanisms that allow plasticity and resilience modulated by trophic interactions. Phytoplankton, micro- and mesozooplankton taxa are: 1) available all year; 2) the main focus of many long survey records allowing the match of current responses with past conditions, and better predictions for the future; 3) small in size, which facilitates multi-stressors experimental design and replication; and 4) part of a complex community, which allow a larger overview of the system vulnerability and resilience. Further, all observations resulting from plankton stress responses could be integrated in ecosystem models to extrapolate the effects into the higher trophic levels (macrozooplankton, fish, marine mammals, etc.). Plasticity is defined as the ability of a single genotype (individual) to respond to a different environment by changing its physiology, morphology, life-history or behaviour in order to cope with environmental changes (Engel et al., 2011). Ocean acidification is one of the main contributors to climate change and is driven by the absorption of atmospheric CO2, which is then decreasing the Oceans pH. A lower pH is potentially affecting early developmental stages of invertebrates (Kurihara, 2008), but it appears that only very high CO2 concentrations (2000+ ppm) have a presumably negative impact on copepod reproduction (Kurihara & Ishimatsu, 2008).
This list of advantages may explain why the effect of climate change (warming, de- oxygenation and acidification) is studied increasingly in those taxa, using several levels of a single stressor and/or a combination of stressors. Using a combination of stressors is more representative of the reality, but still faces many obstacles at pointing out which mechanisms are involved in the stress response. Indeed, depending of the organisation level investigated and the duration of exposure to stressors, the stress responses are often masked by trophic interactions (nutrient assimilation, food quality, and predation efficiency). In other words, as vulnerability and energy requirement of both prey and predator within the stressful condition could be altered at the same time, it is hard to underpin which mechanisms are driving the acclimation of a specific taxa or life-stage over the rest of the community or which are falling
5 first and explain the low survival of a specific taxa. This was the conclusion brought by Hammill et al. (2018) who was unable to demonstrate if the greater shifts observed in zooplankton community structure and the reduction of calanoid copepods in a treatment combining acidification and top-down effect by the box-jellyfish Carybdea rastoni was due to:
1) copepods less fitted to escape the predator, 2) a higher energy requirement of predators or 3) both.
The Helgoland Roads Time series in the German North Sea aims this research output among others, with its impressive pelagic data set of phytoplankton, salinity, Secchi and nutrient analyses recorded since 1962, and with zooplankton since 1975 (Wiltshire et al., 2010). In the last decade, research efforts dealing with climate change effects on the key species of this ecosystem have increased. It was shown that more acidic pH during 25 days decreased the quality of food (carbon: nutrients ratio), which resulted in lower growth of the heterotrophic dinoflagellate Oxyrrhis marina to metabolize the higher carbon contained in the food when exposed to the most extreme conditions (Meunier et al., 2017). An elaborated experimental design (interaction of warming, hypoxia and pH) has been used to assess the tolerance of the ephyral life stage of the moon jellyfish Aurelia aurita, an invasive species of the ecosystem, forecasted to increase in abundance under climate change scenarios (Algueró-Muñiz et al., 2016). The authors demonstrated that the species was relatively robust against all stressors for seven days looking at their carbon content, swimming activity and mortality. Here, food uptake was not considered (animals were starved) and growth (carbon content) was negatively altered only in the more extreme conditions (Algueró-Muñiz et al., 2016), which were beyond the range predicted by the Intergovernmental Panel on Climate Change (IPCC report 2007). As seen with these two organism models, food quality, time of exposure and the level of organization investigated may have a say in the understanding of the organism’s response to stress.
It is known that all trophic levels in our ocean play an important role to keep the balance between production and respiration, which usually happens in the upper layers of the water column where several types of taxa are involved (bacteria, plankton, fish and marine mammals). This balance can only be maintained at steady state without high fluctuations of abiotic parameters and food availability. When an organism is consuming oxygen, organic carbon is oxidized and dioxide carbon (CO2) is released while they are provided with energy. Production is the opposite process, where primary producers take up CO2 and fix carbon into organic compounds using the energy of sunlight (Spilling et al., 2016). As temperature affects oxygen consumption, the thermal sensitivity of mitochondria (Lemieux et al., 2010; Pichaud et al., 2011) may represents the fundamental limitation
6 impeding multiple biological functions such as consumption rate, growth, development, locomotion, and reproduction above a certain temperature threshold (Gillooly et al., 2001;
Brown et al., 2004; Guderley, 2004; Savage et al., 2004; Le Lann et al., 2011). Mitochondria operate oxidative phosphorylation, a final step of energetic conversion by which adenosine diphosphate (ADP) is recharged into adenosine triphosphate (ATP), thereby providing energy in a universal form required by most cellular processes of the animal kingdom. The electron transport system (ETS) is responsible for generating a proton gradient across the inner mitochondrial membrane through the action of proton pumps. The ETS also contains the main sites responsible for the generation of reactive oxygen species (ROS). ROS are very small molecules containing oxygen, which are highly reactive due to the presence of unpaired valence electrons (mostly superoxide radical) or their instability (hydrogen peroxide). In low concentrations, ROS are considered signal molecules that mediate cellular functions. When ROS are in excess, ROS react with transition metals (e.g. iron) that are not securely bound to a protein (by Haber-Weiss or Fenton reactions) and form the hydroxyl radical (OH•). Lipid and protein oxidation by OH• are two of the most important processes that cause cell damages (Halliwell & Gutteridge, 2007). In proteins, ROS modify the amino acid specific site or the peptide chain fragment, alter electrical charge, and increase degradation (Catalgol et al., 2010). ROS generation can also induce lesions in deoxyribonucleic acid (DNA), particularly in mitochondrial DNA (Addabbo et al., 2009), causing deletions, mutations, and other lethal genetic injuries (Cooke et al., 2003). The oxidative stress state is determined by measuring an increase of oxidative cell damage to lipids, proteins or DNA. To keep ROS in a low concentration, the superoxide dismutase (SOD) and catalase (CAT) are two of the main antioxidant enzymes mobilized. SOD transforms superoxide radical to hydrogen peroxide, while CAT removes hydrogen peroxide and inhibits its accumulation in cells and tissues. Another antioxidant enzyme, the glutathione S-transferase (GST), employs reduced glutathione as a primary substrate to neutralize ROS (Hayes & Wolf, 1988). Energy metabolism and its plasticity is therefore a key mechanism that can determine species’
resilience in suboptimal environmental conditions. This is particularly true under acidification as lower performance optima will likely occur according to the oxygen- and capacity-limited thermal tolerance hypothesis that postulates a narrower thermal window under multi-stressor conditions (Pörtner, 2010).
The marine plankton uses several antioxidant compounds to deal with the natural or unusual ROS production caused by different environmental stressors. Algae exposed to high irradiances and/or temperature usually increase their antioxidant content, such as carotenoids and tocopherols, to counteract excess ROS formation and prevent membrane lipid peroxidation (Häubner et al., 2014). Carotenoids can be re-used continuously in plants
7 and phytoplankton (Stahl & Sies, 2004), but tocopherols depend of other components of the antioxidant system to be used again, mainly ascorbic acid (vitamin C) and reduced glutathione (Valko et al., 2004). In macrozooplankton such as krill, it was shown that the polar krill Euphausia superba had lowest antioxidant enzyme activities, high concentrations of reduced glutathione, and the lowest protein damages compared to the temperate krill species Euphausia mucronata and Euphausia pacifica (Tremblay & Abele, 2016). These results supported that permanently cold-adapted marine ectotherms rely on molecules (reduced glutathione) rather than enzymatic mechanisms for ROS quenching. Oxidative stress indicators were linked to the distinct daily vertical migration behavior encountered in the neritic krill species Nyctiphanes simplex (Tremblay et al., 2010). The latter was not migrating vertically into the hypoxic stratified surface water layer formed during the summer season, because of its incapacity to buffer the excess of ROS produced (100-fold more lipid peroxidation was observed despite the deployment of 30-fold elevated activities of the five antioxidant enzymes analyzed). Those findings were supported experimentally with two temperate contrasting species: Euphausia mucronata, adapted to hypoxic conditions, and Euphausia pacifica, which does not inhabit hypoxic waters (Tremblay & Abele, 2016).
Warming by 7°C above habitat temperature in summer increased the antioxidant enzyme activity of SOD as well as the reduced glutathione content in Euphausia mucronata, even under hypoxia, while warming by only 4°C combined with hypoxia was 100% lethal for Euphausia pacifica collected in the winter season and reduced significantly the antioxidant enzyme functionality in summer. In mesozooplankton (copepods), the experimental combined effects of ocean acidification and global warming predicted for year 2100 (between 0.2 and 0.4 pH units lower and + 3 - 5 °C) reduced their total antioxidant capacity (Vehmaa et al., 2013). However, in natural conditions, the efficiency and versatility of the glutathione cycling system was observed in copepods from the genus Acartia off Finland in the Baltic Sea facing marked differences in field temperature, oxygen and pH (Glippa et al., 2018).
Oxidative stress parameters are thus helpful to determine the level of cellular stress an organism experiences and mechanisms involved in the response. The overall aim of this thesis was to understand how a temperate plankton community copes in terms of plasticity with future multi-stressors as a result of an increasing temperature (global warming) and CO2
concentrations (acidification) of the ocean. Oxidative stress indicators and routine metabolic rates were investigated in marine plankton directly taken from the field and exposed to a gradient of five increasing temperatures (+2-10 °C) coupled with three acidification scenarios projected for 2100 by the IPCC (2007): (1) the less conservative scenario (450 ppm) that calls for extensive removal of CO2 from the atmosphere; (2) B2 (800 ppm CO2), if global change mitigation actions achieve the goals intended by the 2016 Paris agreement; and (3)
8 A2 (1000 ppm CO2), if CO2 emission continues as usual. This short-term experiment is part of an integrative approach involving short and long time-scale physiological responses at cellular and organismal levels to assess the vulnerability of marine plankton under natural conditions and different climate change scenarios.
2. Hypothesis
Based on what have been exposed above, we hypothesized that (1) short-term exposure to CO2 concentrations predicted by the 2100 climate scenario would negatively impact oxidative status, with effects on the energy metabolism; (2) higher temperature would negatively affect oxidative status by increasing ROS as a by-product of increased respiration; and (3) higher CO2 concentrations will decrease the plasticity of marine plankton to increasing temperature.
3. Methodology
3.1 Plankton sampling
On five consecutive days, from February 25th to March 1st 2019, plankton samples were collected with R/V Aade using plankton net with a mesh size of 150 µm (HYDROBIOS, Kiel, Germany) (fig. 1) at the long-term sampling station ‘‘Kabeltonne’’ (54°11.30 N; 7°54.00 E) at Helgoland Roads (Germany). On the first day of sampling, water column was more turbid (<2 m) and weather conditions were different with stronger winds and more clouds formation compared to the rest of the week. Earlier observation of plankton abundance and composition under a stereomicroscope (OLYMPUS SZX16, Hamburg, Germany) of a sample collected for the Helgoland Roads Time series contained approximately 10 ind·mL-1 (mostly copepods). The net was towed five times in order to obtain more biomass (approximately 50 individuals per replicate). Sea surface temperature was measured every sampling day (5.24
0.05 °C; mean standard deviation). Samples were maintained with fresh seawater in plastic containers (10 L) until their transport to the station (less than one hour).
9 Fig. 1 Photography of the plankton net HYDROBIOS KIEL, mesh size 150 µm. © Hannes Seidel
3.2 Experimental design
A temperature gradient table, similar to the one described in Thomas et al. (1963), was used to conduct the experiment. The temperature table was installed in a temperature-controlled room set at 10 °C. The table contained 60 beakers (n=60, 800 mL) filled with sterilized filtered seawater (0.2 µm) and was equipped with two high precision cooling bath thermostats (HUBER Compatible Control K6, range -25 °C to +200 °C, Offenburg, Germany) that were set to 3.5 °C to 18 °C, respectively. Engine coolant was flowing in the closed system to obtain the following gradient of temperature (5, 7, 10, 12, 15 °C, n=12 for each temperature) (fig. 2A). The lowest temperature was similar to in situ conditions. Each beaker had a non-toxic plastic hose with a 15 cm glass tube end which was connected to a carbon dioxide (CO2) distributor. Three CO2 concentrations were set (450, 800, 1000 ppm) and supplied in 20 beakers of the temperature table with gentle bubbling (fig. 2A). The CO2
concentrations were regulated by a sensor (HTK, Hamburg, Germany). This design resulted in four replicates per temperature and per CO2 concentration (fig. 2A). Out of safety and space reasons, only one room could be supplied with CO2 gassing, so that this number of replicates within the setup was the maximum capacity.
Each day of sampling, plankton was distributed in 12 beakers of the same acclimation temperature (covering the three CO2 concentrations), starting with the highest temperature.
Before the distribution into the temperature table, the water containing the plankton was filtered using 1000 µm to remove the larger organisms (e.g. algae, fish-larvae, jellyfish) and objects (fibres, plastic). Plankton was then concentrated on a 150 µm mesh and transferred to a volume of 75.0 mL sterilized filtered seawater (0.2 µm). Plankton was pipetted equally
10 (5.3 mL) alternating among the three CO2 concentrations. One sample was taken for subsequent analysis of plankton community composition (5 mL tube kept at - 20 °C). The exposure to higher CO2 concentrations lasted seven days for each acclimation temperature.
In order to prevent CO2 outgassing, Parafilm© under an aluminium foil was used to cover the beakers (fig. 2B). The room was kept without light during the whole experiment to avoid any influence on the primary producers.
Plankton was fed daily with a culture of Rhodomonas salina (Wislouch) Hill et Wetherbee (Cryptophyceae) approximately 20.000 cells per organism. The culture was grown in sterilized filtered seawater (0.2 µm) with F/2 medium (Guillard & Ryther, 1962) in a batch culture at 18.5 °C with a 18:6 h light/dark cycle. The concentration of cells was measured daily with a CASY particle counter (SCHÄRFE SYSTEMS, Reutlingen, Germany).
Algae culture was diluted accordingly to maintain optimal cells density during the experiment.
Before feeding, seawater was changed with freshly pre-conditioned seawater adjusted to each set (acclimation temperature and CO2 concentration) to prevent an accumulation of dead algae and to maintain good water quality.
After the completion of the seven days acclimation, each beaker was processed for measurement of routine metabolic rate (RMR; approximately 1:5 of plankton; see section 3.4) and the remaining was preserved for oxidative stress indicators biochemical analysis (section 3.5). For the latter, plankton was sieved on a 150 µm mesh and was rapidly rinsed with distilled water to eliminate salts, transfer to a perforated 1.5 mL safe-lock tube using a micro scoop spoon, and snap-frozen in liquid nitrogen. The tubes were preserved at - 80 °C until analysis.
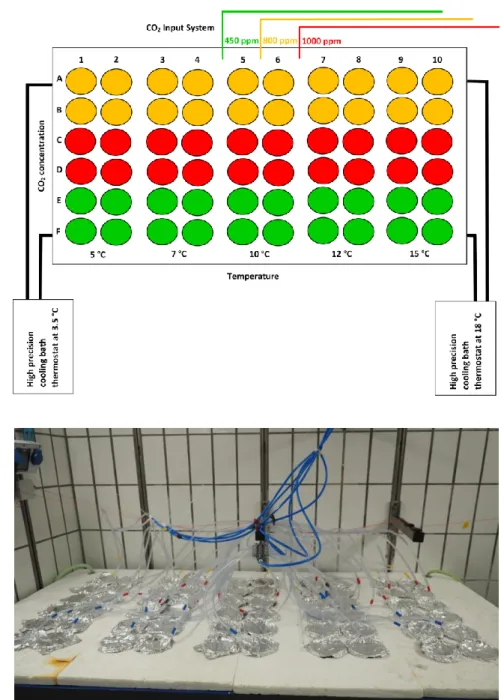
11 A
B
Fig. 2 Temperature gradient table used in the experiment. (A) Schematic view of the distribution of the 60 beakers, CO2 input system and thermostats. Colours represent CO2 concentrations (blue = 450 ppm; yellow = 800 ppm; red = 1000 ppm,). Numbers 1-10 and letters A-F were used to tag beakers and samples respectively for identification during and after the experiment. (B) Photography of experimental setup. The beakers were covered with Parafilm® under an aluminium foil, each with a colour labelled non-toxic hose (blue, red, yellow) supplying the corresponding CO2 concentration. © Hannes Seidel
3.3. Abiotic parameters
Temperature (VOLTCRAFT DET2R, Wernberg-Köblitz, Germany) and pH-level (WTW pH315i, Weilheim, Germany) were measured daily (n= 2 for each combination of acclimation temperature and CO2 concentration evenly distributed), while salinity (WTW Cond 3110 SET 1, Weilheim, Germany) was measured at the beginning and at the end of the experiment. On
12 days 2 and 8 of each acclimation temperature, water was sampled air-sealed in 100 mL bottles (SCHOTT, Mainz, Germany) and immediately stored at 4 °C for later measurements of total alkalinity (TA; n= 2 for each combination of acclimation temperature and CO2
concentration evenly distributed). TA was measured using a TitroLine plus titrator (SI Analytics GmbH (Xylem), Weilheim, Germany) in duplicate with Dickson Batch 104 (NOAA, Reference material for oceanic CO2 measurements, 2010) as a standard. TA, acclimation temperature, salinity, pH and pressure were inserted in CO2Calc (v4.0.9, U.S. Geological Survey, Florida, U.S.A., https://pubs.usgs.gov/of/2010/1280/) to calculate real pCO2 values at the beginning and the end of the experiment (days 2 and 8) for each combination of acclimation temperature and CO2 concentration evenly distributed. As calculation preferences, Mehrbach et al. (1973) refitted by Dickson and Millero (1987) was used for CO2
Constant, total scale (mol/kg-SW) for pH scale, Uppström (1974) for total boron and Dickson (1990) for KHSO4 to calculate the carbonate system.
3.4. Routine metabolic rate measurements
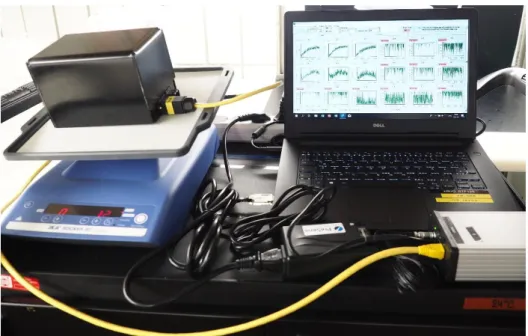
SDR SensorDish® Reader (PreSens, Regensburg, Germany) was used to assess plankton oxygen consumption (fig. 3). This system consists of a 24-channel reader of oxygen luminescence quenching and provides a high-quality measurement without oxygen consumption or gas exchange between the environment and the vial functioning as the incubation chamber (Warkentin et al., 2007). The reader is to be used under a 24-well micro- plate with 24 4-mL glass vials implemented with an optically isolated oxygen sensor type PSt5 at its bottom (PreSens, Regensburg, Germany). The 12 beakers of the same temperature were analysed at the same time in a temperature-controlled room set to the acclimation temperature, using sterilized filtered seawater (0.2 µm) pre-conditioned to each CO2 concentration. Vials without plankton (n= 4 per CO2 concentration) were used as a control to account for microbial oxygen consumption in the filtered seawater. When microbial respiration rate was higher than plankton rate, the measurement was discarded (n= 2). Prior to the vials filling, vials were immerged to the specific seawater of the treatment to ease the removal of air bubbles. The 24-channel reader and vials were placed on a rocking platform shaker (IKA Rocker 2D digital, Staufen, Germany) at 80 revolutions per minute (rpm) to avoid oxygen stratification within the vials. As primary producers can increase the oxygen content in the vials, the room was kept in the dark and an opaque black plastic box was placed on the vials to avoid any light during measurement. The oxygen concentration was recorded every minute, in mg·L-1, for 22 to 24h. The data were registered in the corresponding Presens software and exported as an Excel® sheet. Upon the completion of the
13 measurement, each vial content were filtered with a Filterline system (SARTORIUS, Goettingen, Germany) on a pre-weighed glass microfiber filters GF/F (WHATMANTM) with a diameter of 25 mm. Filters were dried for 48 hours at 60 °C in an oven (MEMMERT, Schwabach, Germany) and weighed to obtain the dry weight (DW) of the plankton used in respiration measurements. A high precision balance (SARTORIUS, Göttingen, Germany) was used to weigh the filters. In some cases, because of the small size/weight of plankton, DW negative values were observed (n= 11). In other words, the final weight was higher than the initial weight. Negative DW values were replaced by the mean value of the corresponding treatment (fig. 4). Posteriorly, all respiration measurements of plankton and blank were graphed according to time and the most linear segment of the curve was used to calculate the plankton respiration rate:
𝑀𝑂2= (slope) ×𝑉 𝑀
where 𝑀𝑂2 is oxygen consumption (mg O2·h−1·mg DW−1), 𝑉 is the water volume in the vial and M is plankton mass (mg DW).
Fig. 3 SDR SensorDish® Reader used to assess plankton oxygen consumption. This system consists of a 24-channel reader of oxygen luminescence quenching under a 24-well micro-plate with 4-mL glass vials. The vials are implemented with an optically isolated oxygen sensor type PSt5 at its bottom. The measurement was realized in a temperature-controlled room set to the acclimation temperature. The equipment was placed on a mobile cart to ease its transport among temperature- controlled rooms. © Hannes Seidel
14 Fig. 4 Cleveland dot plots of the plankton dry weight (mg) contained in each vial used for the routine metabolic rate measurements. (A) In some cases, because of the small size/weight of plankton, negative values were observed (n= 11). (B) Negative values were replaced by the mean value of its corresponding treatment for further calculations of oxygen consumption.
3.5 Oxidative stress indicators
For each combination of acclimation temperature and CO2 concentration (n= 4), two replicates were assigned to the enzyme analysis, and two replicates for lipid damages. For the enzymes, plankton samples were homogenized using a laboratory ball mill (MIXER MILL MM 400, Retsch, Haan, Germany) with 6-fold volume (w/v) of phosphate buffer solution (50 mmol L-1 potassium phosphate dibasic and monobasic mixture K2HPO4/KH2PO4, 50 mmol·L-1 EDTA, 1 mmol·L-1 phenylmethanesulfonyl fluoride, pH 7.5) and centrifuged at 23 897 g velocity for 3 min at 4 °C (HERMLE Z383K, Wehingen, Germany). Three antioxidant enzymes were analysed in this supernatant in triplicate: the superoxide dismutase (SOD), catalase (CAT), and glutathione S-transferase (GST). SOD converts O2•- to H2O2 and were measured using the xanthine-xanthine oxidase as a superoxide radical generating system and nitroblue tetrazolium as the detector (Suzuki et al., 2000). CAT targets H2O2 and was measured at 240 ηm after Aebi (1984). GST transforms xenobiotics into other conjugates using reduced glutathione (GSH) as substrate and was estimated by detecting the formation of the thioether product from the reaction between GSH and 1-chloro, 2, 4-dinitrobenzene (Habig & Jakoby, 1981). All antioxidant enzyme activities were measured at room temperature (20°C) using a micro-plate reader (THERMO Multiskan Spectrum, Waltham, USA). Soluble protein content was measured after Bradford (1976) in all supernatants to get enzyme activities expressed in activity units (U) mg·proteins-1. Quantification of malondialdehyde (MDA) formation (lipid damages) was assessed in duplicate according to Uchiyama and Mihara (1978) and expressed as ηmol MDA g wet mass or WM-1.
15 3.6 Data treatment and analysis
Respiration data were compiled with Microsoft® Excel® and afterwards analysed statistically in RStudio (R Core Team, 2018). A Cleveland dot plots was used to visually check the oxygen consumption data for outliers; one data was discarded (fig. 5). Data were transformed (with square root operation) and tested for normality (Shapiro-Wilk test) and variance homogeneity (Bartlett’s test) to meet the assumptions of one-way analysis of variance (ANOVA). One ANOVA was used for each acclimation temperature with the CO2
concentration as factor. Acclimation temperature was not considered as factor, because the plankton came from different sampling days. Pairwise comparisons were performed with post-hoc Tukey's test to detect the CO2 concentration that contributed to the significant differences. All results were considered to be statistically significant at p-value <0.05.
Fig. 5 A Cleveland dot plot was used to visually check the routine metabolic rate data for outliers; one data was discarded (red arrow).
Oxidative stress indicators were analysed using the Integrated Biomarker Response (IBR) analysis (Beliaeff & Burgeot, 2002). The IBR was summarized in one general “stress index”
(following Li et al. (2017)) for each acclimation temperature and CO2 concentration. Mean and SD (standard deviation) were calculated for all parameters, which were standardized according to the formula Y=(X−m)/S, where Y is the standardized data, X is the data of each biomarker response, m is the mean data of the biomarker, and S is the standard deviation of the biomarker. Values of Z were calculated as Z = Y in the case of activation. The minimum value (Min) of each parameter was obtained and S was calculated as S = Z + |Min|, where S
≥ 0 and |Min| is the absolute value. Calculation of star plot areas (Ai) were done by the
16 formula Ai = Si /2 sinβ (Si cosβ + Si +1 sinβ), where β= Arc tan (Si +1 sinα /Si − Si +1 cosα), α is 2π/n radians, n is the number of the biomarkers, and Si is the obtained value for each biomarker. The sum of the area Ai gives the corresponding IBR value IBR = Σi=1 = Ai. Radar plots were done using the “fmsb” package (Nakazawa, 2014) in R. Higher IBR index core values are indicative of a poorer health status (stressed organisms).
4. Results
4.1 Species composition
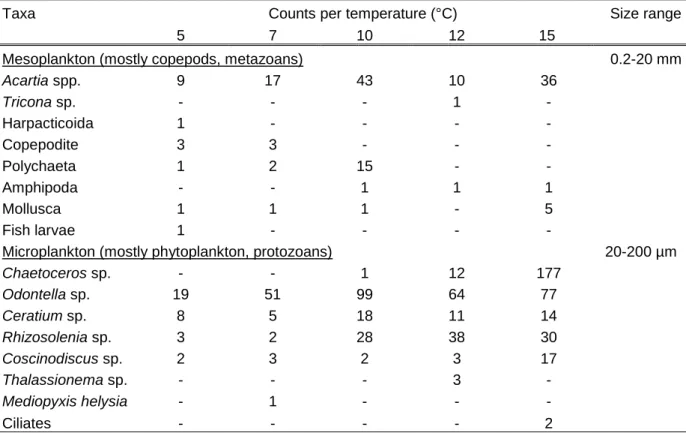
Plankton samples consisted of 16 taxa in total of which four species of mesozooplankton, eight species of phytoplankton and single or few individuals of polychaeta, amphipoda, mollusca and fish larvae (Table 1). The mesozooplankton was dominant in terms of biomass, with 123 counted organisms of which Acartia spp. was present in all samples. Long chains and large cells of phytoplankton were abundant with 690 counted organisms of which Odontella sp. was most present throughout the five samples distributed in the temperature gradient table, while a very high number of Chaetoceros sp. occurred in the plankton distributed in the 15 °C acclimation temperature.
Table 1 List and count of meso- and microplankton taxa. Counts represent subsamples that were taken and frozen before plankton was distributed in the temperature gradient table. Sizes are defined for respective groups according to Dussart (1965).
Taxa Counts per temperature (°C) Size range
5 7 10 12 15
Mesoplankton (mostly copepods, metazoans) 0.2-20 mm
Acartia spp. 9 17 43 10 36
Tricona sp. - - - 1 -
Harpacticoida 1 - - - -
Copepodite 3 3 - - -
Polychaeta 1 2 15 - -
Amphipoda - - 1 1 1
Mollusca 1 1 1 - 5
Fish larvae 1 - - - -
Microplankton (mostly phytoplankton, protozoans) 20-200 µm
Chaetoceros sp. - - 1 12 177
Odontella sp. 19 51 99 64 77
Ceratium sp. 8 5 18 11 14
Rhizosolenia sp. 3 2 28 38 30
Coscinodiscus sp. 2 3 2 3 17
Thalassionema sp. - - - 3 -
Mediopyxis helysia - 1 - - -
Ciliates - - - - 2
17 4.2 Abiotic parameters
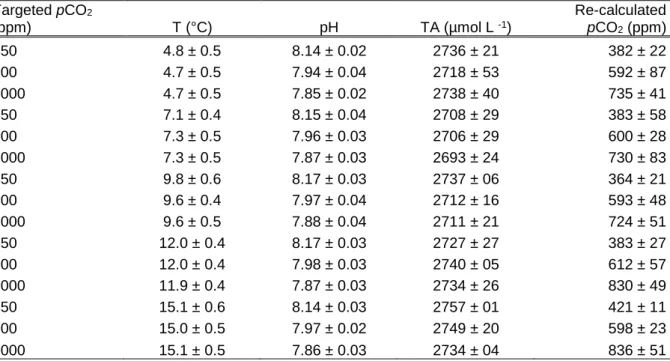
Acclimation temperature and pH were maintained homogenously during the whole duration of the experiment (Table 2). The pH ranged in average from 8.14 to pH 8.17 (450 ppm), from 7.94 to 7.98 (800 ppm) and from 7.85 to 7.88 (1000 ppm) (Table 2). Salinity remained stable between the beginning and the end of the experiment with value of 33.5 ± 0.24 (mean ± SD).
Salinity, pH, temperature, total alkalinity (TA) and atmospheric pressure were used to calculate the carbonate systems within each combination of acclimation temperature and CO2 concentration. The pCO2 (ppm) obtained was not corresponding to the targeted concentrations (Table 2). The targeted 450ppm intrinsically ranged between 364 – 421ppm, targeted 800ppm between 592 – 612ppm and targeted 1000ppm between 724 – 836ppm.
However, the gradients were similar to the ones aimed with the targeted concentrations:
800:450= 1.78 and 1000:800= 1.25 vs. 602:393= 1.53 and 780:602= 1.30. To ease the presentation of results and discussion, the targeted concentrations will continue to be used hereafter.
Table 2 Targeted and measured values of abiotic parameters. Values of temperature and pH represent two measurements per day during seven days of experiment. Water samples for total alkalinity (TA) were taken on the initial and final day. Recalculated pCO2 was calculated from averaged TA, temperature, pH, salinity, and pressure with the program CO2Calc (v4.0.9, U.S.
Geological Survey, Florida, U.S.A., https://pubs.usgs.gov/of/2010/1280/); mean ± SD.
Targeted pCO2
(ppm) T (°C) pH TA (µmol L -1)
Re-calculated pCO2 (ppm)
450 4.8 ± 0.5 8.14 ± 0.02 2736 ± 21 382 ± 22
800 4.7 ± 0.5 7.94 ± 0.04 2718 ± 53 592 ± 87
1000 4.7 ± 0.5 7.85 ± 0.02 2738 ± 40 735 ± 41
450 7.1 ± 0.4 8.15 ± 0.04 2708 ± 29 383 ± 58
800 7.3 ± 0.5 7.96 ± 0.03 2706 ± 29 600 ± 28
1000 7.3 ± 0.5 7.87 ± 0.03 2693 ± 24 730 ± 83
450 9.8 ± 0.6 8.17 ± 0.03 2737 ± 06 364 ± 21
800 9.6 ± 0.4 7.97 ± 0.04 2712 ± 16 593 ± 48
1000 9.6 ± 0.5 7.88 ± 0.04 2711 ± 21 724 ± 51
450 12.0 ± 0.4 8.17 ± 0.03 2727 ± 27 383 ± 27
800 12.0 ± 0.4 7.98 ± 0.03 2740 ± 05 612 ± 57
1000 11.9 ± 0.4 7.87 ± 0.03 2734 ± 26 830 ± 49
450 15.1 ± 0.6 8.14 ± 0.03 2757 ± 01 421 ± 11
800 15.0 ± 0.5 7.97 ± 0.02 2749 ± 20 598 ± 23
1000 15.1 ± 0.5 7.86 ± 0.03 2734 ± 04 836 ± 51
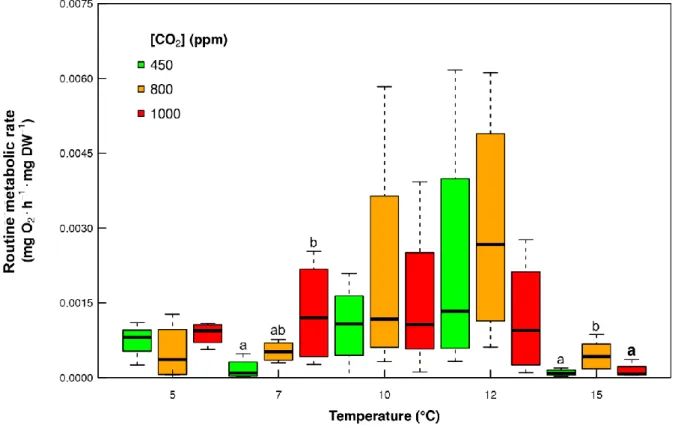
18 4.3 Routine metabolic rates
The routine metabolic rate (RMR) of the 5 °C treatment was similar among all CO2
concentrations (450, 800, 1000 ppm) (fig. 6). At the acclimation temperature of 7 °C, plankton exposed at CO2 concentration of 1000 ppm has a significantly higher RMR compared to 450 ppm (ANOVA: F-value = 4.326, p-value = 0.0482). Variability in RMR was high for all CO2 concentrations in plankton acclimated to 10 °C and 12 °C, varying from 0.0007 and 0.0052 mg O2·h-1·mg DW-1 (fig. 6). At the acclimation temperature of 15 °C, plankton exposed to CO2 concentration of 800 ppm has significantly higher RMR compared to both treatments 450 and 1000 ppm (ANOVA: F-value =8.164, p-value = 0.0117).
Fig. 6 Routine metabolic rate (in mg O2·h-1·mg DW-1) of plankton acclimated to five different temperatures (5, 7, 10, 12 and 15°C) and three CO2 concentrations (green= 450 ppm, orange= 800 ppm, red= 1000 ppm); horizontal bars in the box plots indicate the median; upper and lower edges of the rectangles show the first and third quartiles, respectively; vertical error bars extend to the lowest and highest values in a 1.5-fold inter-quartile range (R Core Team 2018); lower case letters show significant differences at p< 0.05.
4.4 Oxidative stress indicators
Radar plots and integrated biomarker responses (IBR) of oxidative stress indicators demonstrated that all CO2 concentrations have negative effects for the plankton as
19 acclimation temperature increased (fig. 7). High CO2 concentration (1000 ppm) at 5 °C provoked a greater response of antioxidant defenses considering enzyme activities of catalase (CAT) and superoxide dismutase (SOD). When acclimated to 7 °C, organisms treated with 1000 ppm CO2 mobilized again higher antioxidant response than the two other treatments, adding the action of the glutathione S-transferase (GST). This response seems efficient as no lipid damages were observed. At 10 °C, CAT activity and lipid damages were higher for the 800 ppm CO2 treatment. At 12°C, all enzymes and lipid damages were expressed significantly high for 450 ppm. At the same acclimation temperature, damages were also noted for the 1000 ppm CO2 treatment together with higher GST activity. At 15 °C, organisms exposed to the two highest CO2 concentrations had a high antioxidant defense response that did not counteract the oxidative damage to lipids. The latter observation was stronger for the 800 ppm CO2 concentration. The highest IBR values for each CO2
concentrations were reached at 7 °C (1000 ppm), 12 °C (450 ppm) and 15 °C (800 ppm) (fig.
7).
20 Fig. 7 Radar plots of oxidative stress indicators and integrated biomarker response (IBR) of plankton acclimated to five temperatures and three CO2 concentrations (green= 450 ppm, orange= 800 ppm, red= 1000 ppm); Normalized means for MDA=[malondialdehyde] for lipid damages, CAT=catalase activity, SOD= superoxide dismutase activity, and GST= glutathione S-transferase activity.
21 5. Discussion
In this study, field samples of temperate marine plankton of both zoo- and phytoplankton were taken and exposed to five acclimation temperatures (5 – 15 °C) with each three different concentrations of CO2 gassing into the respective containers. After maintaining conditions of treatments and measurements of abiotic parameters for seven days, plankton was taken out for different types of measurements. Routine metabolic rates for at least 22 hours (in the dark) and oxidative stress indicators were measured.
Three main research questions derived from my hypotheses, which will now be answered and discussed in the following paragraphs:
1. Does short-term exposure to CO2 concentrations predicted by the 2100 climate scenario have a negative impact on the organism’s oxidative status?
In the study of Vehmaa et al. (2013), where cyanobacteria and calanoid copepods were exposed to lower and ambient pH levels, acidification alone did not have a significant effect on the oxidative status of treated organisms. In the present study, at a temperature similar to in situ, plankton exposed to the highest concentration (1000 ppm) displayed a higher antioxidant response compared to the two other treatments. However, as the RMR did not increase, this antioxidant response seems to be in the range of what the planktonic organisms can handle in terms of stress. This is probably why no damages to lipids were detected, as the response was adequate. Catalase (CAT) and superoxide dismutase (SOD) were the first to respond to high level of acidification. Both enzymes are part of the first line of antioxidant defence, especially efficient against the superoxide anion which is perpetually generated in normal body metabolism, through the mitochondrial energy production pathway (Ighodaro & Akinloye, 2018). From samples taken directly from the field, it is already acknowledged that copepods can count on the efficiency and versatility of the glutathione cycling system when facing marked differences in field temperature, oxygen and pH of the Baltic sea (Glippa et al., 2018). The greater capacity of copepods to respond to oxidative stress was also shown in field samples from the Northern California Current System along a large gradient of temperature and carbonate biochemistry (Engström-Öst et al., 2019).
According to these authors, copepods have high adaptive potential, owing to their strong vertical migration behavior. Therefore, in the current environmental conditions, plankton from the temperate system of the North Sea can cope with moderate and high levels of acidification.
22 2. Does a higher temperature negatively affect the oxidative status by increasing ROS
as a by-product of increased respiration?
Organisms were sampled around 5.2 °C, which was also used as the lowest acclimation temperature (5 °C) in the experiment. Highest temperature was 10 °C above their usual ambient temperature in this time of the year, meaning that significant changes in oxidative status depending on the acclimation temperature were expected. With increasing temperature, RMR show an increasing trend principally for the acclimation temperatures of 10 and 12°C. At those temperature, the variance was much higher for all the CO2
concentrations, meaning that the acclimation temperature was affecting the response displayed by plankton. Probably, more ROS were produced at high temperature, in addition with a higher RMR or not, as damage to lipids occur from 10 °C on (fig. 7). The RMR is difficult to align with the integrated biomarker response (IBR) because of the large variability that is given at 10 and 12 °C acclimation temperature. At 15 °C, all the RMR of all CO2
concentrations decreased, which could indicate a possible metabolic suppression as thermal threshold overpassed. Alcaraz et al. (2013) observed a similar decrease of oxygen consumption working with the arctic copepod Calanus glacialis in a range of temperature from 0 to 10°C. The lowest pCO2 scenario exhibited a very high IBR value at an acclimation of 12 °C, indicating that temperature was acting as a stressor alone.
3. Will higher CO2 concentrations decrease the plasticity of temperate marine plankton to increasing temperature?
As stated in the first part of this discussion, at field temperature, plankton was able to handle the possible overproduction of ROS occasioned by the highest CO2 concentration. The portrait is completely different with a slight increase of temperature (+2 °C), when the antioxidant response sought the activity of a third enzyme to buffer the extra production of ROS. In this case, RMR increased significantly, meaning that less energy was available to invest in other important biological functions like growth, reproduction, feeding and escape responses. No damages were visible yet to lipids, but as the IBR was the highest for 1000 ppm at this temperature, those would probably show up if the time of exposure would be longer.
When exposed to certain varieties or changes in the organism’s environment, the ability to apply the most appropriate and adaptive response, the organism’s plasticity, is individually deployed. In this experiment, the planktonic community that was treated with the highest CO2 (1000 ppm) showed enzymatic activity in the IBR in almost all acclimation
23 temperatures (5, 7, 12, 15 °C), while medium and low CO2 treated organisms (450 and 800 ppm) only showed enzymatic activity in the higher temperatures (10, 12, 15 °C) manifested as a considerably high response in both ROS and oxidative stress (12, 15 °C).
Damage to lipids (MDA) were noted at 10 °C for the 800 ppm, but were low in plankton exposed at 12 °C. A synergic effect of temperature with low pH was also noted in the study of Vehmaa et al. (2013) in which higher acclimation temperature (17 °C) increased copepods antioxidant capacity. At 15 °C acclimation temperature, organisms that underwent 800 ppm CO2 treatment had increased routine metabolic rates compared to low and high CO2 treated organisms, which supports ROS generation and reflects the considerably high enzymatic activity of all applied enzymes (CAT, SOD, GST, MDA). Generation or ROS was too high for the organism’s antioxidant capacities which was manifested by a strong oxidative stress response (high damage to lipids, proteins and DNA), resulting in the highest IBR values all treatments and acclimation temperatures combined.
At 800 ppm, the ROS produced may have acted as signalling molecules for the activation of protective responses (e.g. stress gene transcription, membrane pore opening and metabolic down-regulation). At mildly stressful conditions (12 °C) the stress signal may be helpful, but extreme temperature stress (15 °C) overpassed this cell beneficial stress response (fig. 7). An efficient signaling response may have taken place for the 450 ppm at 15
°C, as no antioxidant defense neither oxidative damages were observed for this treatment.
These processes were also discussed in the study of Tremblay and Abele (2016) as the hypoxia sensitive krill species Euphausia pacifica presented some mitigation mechanisms when facing mid-warm (12 °C) hypoxic conditions to avoid damage to lipids. Those mechanisms were not maintained when the same krill species was exposed to warmer temperature (14 °C).
It seems that high treated organisms (1000 ppm) in this study respirate more constantly throughout all temperatures (fig. 6) compared to low and medium treatment. According to the oxygen- and capacity-limited thermal tolerance hypothesis, narrower thermal window under acidification conditions is likely to occur (Pörtner, 2010). This was true for the 1000 ppm CO2
concentration of the present study. At 800 ppm, there was a temporal positive effect on the plasticity of temperate marine plankton when environmental temperatures remain close to ambient values, so that ROS generation is not getting excessive. Exposure to CO2
concentrations (800 and 1000 ppm) that were predicted by the 2100 climate scenario (IPCC 2007) showed a positive effect of the organism’s antioxidant capacity, but damage to lipids were considerably high (oxidative stress) which can be considered as a significant negative impact on the organism’s oxidative balance.
24 General considerations
Clearly, only four replicates do not suffice to underpin what happened at 10 and 12 °C. The advantage of using the temperature gradient table was the possibility to cross five temperatures with three CO2 concentrations in one single temperature-controlled room. Ideal would have been to repeat the same experimental design at least three times to increase the number of replicates. Samples varied in community composition (Table 1) because of different sampling days and conditions, but were treated all the same during the experiment.
As can be seen in counts of 15 °C where phytoplankton was much more abundant with a number of 315 individuals, the other days (5, 7, 10, 12 °C) showing numbers between 32 and 148 counts. This amount of phytoplankton could have had an effect on respiration and biomarker response, though phytoplankton is considered as microplankton (size 20 – 200 µm) and therefore consuming less oxygen and having lower content of protein tissue for determining the oxidative status. Looking at the number of polychaetas in the sample for 10
°C, a similar effect could have occurred. While the other samples have none or very few individuals of polychaetas, a number of 15 is counted in 10 °C when total count is 18 individuals in all samples. Polychaetas are part of mesoplankton and have about the same size than most mesozooplankton (0.2 – 20mm). Thus, values of respiration and oxidative stress response could have been affected by latter.
When treated organisms where filtered after respiration, dried and weighed in order to calculate respiratory rates for each sample, there was very little organic matter on the filter to process. In some cases, dry-weight values were negative although some organic material could be seen on the filter. This was later a minor issue when all replicates wanted to be included to have a more significant dataset for each temperature and CO2 concentration.
When working with few organisms or very little organic material, another method of obtaining a more precise value that can be used for later calculation of respiration rates is recommended (for example carbon content, wet-weight) instead of dry-weight.
To conclude, the ability to adapt (plasticity) at different levels in plankton communities towards a changing ocean temperature and chemistry can be partly shown after using a set of biomarkers that assess different responses and states of tissue and cells. These biomarkers can be used variously to establish relationships between the effect of abiotic parameters and physiological fitness of plankton communities by using a multivariate technique
25 References
Addabbo, F., Montagnani, M. & Goligorsky, M.S. (2009) Mitochondria and Reactive Oxygen Species. Hypertension, 53, 885-892 DOI:
https://doi.org/10.1161/HYPERTENSIONAHA.109.130054.
Aebi, H. (1984) [13] Catalase in vitro. Methods in Enzymology, pp. 121-126. Academic Press DOI: https://doi.org/10.1016/S0076-6879(84)05016-3.
Alcaraz, M., Felipe, J., Grote, U., Arashkevich, E. & Nikishina, A. (2013) Life in a warming ocean: thermal thresholds and metabolic balance of arctic zooplankton. Journal of Plankton Research, 36, 3-10 DOI: https://doi.org/10.1093/plankt/fbt111.
Algueró-Muñiz, M., Meunier, C.L., Holst, S., Alvarez-Fernandez, S. & Boersma, M. (2016) Withstanding multiple stressors: ephyrae of the moon jellyfish (Aurelia aurita, Scyphozoa) in a high-temperature, high-CO2 and low-oxygen environment. Marine Biology, 163, 185 DOI: https://doi.org/10.1007/s00227-016-2958-z.
Beliaeff, B. & Burgeot, T. (2002) Integrated biomarker response: A useful tool for ecological risk assessment. Environmental Toxicology and Chemistry, 21, 1316-1322 DOI:
https://doi.org/10.1002/etc.5620210629.
Bradford, M.M. (1976) A Rapid and Sensitive Method for the Quantitation of Microgram Quantities of Protein Utilizing the Principle of Protein-Dye Binding. Analytical Biochemistry, 72, 248-254 DOI: https://doi.org/10.1016/0003-2697(76)90527-3.
Brown, J.H., Gillooly, J.F., Allen, A.P., Savage, V.M. & West, G.B. (2004) Toward a Metabolic Theory of Ecology. Ecology, 85, 1771-1789 DOI:
https://doi.org/10.1890/03-9000.
Catalgol, B., Wendt, B., Grimm, S., Breusing, N., Özer, N.K. & Grune, T. (2010) Chromatin repair after oxidative stress: Role of PARP-mediated proteasome activation. Free Radical Biology and Medicine, 48, 673-680 DOI:
https://doi.org/10.1016/j.freeradbiomed.2009.12.010.
Cooke, M.S., Evans, M.D., Dizdaroglu, M. & Lunec, J. (2003) Oxidative DNA damage:
mechanisms, mutation, and disease. The FASEB Journal, 17, 1195-1214 DOI:
https://doi.org/10.1096/fj.02-0752rev.
Dickson, A.G. (1990) Thermodynamics of the dissociation of boric acid in synthetic seawater from 273.15 to 318.15 K. Deep Sea Research Part A. Oceanographic Research Papers, 37, 755-766 DOI: https://doi.org/10.1016/0198-0149(90)90004-F.
Dickson, A.G. & Millero, F.J. (1987) A comparison of the equilibrium constants for the dissociation of carbonic acid in seawater media. Deep Sea Research Part A.
Oceanographic Research Papers, 34, 1733-1743 DOI: https://doi.org/10.1016/0198- 0149(87)90021-5.
Dussart, B.H. (1965) Les différentes catégories de plancton. Hydrobiologia, 26, 72-74 DOI:
https://doi.org/10.1007/BF00142255.
Engel, K., Tollrian, R. & Jeschke, J.M. (2011) Integrating biological invasions, climate change and phenotypic plasticity. Communicative & Integrative Biology, 4, 247-250 DOI:
https://doi.org/10.4161/cib.4.3.14885.
Engström-Öst, J., Glippa, O., Feely, R.A., Kanerva, M., Keister, J.E., Alin, S.R., Carter, B.R., McLaskey, A.K., Vuori, K.A. & Bednaršek, N. (2019) Eco-physiological responses of copepods and pteropods to ocean warming and acidification. Scientific Reports, 9, 4748 DOI: https://doi.org/10.1038/s41598-019-41213-1.
Gillooly, J.F., Brown, J.H., West, G.B., Savage, V.M. & Charnov, E.L. (2001) Effects of Size and Temperature on Metabolic Rate. Science, 293, 2248 DOI:
https://doi.org/10.1126/science.1061967.
Glippa, O., Engström-Öst, J., Kanerva, M., Rein, A. & Vuori, K. (2018) Oxidative stress and antioxidant defense responses in Acartia copepods in relation to environmental factors. PLOS ONE, 13 DOI: https://doi.org/10.1371/journal.pone.0195981.
26 Guderley, H. (2004) Metabolic responses to low temperature in fish muscle. Biological
Reviews, 79, 409-427 DOI: https://doi.org/10.1017/S146479310300632.
Guillard, R.R.L. & Ryther, J.H. (1962) Studies of Marine Planktonic Diatoms: I. Cyclotella nana Hustedt, and Detonula confervacea (cleve) gran. Canadian Journal of Microbiology, 8, 229-239 DOI: https://doi.org/10.1139/m62-029.
Habig, W.H. & Jakoby, W.B. (1981) Assays for differentiation of glutathione S-Transferases.
Methods in Enzymology, pp. 398-405. Academic Press DOI:
https://doi.org/10.1016/S0076-6879(81)77053-8.
Halliwell, B. & Gutteridge, J.M. (2007) Free Radicals in Biology and Medicine, 4th edn.
Oxford University Press, Oxford.
Hammill, E., Johnson, E., Atwood, T.B., Harianto, J., Hinchliffe, C., Calosi, P. & Byrne, M.
(2018) Ocean acidification alters zooplankton communities and increases top-down pressure of a cubozoan predator. Global Change Biology, 24, e128-e138 DOI:
https://doi.org/10.1111/gcb.13849.
Häubner, N., Sylvander, P., Vuori, K. & Snoeijs, P. (2014) Abiotic stress modifies the
synthesis of alpha-tocopherol and beta-carotene in phytoplankton species. Journal of Phycology, 50, 753-759 DOI: https://doi.org/10.1111/jpy.12198.
Hayes, J.D. & Wolf, C.R. (1988) Glutathione Conjugation: Mechanisms and biological significance. Academic Press Ltd, London.
Ighodaro, O. & Akinloye, O. (2018) First line defence antioxidants-superoxide dismutase (SOD), catalase (CAT) and glutathione peroxidase (GPX): Their fundamental role in the entire antioxidant defence grid. Alexandria Journal of Medicine, 54, 287-293 DOI:
https://doi.org/10.1016/j.ajme.2017.09.001.
Kurihara, H. (2008) Effects of CO2-driven ocean acidification on the early developmental stages of invertebrates. Marine Ecology Progress Series, 373, 275-284 DOI:
https://doi.org/10.3354/meps07802
Kurihara, H. & Ishimatsu, A. (2008) Effects of high CO2 seawater on the copepod (Acartia tsuensis) through all life stages and subsequent generations. Marine Pollution Bulletin, 56, 1086-1090 DOI: https://doi.org/10.1016/j.marpolbul.2008.03.023.
Le Lann, C., Wardziak, T., van Baaren, J. & van Alphen, J.J.M. (2011) Thermal plasticity of metabolic rates linked to life-history traits and foraging behaviour in a parasitic wasp.
Functional Ecology, 25, 641-651 DOI: https://doi.org/10.1111/j.1365- 2435.2010.01813.x.
Lemieux, H., Tardif, J.-C., Dutil, J.-D. & Blier, P.U. (2010) Thermal sensitivity of cardiac mitochondrial metabolism in an ectothermic species from a cold environment, Atlantic wolffish (Anarhichas lupus). Journal of Experimental Marine Biology and Ecology, 384, 113-118 DOI: https://doi.org/10.1016/j.jembe.2009.12.007.
Li, J., Liu, Z., He, C., Yue, H. & Gou, S. (2017) Water shortages raised a legitimate concern over the sustainable development of the drylands of northern China: Evidence from the water stress index. Science of The Total Environment, 590-591, 739-750 DOI:
https://doi.org/10.1016/j.scitotenv.2017.03.037.
Mehrbach, C., Culberson, C.H., Hawley, J.E. & Pytkowicx, R.M. (1973) Measurement of the apparent dissociation constants of carbonic acids in seawater at atmospheric
pressure. Limnology and Oceanography, 18, 897-907 DOI:
https://doi.org/10.4319/lo.1973.18.6.0897.
Meunier, C.L., Algueró-Muñiz, M., Horn, H.G., Lange, J.A.F. & Boersma, M. (2017) Direct and indirect effects of near-future pCO2 levels on zooplankton dynamics. Marine and Freshwater Research, 68, 373-380 DOI: https://doi.org/10.1071/MF15296.
Nakazawa, M. (2014) fmsb: Functions for medical statistics book with some demographic data. R package version 0.5, 2.
Pichaud, N., William O Ballard, J., Tanguay, R. & Blier, P. (2011) Thermal sensitivity of mitochondrial functions in permeabilized muscle fibers from two populations of Drosophila simulans with divergent mitotypes. American journal of physiology, 301, R48-59 DOI: https://doi.org/10.1152/ajpregu.00542.2010.