Research Collection
Journal Article
Growth performance and metabolic changes in lambs and steers after mild nutritional restriction
Author(s):
Thomson, E. F.; Bickel, H.; Schürch, A.
Publication Date:
1982
Permanent Link:
https://doi.org/10.3929/ethz-b-000423093
Originally published in:
The Journal of Agricultural Science 98(1), http://doi.org/10.1017/S0021859600041277
Rights / License:
In Copyright - Non-Commercial Use Permitted
This page was generated automatically upon download from the ETH Zurich Research Collection. For more information please consult the Terms of use.
ETH Library
Y?ith 3 text-figures Printed in Great Britain
Growth performance and metabolic changes in lambs and steers after mild nutritional restriction
Bv E. F. THOMSON*, H. BICKEL AND A. SCHtTRCH
The Nutrition Group, Institute of Animal Production, Swiss Federal Institute of Technology, ETH-Zentrum, 8092 Zurich, Switzerland
{Revised MS. received 18 July 1981) SUMMARY
Two trials investigating compensatory growth are reported in which lambs and young cattle were placed on either a continuous (C) or a discontinuous (RR) growth path. RR animals were subjected to a phase of restricted feeding and then realimented at an equivalent level of feeding to C animals over the same live-weight range. Eight 4-month-old lambs and 30 9-month-old Swiss Brown steers were used. The restriction (I) and realimentation (II) phase covered the live-weight ranges 23-32 kg and 32-44 kg respectively in tho lamb trial and 236-310 kg and 310-460 kg respectively in the steer trial.
Fifty-six total energy balances were made with lambs using open-circuit respiration calorimetry. Fifty determinations of diet digestibility and N balance were made with steers. Lambs received a pelleted concentrate diet and, except for restrictively fed steers which received hay alone, steers were offered a diet based on maize silage.
The restriction phase of RR lambs and RR steers was longer, and the daily ME intake and daily live-weight gains were significantly lower than those of the C animals.
Compared with C lambs a marked reduction in methane production of RR lambs occurred during feed restriction which persisted throughout realimentation.
During recovery realimented lambs gained non-significantly, but realimented steers significantly, more than C animals from a similar ME intake and required less ME/kg daily live-weight gain. Realimented lambs retained more protein at the start of recovery compared with C lambs but both C and realimented steeis retained similar amounts of nitrogen. Indirect evidence is presented that suggests improved utilization of ME for protein deposition, at least at the start of realimentation.
Although the animals on the discontinuous growth path (RR) took longer to reach slaughter weight, their total intake of gross energy and overall energy conversion ratio (MJ ME/kg live-weight gain) was similar to those of animals on the continuous growth path (C).
_ maintenance requirement; second, a fall in the 1JN1KODU ON energy value of the body-weight gains and third, The ability of animals to express compensatory an increased efficiency of feed utilization. The close growth following a period of nutritional limitation interdependency between these three factors, is well documented (Wilson & Osbourn, 1960; together with level of feeding differences, and their AUden, 1970). Little doubt remains that increased individual effects on efficiency (Bickel, 1977), often appetite, and the associated gut-fill effect, is an makes it difficult to interpret the results of studies important factor responsible for compensatory on compensatory growth. For example, the growth. However, disagreement remains concerning frequently but not universally observed higher the causal involvement of the following three feed intake of compensating animals (Allden, 1970) factors in the complex of changes resulting in prevents the separation of the effects on growth compensatory growth. First, a reduction of rate of the higher feeding level from any increased
» Present address: The International Center for efficiency or decreases in the energy value of the Agricultural Research in the Dry Areas, P.O. Box 5466, gains associated with compensatory growth.
Aleppo, Syria. In 1975 a research programme was initiated at
184
E. F. THOMSON, H. BICKEL AND A. SCHUECH Steertrial 500 n
400 H
» 300 H
200 -
Lamb trial 50 n
I , 40 H
i
1
•S 30 H
2 0 -
• Phase II (Realimentation)
Phase I (Restriction)
Fig. t. Experimental plan of lamb and steer trial. , Ck lambs and steers; , Cn lambs and steers; —, RRr lambs and steers; , RRn lambs and steers; • , slaughter groups of six steers.
Zurich with the objective of ro-examining the role of the four factors in the compensatory growth complex. There wa3, furthermore, a need to investi- gate t h e performance of cattle in a semi-intensive fattening system designed to maximize the input of home-grown feedingstuffs. Such a system can involve a store period (Lortscher, Weber & Zaugg, 1975) when cattle graze summer alpine pasture and compensate in winter when offered diets based on maize silage. I n other regions cattle compensate when fed cereal-based diets during early winter following restricted growth on autumn pasture or compensate on early summer pasture following a late winter phase which enables the input of low to medium quality conserved forages.
This paper describes a metabolism trial with lambs and a growth trial with steers in which compensating animals were given the same feed allowance over the same live-weight interval as control animals on a continuous growth path. Such a design avoids t h e confounding influence of differences in level of feeding and maintenance requirements on growth performance and energy conversion ratio (MJ ME per kg live-weight gain).
Respiration and slaughter trials with cattle de- signed to examine in more detail the interactions between the various factors in the compensatory growth complex will be reported subsequently.
A comprehensive description of the trials is given elsewhere (Thomson, 1979).
MATERIALS AND METHODS Experimental plan
The plan of the lamb and the steer trial is shown in Fig. 1. Each trial involved a control (C) and a restricted-realimented (RR) group. C lambs and C
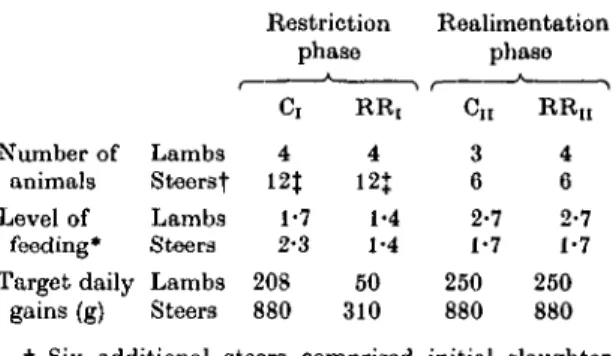
Table 1. Number of animals, level of feeding and target daily gains of respective groups
Number of animals Level of
feeding*
Target daily gains (g)
Lambs Steersf Lambs Steers Lambs Steers
Restriction phase
c,
4 12*
1-7 2-3 208 880
R R , 4 12$
1-4 1-4 50 310
Realimentation phase
( 1
Cn RRn 3 4 6 G 2-7 2-7 1-7 1-7 250 250 880 880
\ Six additional steers comprised initial slaughter group.
% Six of these steers slaughtered at end of restriction phase.
* Expresses ME intake as multiples of ME require- ment for maintenance.
steers were fed during 120 and 266 days respectively to allow continuous growth. RR lambs and RR steers were subjected to a 144- and 154-day period of mild feed restriction (phase I) respectively followed by realimentation (phase II) of 56 and 147 days respectively at the same level of feeding as C lambs and C steers.
Comparisons of performance of corresponding groups during the restriction (C, v. RR,) and realimentation phase (Cn v. R Ra animals) wore made over the same live-weight interval.
Animals. The number of animals in the respective groups of the two trials and the level of feeding are shown in Table 1. Eight 4-month-old Swiss White Alpine lambs were divided between groups C and
185
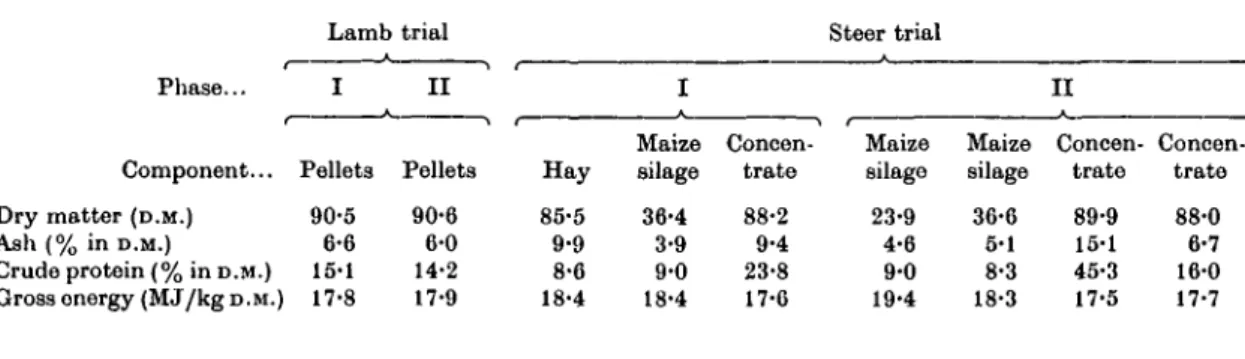
Table 2. Proximate composition of tlie diets Lamb trial Steer trial Phase.. -
Component...
Dry matter (D.M.) Ash (% in D.M.)
Crude protein (% in D.M.) Gross onergy (MJ/kg D.M.)
I
Pellets 90-5
6-6 15-1 17-8
I I
Pellets 90-6
6-0 14-2 17-9
Hay 85-5 9-9 8-6 18-4
I Maize silage 36-4
3-9 9-0 18-4
Concen- trate 88-2
9-4 23-8 17-6
Maize silage 23-9
4-6 9-0 19-4
Maize silage 36-6
5-1 8-3 18-3
I I Concen-
trate 89-9 15-1 45-3 17-5
Concen- trate 88-0 6-7 16-0 17-7
RR. They were treated against gut parasites and accustomed to the ration for 4 weeks before the trial started.
Initially 30 9-month-old Swiss Brown steers were available at the beginning of the steer trial which was based on a comparative slaughter design. Six representative steers formed an initial group and thereafter six steers from the group C and RR were slaughtered at the end of the restric- tion and realimentation phase. Thus in the steer trial groups Cj and RR
Xinvolved 12 animals each and group C
aand RR
Usix animals each.
Estimation of feed requirements. The Agricultural Research Council (1965) conventions were used to formulate the feed allowances for the lambs. The target daily shrunk body-weight gain of the lambs is given in Table 1. The steers were fed diets estimated from Ministry of Agriculture, Fisheries and Food (1975) allowances to sustain target daily live-weight gains (LWG) given in Table 1. In doing so it was appreciated that the estimated energy values of the gain used by the Ministry of Agriculture, Fisheries and Food (1975) were based on limited data which gives a further approxima- tion when applied to the dual purpose, late- maturing Swiss Brown breed. The energy value of the 3teers diets
(ME/D.M.)were estimated by multiplying the content of digestible energy by 0-82 (Agricultural Research Council, 1965).
The amount of diets fed in both trials was adjusted every 14 days according to a predeter- mined target growth schedule based on the LWG and the estimated empty-body weights at the start of the two growth phases. No correction to feed allowances were made when actual LWG deviated from the target growth schedule.
Diets. The proximate composition of the diets are given in Table 2.
Lambs were offered a pelleted cereal diet contain- ing 20 % chopped straw, 5 % molasses, 55 % rolled wheat, 8 % extracted soya-bean meal and a vitamin-mineral preinix in the restriction phase.
In the realimentation phase tho straw and soya-
bean meal were reduced to 10 and 5 % respectively, and the wheat increased to 78%. Diets I and II contained 11-7 and 12-6 MJ ME/kg D.M. respec- tively.
Apart from the RRi steers which received hay alone, all the other groups of steers were offered a diet based on maize silage balanced with appro- priate protein concentrate and vitamin-mineral premixes.
Procedures
Housing and feeding. Lambs were penned on
sawdust in a controlled environment house and steers tethered in a cowshed fitted with a wooden slatted floor. Lambs were fed at 09.00 and steers at 08.00 and 16.00 h. Daily feed intake of individual animals was recorded throughout the trials.
Measurement of heat production. Heat production
of lambs was estimated from gaseoua exchange (Brouwer, 1965) measured with open-circuit respiration equipment (Daccord, 1970; Wenk, Prabucki & Schurch, 1970). Oxygen, CO
2and CH
4concentrations were determined using a Taylor Servomex (Type AO 184) analyser, a Siemens Ultramat M and a Siemens Ultramat 2 respectively.
Heat production was measured four times on each C lamb and ten times on each RR lamb. Each measurement consisted of four consecutive 24 h determinations except the last 48 h of 9-day period of maintenance feeding and over the final 48 h of a subsequent 5-day period of fasting.
Digestibility and nitrogen balance. Excreta
collections lasted 9 and 7 days in the Iamb and steer trial respectively. Lambs were transferred in their metabolism crates to the respiration chambers for the last 4 days of each collection period. Four steers from each experimental group were placed in metabolism crates to make a total of 50 determina- tions of digestibility and nitrogen balance.
Chemical analyses. Samples of feed and excreta
were analysed for proximate components by
Weende procedures, for gross energy by bomb
calorimetry and for carbon as described by
186
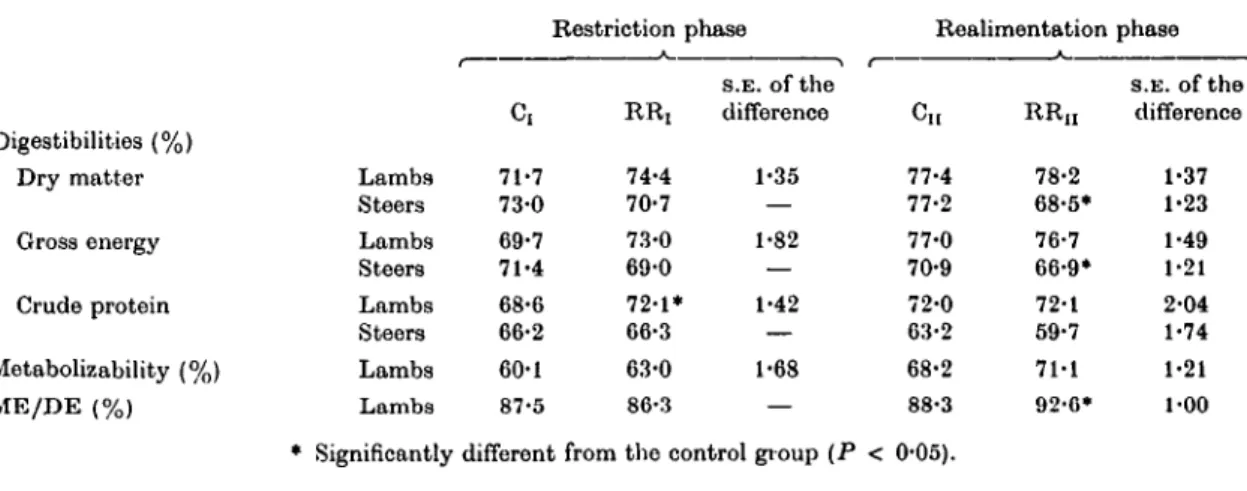
E. F. THOMSON, H. BICKEL AND A. SCHUROHTable 3. Digestibility, metabolizability and content of metabolizable energy in the digestible energy (ME/DE)
Digestibilities (%) Dry matter Gross energy Crude protein Metabolizability (%) ME/DE (%)
Lambs Steers Lambs Steers Lambs Steers Lambs Lambs
Restriction Ci
71-7 73-0 69-7 71-4 68-6 66-2 60-1 87-5
* Significantly different
RR, 74-4 70-7 73-0 69-0 72-1*
66-3 63-0 86-3
phase s.E. of the difference
1-35
— 1-82
— 1-42
— 1-68
— from the control group (P <
Realimentatior
c,,
77-4 77-2 77-0 70-9 72-0 63-2 68-2 88-3 0-05).
RR,, 78-2 68-5*
76-7 66-9*
72-1 59-7 71-1 92-0*
i phase s.E. of the
difference 1-37 1-23 1-49 1-21 2-04 1-74 1-21 1-00
Schneider (1959). Urinary energy was estimated from urinary carbon (Blaxter, Clapperton &
Martin, 1966).
Body weights. Lambs were weighed on entering and leaving the chambers 23 h after the last meal to give shrunk body weight (SBW). Apart from live-weight (W) determinations at the beginning and end of the two growth phases, all steers wore weighed every 14 days at 15.00 h, about 8 h after their last meal.
Slaughter procedures and carcass specific gravity.
At the beginning of the trial and at the end of phases I and II all steers were weighed at 05.30 h, about 13-5 h after the last meal. All were then given the morning meal, but not the afternoon meal. After the morning meal animals in the respective slaughter groups (Fig. 1) were trans- ported for about 90 min to a commercial abattoir.
These animals, and those remaining on trial, were thon weighed again about 26 h after the last meal to give shrunk body weight (SBW). Water was not available during the 26 h interval.
Immediately after the SBW determination, slaughter of respective steers took place by captive bolt. The intact alimentary canal, urinary and gall bladder was removed, weighed, emptied of all contents, rinsed out, allowed to drain and re- weighed. The weight loss represented gut contents.
Empty body weight was calculated from SBW minus gut contents.
The carcasses were weighed warm to give carcass weight and stored at 4 °C for 48 h. After halving down the centre of the vertebral column, one side was quartered between the 11th and 12th ribs, and the quarters weighed in air using com- mercial equipment to the nearest 100 g. Quarters were then immersed in water at 4 CC and ro weighed
to the nearest 100 g. Carcass specific gravity was determined as described by Lofgreen (1965), and carcass energy content from relationships between carcass specific gravity, body water and fat (Garrett & Hinmann, 1969).
Experimental problems. Because lambs often refused feed when in the respiration chambers, 11 of the 56 energy balances were discarded from the analysis since refusals exceeded 20 % of total feed offered over the 4 days in the chambers. One C lamb continuously refused significant amounts of feed and its data were excluded from the analysis.
However, at least three successful balances on each of the remaining seven lambs were made during phase II.
No intake or health problems were encountered in the steer trial.
Owing to technical difficulties during determina- tion of specific gravity at the abattoir, the specific gravity values of RR, steers had to be discarded.
Statistical analysis. The linear regression of live weight on time of the individual animals gave the best fit for estimating LWG- within phases I and II.
The intakes and performance of the group Ctv. RR], Cn v. RR,, and CI+I, v. RRI+I, were compared using Student's t test (Snedecor & Cochran, 1967).
Since there was a close relationship between digestibility and SBW in the lamb trial (Thomson, 1979), means of variables affected by this relation- ship, e.g. digestibility and metabolizability, have been adjusted to a common SBW of 38 kg during phaso II by linear interpolation.
RESULTS
Digestibility and metabolizability. The digesti- bility, metabolizability and the ratio metabolizable
187
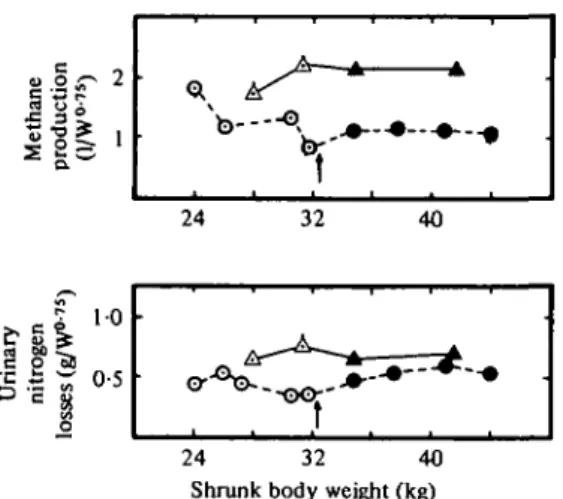
24 32 40 Shrunk body weight (kg)
Fig. 2. Daily methane production and urinary losses of lambs. A. C,j A. C,i; 0 , RRt; • R Rn; f , start of realimentation.
Table 4. Digestibility of the diet offered to steers during realimentation
Live weight S.E. oftho Period (range, kg) CH R Ri r difference 1 300-369 72-4 66-7** 1-27 2 365-405 70-3 63-6* 1-84 3 382-449 69-8 69-0 3-16 4 409-469 70-9 68-3 1-06
* Significantly different from t h e control group (P < 0-05).
** Significantly different- from the control group P < 0-01).
energy to digestible energy (ME/DE) of the diets are shown in Table 3. An improvement in the digesti- bility of the diets occurred as the lamb trial progressed. This was due to a live-weight effect rather than to a level of feeding effect or to slight change in the composition of the diet.
Methane and urinary nitrogen Ios3es were low throughout the lamb trial. Tims metabolizable energy (ME) content of the pelleted diet was between 86-3 and 92-6% of digestible energy (DE) (Table 3). Feeding the same diet to rehabilitating adult sheep, Gingins (1978) found similar results.
These values are well above the generalized value of 82 % recommended by the Agricultural Research Council (1965). Methane production of lambs declined during restricted feed intake and remained at a lower level (P < 0-05) during realimentation than in control lambs. Urinary nitrogen losses nlso
declined somewhat but increased again during realimentation (Fig. 2). Thus the significant (P < 0-05) difference in the ME/DE ratio between the two groups during phase II (Table 3) was mainly due to differences in methane production.
In the steers trial digestibility was the same for both groups in phase I (Table 3). During realimen- tation digestibility of the dry matter and energy, but not of protein, was significantly lower when determined on RRU compared with control steers.
This was due to the low digestibility of the diet during the first two periods of realimentation (Table 4).
Intakes. The restriction of feed intake during phase I was more severe in the lamb trial than in the steer trial (Table 5). During phase I I scaled intake (expressed per metabolic weight) of control and realimented lambs was similar. However, scaled D.M. intake of realimented steers was lower than that of control animals. This, together with the lower digestibility of energy (Table 3), reduced their overall scaled ME intake to 92 % of that of Cn steers.
The scaled D.M. intake of both CIt and RRn
lambs was under 80 g D . M . / W0 7 5 and therefore appetite limitations are not held responsible for the refusals when lambs were in the chambers.
Similar problems were encountered by Graham &
Searle (1975) and highlight difficulties of quantify- ing ad libitum intake of lambs confined to respira- tion chambers.
Nitrogen, protein and fat retention. Retained nitrogen per kg metabolic weight was similar for control lambs throughout the experiments (Table 6). Nutritionally restricted lambs showed lower, realimented lambs higher nitrogen retention than control lambs, although the latter difference was not statistically significant (P > 0-05). However, by analysing the different periods of phase II a considerably higher protein deposition at the start of realimentation was identified (Table 7).
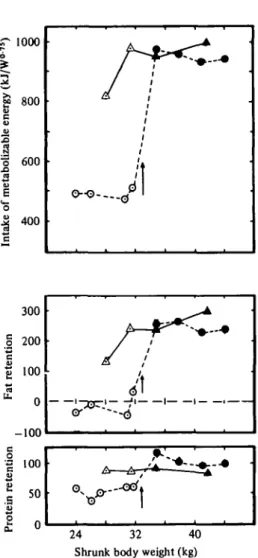
The changes in protein and fat retention in relation to ME intake are shown in Fig. 3. The RR, lambs were retaining protein at the expense of body fat, wliich remained in negative balance during the restriction phase. There was a close parallel between fat retention and ME intake throughout the trial. Fat retention of R Rn lambs reached high levels after only 14 days realimenta- tion.
The protein supplied to steers was reduced during the realimentation compared with the restriction phase in order to avoid non-specific use of dietary protein and excess urinary nitrogen losses (Table 8). Retained nitrogen was slightly, although not significantly (P > 0-05), lower in RRn steers compared with Cn steers.
Partial efficiency of utilization of ME. Tn order to
188
E. F . THOMSON, H. BICKEL AND A. SCHURCHTable 5. Scaled daily intake of dry matter, metabolizable energy and daily intake of crude protein
Daily intake of:
Dry matter (g/W0'75) Lambs
Steers
Metabolizable energy ( k J / W0 7 5) Lambs
Steersf Crude protein (g)
Lambs Steers
Ci
77-9 69-6 873 734 139 620
Restriction phase
R Rr
44-9***
60-5***
504***
621 79***
640**
s.E. of the difference
2-2 0-67 17-5
6-0 0-6
Realimentation
Ci,
78-3 72-6 945 765 166 690
RR,, 74-8 70-6*
955 701 163 670*
phase S.E. of tho difference
3-7 0-87 43-5
3-8 1-1 t Estimation from intake of digestible energy multiplied by 0"S2.
* Significantly different from control group {P < 0-05).
** Significantly different from control group (P < 0-01).
*** Significantly different from control group (P < 0-001).
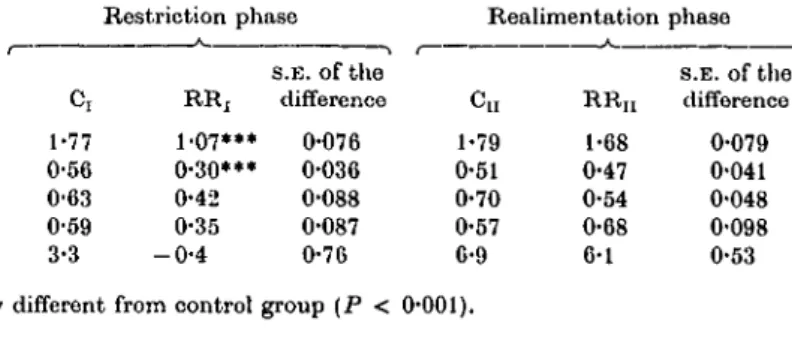
Table C. Nitrogen intake, losses and retention and fat retention in the lambs as measured during determinations of energy balance
Nitrogen intake (g/W0'") Faecal nitrogen (g/W0'76) Urinary nitrogen (g/W0'75) Retained nitrogen (g/W0'75) Fat retention (g/W0 7 6)
Ci 1-77 0-56 0-63 0-59 3-3
Restriction phase
A
s.E. of the RRj difference 1-07*** 0-076 0-30*** 0-036 0-42 0-088 0-35 0-087 - 0 - 4 0-76
Realimentation phase
Cu 1-79 0-51 0-70 0-57 6-9
R R n 1-68 0-47 0-54 0-68 6-1
s.E. of the difference 0-079 0-041 0-048 0-098 0-53 Significantly different from control group (P < 0-001).
detect possible differences in the utilization of ME between control and realimented lambs, partial efficiencies were estimated using regression proce- dures. The linear regression scaled retained energy (RE/W0 7 5) on scaled ME intake (MEI/W0") provides an estimate of the partial efficiency for gain {kpf) and the multiple regression scaled MEI on scaled energy retained as protein (REP/W0'75) and fat (REF/W0'75) allows estimation of the partial efficiency for protein (kp) and for fat deposition (k{) respectively. The data from C and R Pn lambs were analysed separately. The results of the analysis are shown in Table 9. Comprehensive original data are presented elsewhere (Thomson,
1979).
The partial efficiency for maintenance (km = 0-68) was higher thf .\ for growth (kpf = 0-56 and 0-59). kfI of the two groups (regression models 2
and 3) did not differ significantly (P > 0-05), although the regression coefficient b1 in model 3 is marginally higher than in model 2. The regression coefficient 6] in model 5 was lower than in model 4, suggesting that partial efficiency for protein deposition (kp) was higher in realimented lambs (RRU) than in control lambs (C). However, 62
shows the opposite tendency. Separately analysing the different periods of phase II showed that the partial efficiency for growth (kpf) of RR,, lambs was higher at the beginning of realimentation than of Cn lambs.
No direct estimate of efficiency of ME utiliza- tion was possible in tho steer trial. However, estimation of maintenance energy requirement (MEm) was made by regressing daily ompty-body- weight gain on MEI. Subtracting the derived ME m
from total ME intake and estimating carcass
Table 7. Changes in daily protein and fat deposition and partial efficiency of ME utilization for growth during realimentation phase of the lamb trial
Group...
Periodf
1 2 3 4
Protein (kJ/
Cu 86 88 82
deposition 'Wo-")
RR,, 116
98 93 97
Fat deposition (kJ/W0 7 6)
C RR
H238 251 238 256 299 224
— 233
Partial efficiency for growth (fcj,/)
"~ c
a 0-52 0-55 0-61R Rn
0-60 0-60 0-56 0-56 14 days interval between the periods.
24 32 40 Shrunk body weight (kg)
Fig. 3. Daily intake of metabolizable energy by lambs and retention of fat and protein. A . C , ; A.Cn; ©, RRi;
# , RRn; | , start of realimentation.
energy content from carcass specific gravity (Garrett & Hinman, 1969) allowed estimation of k
pf. The carcass specific gravity measurements from the initial and two final slaughter groups (Table 10) were used for the estimation of the carcass energy content of C and RR steers. Tho difference in the carcass energy content of the initial and final slaughter groups divided by the live weight gained over the complete trial gave an estimate of the energy value of body-weight gains (EV,). An ME
mof 462kJ/W
0 7 5was estimated, and, from an EV, of 10-5 and 9-8 MJ/kg live- weight gain for C and RR respectively, the k
pfof the two groups was 0-36 and 0-43 respectively.
Growth performance and energy conversion ratio.
The growth performance of RR, lambs and steers was highly significantly (P < 0-001) lower than controls (Table 11). Even though RR
nlambs gained 4-6 kg more shrunk body weight than C
nlambs during realimentation over a similar time interval, the difference did not reach significance (P > 0-05). The RR,, steers exhibited significantly (P < 0-05) higher live-weight gain (LWG) than C
nsteers when realimented, but when expressed as empty-body-weight gain the difference did not reach significance (P > 0-05). However, during the 1st month of realimentation the LWG of RR,, steers reached 1200 g.
Compensatory growth enabled RR,, steers to improve significantly (P < 0-01) their energy conversion ratio compared with control animals.
The difference in energy conversion ratio between RR,, and C
nlambs was not significant (P > 0-05).
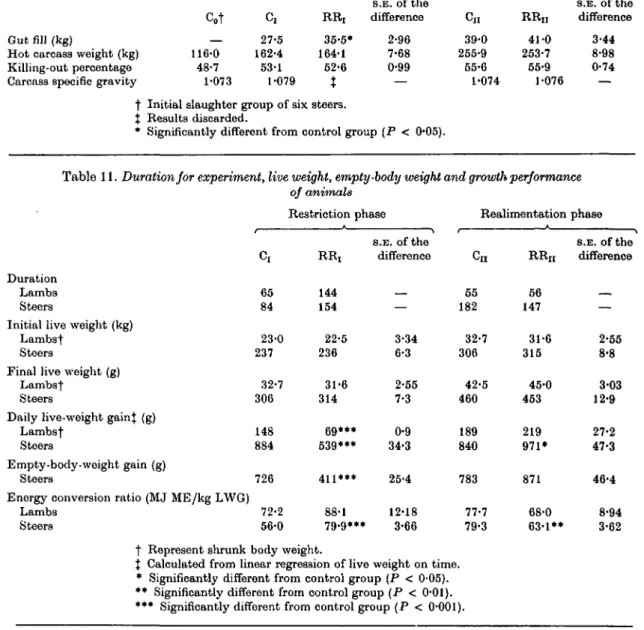
Out fill and carcass characteristics. The gut fill of
RR, steers was significantly (P < 0'05) higher than that of C, steers because the basal diet consisted of hay instead of maize silage (Table 10). There were no differences in the killing-out percentages of the various groups although killing-out percentage increased as the steers became heavier.
No differences across steer groups in carcass
specific gravity were noted.
190 E. F. THOMSON, H. BICKEL AND A. SCHURCH
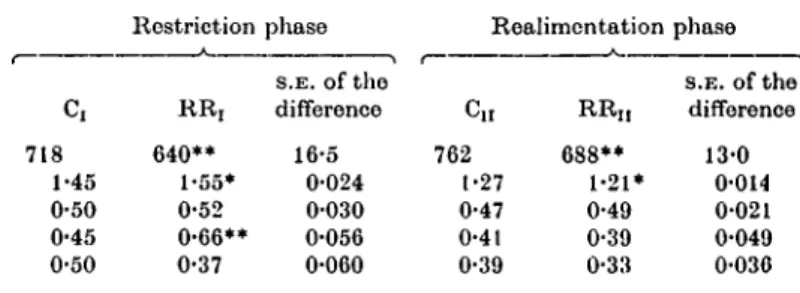
Table 8. Components of nitrogen balance in the steer trial
ME intakef (kJ/W0 7 6) Nitrogen intake (g/W076) Faecal nitrogen (g/W0'") Urinary nitrogen (g/W0'75) Retained nitrogen (g/W076)
718 1-45 0-50 0-45 0-50
Restriction
* RR, 640**
1-55*
0-52 0-66**
0-37
phase S.E. of the difference
16-5 0-024 0-030 0-056 0-060
Realimentation phase C,r
762 t-27 0-47 0-41 0-39
RR,, 688**
1-21*
0-49 0-39 0-33
S.E. of the difference
13-0 0-014 0-021 0-049 0-036 f Values differ from those in Table 5 because only 4 of 6 animals used in balance trial.
* Significantly different from the control group (P < 0'05).
** Significantly different from the control group (P < 0-01).
Overall performance. The relatively long restric- tion period in the lamb trial considerably increased the total duration of the growth period of RR lambs (Table 12). However, the compensating steers reduced the 70-day interval between the groups at the start of realimentation to 35 days at slaughter.
The milder degree compared with RR lambs resulted in only a 12 % increase in total fattening period. With regard to animals on the discontinuous growth path, RR steers required a similar amount of gross energy and RR lambs only 12• % more than the respective control groups on a continuous growth path. The overall energy conversion ratio of C and RR lambs was similar whereas RR steers required 6 % less ME per kg LWG than C steers.
DISCUSSION
Digestibility. The depression of the digestibility of the fibrous maize-silage diet measured on the realimentated steers was not due to differences in dietary composition. In contrast to the steer trial no depression of digestibility was observed in the RR lambs offered a rapidly fermentable concen- trate diet (Table 3). McManus, Reid & Donaldson (1972) and Drew & Reid (1975) also noted reduced digestibilities in compensating lambs but Asplund, Hedrick & Haugeback (1975) did not. The high digestibilities reported by Thornton et ah (1979) on the 1st day of realimentation appear to be due to applying the faecal output from the preceding period of near starvation feeding to the ad libitum intake on the 1st day of realimentation. Over the next 5 days digestibility decreased by over 20 percentage units.
In order to explain this unclear picture regarding an apparent digestibility depression at the begin- ning of realimentation, it is suggested that physio- logical changes take place in the animal which will affect digestibility only if the physical and chemical composition of the diets is appropriate. Physio-
logical changes leading to an increase in the rate of passage would, in general, have little effect on the extent of digestion of a rapidly fermentable diet (lamb trial), but could affect a more fibrous diet (steer trial). Such an increase in the rate of passage in the compensating animal is an attractive proposition since it could be associated with the elevated appetite of these animals. However, it is suggested that any relationship between appetite and rate of passage may be mediated by triiodothy- ronine (T
3) since a positive association between T
3and rate of passage (Miller et ah 1974; Kennedy, Young & Christopherson, 1977) and between T
3and energy intake (Blum, Thomson & Bickel, 1979; Blum et ah 1980; Thomson et ah 1980) has been reported.
Level of feeding and maintenance requirement.
Approximately the same scaled ME intake of Cn and RR
nanimals was achieved during realimenta- tion (Table 5). Thus, if it is assumed that the maintenance requirement (ME,,,) of control and realimented animals was similar, then their level of feeding will have been almost equivalent. Except during the immediate post-restriction phase, this assumption is probably correct since it has been shown (Graham & Searle, 1975, 1979; Gingins, 1978) that ME
rareturns to near normal levels within the first few weeks of realimentation.
It is therefore considered that in these two trials, because there were no differences in the level of feeding between groups, this factor can be dis- counted whon explaining the differences in energy conversion ratio between them.
Partial efficiency of utilization of metabolizable
energy. The overall k
plof the control and reali-
mentated lambs was similar (Table 9) which
confirms the findings of Drew & Reid (1975) and
Graham & Searle (1975, 1979) but not those of
Meyer & Clawson (1964). But at the start of
realimentation a small improvement in k
ptwas
noted in botli the lamb trial (Tablo 7) and in the
study of 0rskov et al. (1976) with early weaned j t | g S | | lambs.
° ® Empirical models for estimating kp and kt suffer from auto-correlation between the independent
v m i> variables. Therefore, it is hazardous to conclude
* ' ' ' S % directly from the results of the models 4 and 5 in Table 9, that the ME was utilized more efficiently for protein deposition by RRU lambs compared jiR | | I s ? ? with CIt lambs. However, an improved kp at the
» o o start of realimentation of lambs is suggested.
g The estimated kpf in the steer trial (p. 189)
.2 g g I | I | indicated that steers during realimentation may bo
"o1 * 6 more efficient converters of ME than steers on a
•S continuous growth path.
§ ^_" Carcass characteristics and energy value of gain.
05 .,6> ǡ *~ Ǥ ǡ " Tlie design of the trials precludod the influence of
* u py ?*• " CO CO CO CO
§ g ^ 6b gut fill on daily live-weight gain of realimontod
* •* *' ci "S;- animals. The carcass specific gravity values
§ H 'I £ JS (Table 10) showed little variation between slaughter g m c o m i ^ t o r - PH H ^ * O groups and are similar to values derived from the g *" 6 6 6 6 6 "?' £ .§ "3 reports of Robelin (1975) in which Charolais bulls I »' • S J2 o were used. However, because the differences in fat
*j „ H W <§ "" ° content between slaughter groups of the late
<2 , di o o o - H t o m ^ ^ T) fi J maturing breeds are likely to be small, accuracy of
^ " i ? " 2 S K 2 •*""?" a j - § measurement is essential since an error of 0-002 in
"^ 2 J S0^ - •* S carcass specific gravity can lead to a 1 % change in
"S* II II I x g predicted fat content (Berg & Butterfield, 1976).
1 "2" © • « " • §f ia Furthermore there are no relationships for the late s « »1 I | | S H « 2 S i S - H ' S maturing breeds which enable prediction of carcass
•^ i ! ~ ' 9 . "lS . ^ ^ j £ s composition from specific gravity. Subsequent S TI •• S S § studies in this series at Zurich should provide such
*£• -? ^ ^ „ — „ § ^ C e B information.
.§ «"» S o S o o o o o o o M. § o co Th e uPw a rd shift in the realimentation between 'g +1 6 O 6 6 6 6 M O I N 6 •H"'* 'Z'St live-weight gain and ME intako/W0 7 5 of the RRU
•S "3 ~S j i § 3 ^ steers is similar to the shift found in the trial of
«? ? t ~ _ t o a 5 - 1 | ^ I "S B. M e v e r
' Weitkamp & Bonilla (1965) and Fox et al.
" - » o > o o S i o b S g g ^,'3 ^"-^ (1972). It is suggested that a fall in the energy
• f i "0" - . IM ?! J< n m . S . S - B S ' C J S value (EVB) of the live-weight gain could have e ^ i I l l 8 I "«pq ^ caused this shift. Any tendency to increase tlie N-, g> g1 w S CTCH protein: fat ratio, or the water: protein ratio
| » , » £ , £ , O 3 P 5 # - I - P H « (0rskov & McDonald, 1976) would have such an
* effect. There were indications in the lamb trial that slightly more protein than fat may have been deposited during realimentation (Table 6) and that the EVt of refed steers may have decreased. If it is correct to assume a similar level of feeding and partial efficiency between control and realimented steera, then the decrease in EVf of roalimented steers may have been the principal factor respon- sible for their improved energy conversion ratio during realimentation.
Overall efficiency. It is well established that tho duration of the fattening period of sheep and cattlo on a discontinuous growth path will exceed that of animals on a continuous growth path. However,
t n o t w 0 t r
'al s reported here show that the associa- ted increase in maintenance requirement was offset by a considerable reduction in the production
•a
0 a
rou
O
§
C o
1.
o o
s W
PS"
+g
A A
oo
a P5P5
o
w
s PS
A
P5P5CO
W
PS6 P5
o w
s PS +
1-1
PSPS
192
E. F. THOMSON, H. BICKEL AND A. SCHTJRCHTable 10. Out fill, hot carcass weight, killing-out percentage and carcass specific gravity of steers
Gut fill (kg)
Hot carcass weight (kg) Killing-out percentage Carcass specific gravity
Cot 116-0
48-7 1-073
Restriction
c,
27-5 162-4 53-1 1-079
R R j
35-5*
164-1 52-6
t
phase
S.E. of the difference
2-96 7-68 0-99
—
Reahmentation C«
39-0 255-9 55-6 1-074
RR,, 41-0 253-7 55-9 1-076
phase
S.E. of the difference
3-44 8-98 0-74
— Initial slaughter group of six steers.
Results discarded.
Significantly different from control group (P < 0-05).
Table 11. Duration for experiment, live weight, empty- of animals
Duration Lambs Steers
Initial live weight (kg) Lambst
Steers
Final live weight (g) Lambst
Steers
Daily live-weight gain} (g) Lambst
Steers
Empty-body-weight gain (g) Steers
Energy conversion ratio (MJ ME/kg LWG) Lambs
Steers
c,
65 84 23-0 237
32-7 306 148 884 726 72-2 56-0
•body weight and growth performance
Restriction phase RR, 144 154 22-5 236
31-6 314
69***
539***
411***
88-1 79-9***
S.E. of the difference
—
3-34 6-3 2-55 7-3 0-9 34-3 25-4 12-18
3-66
Realimentation Cn
55 182 32-7 306
42-5 460 189 840 783 77-7 79-3
R Rn
56 147 31-6 315
45-0 453 219 971*
871 68-0 63-1**
phase
S.E. of the difference
—
2-55 8-8 3-03 12-9 27-2 47-3 46-4 8-94 3-62 t Represent shrunk body weight.
% Calculated from linear regression of live weight on time.
* Significantly different from control group (P < 0-05).
** Significantly different from control group (P < 0-01).
*** Significantly different from control group ( P < 0-001).
Table 12. Total duration, daily body-weight gains, total energy intake and energy con- version ratio of lambs and cattle on a continuous and discontinuous growth path
Lambs Steers
Days
Daily body-weight gainst (g) Gross energy intake (GJ) Metabolizable energy intake (GJ)
Energy conversion ratio (MJ ME/kg LWG)
c
120 160
2-23 1-46 77-6
R R 200
110*
2-49 1-67*
77-6
S.E. of the difference
13-5 0-107 0-077 8-22
C 266 848
28-04 16-14 71-9
RR 301 758*
28-04 15-43*
67-8
S.E. of the difference
36-6 0-488 0-274 2-52 t Based on shrunk body weight and live weight in lamb and steer trial respectively.
193
requirement. Thus total gross energy intake and ovorall onorgy conversion ratio of the two groups of lambs and steers was similar (Table 12). This was possible because a moderate rate of growth of the control steers was chosen to maximize the intake of home-grown feeds (Thomson, Lohmann &
Bickol, 1978).
It is concluded that at this level of intensity animals fattened on a discontinuous growth path, which involvos a 'store' period followed by com-
pensatory growth will not necessarily require a greater input of feed energy than animals on a continuous growth path. Including such a 'store' period enabled a reduction of the total concentrato input from 295 to 140 kg per steer.
The two trials reported here were supported by a grant from the Office of Agriculture of the Swiss Federal Department of Public Economy, Berne.
REFERENCES AGRICULTURAL RESEARCH COUNCIL (1965). TheNxilrient
Requirements of Farm Livestock. No. 2 Ruminants, London: Agricultural Research Council.
ALLDISN, W. G. (1970). The effects of nutritional deprivation on the subsequent productivity of sheep and cattle. Nutrition Abstracts and Reviews 40, 1167-1184.
ASPLUND, J. M., HEDRICK, H. B. & HAUGEBACK, C. D.
(1975). Performance, digestibility and 40K levels in lambs during compensations for feed restriction.
Journal of Animal Science 40, 138-143.
BERO, R. T. & BUTTERI-IELD, A. M. (1976). New
Concepts of Cattle Growth. Sydney University Press.
BICKEL, H. (1977). Tho feed intake-conversion complex in cattle production witli particular reference to tho efficiency of energy utilization. (In German witli English summary.) Schweizerische Landwirtschaftliche Forschung 15, 175-214.
BLAXTKR, K. L., CLAPPERTON, J. W. & MARTIN, A. K.
(1966). The heat of combustion of the urine of sheep and cattle in relation to its chemical composition and to diet. British Journal of Nutrition 20, 449-460.
BLUM, J. W., GINGINS, M., VITINS, P. & BICKEL, H.
(19S0). Thyroid hormone levels related to energy and nitrogen balance during weight loss and regain in adult sheep. Ada Endocrinologica 93, 440-447.
BLUM, J. W., THOMSON, E. F. & BICKEL, H. (1979).
Alterations of serum triiodothyronine levels during roduced and compensatory growth of steers. Zeit- schrift fur Tierphysiologie, Tiererndhrung und Futter- millelkunde 42, 7-11.
BROUWER, E. (1965). Report of sub-committee on constants and factors. In Energy Metabolism of Farm Animals (ed. K. L. Blaxter), pp. 441-443. London and Now York: Academio Press.
DACCORD, R. (1970). Influence d'un supplement de foin a un aliment concentre sar le metabolisme energ6ticiuo du mouton. Doctoral thesis No. 4324 ETH Zurich.
DREW, K. R. & R E I D , J . T. (1975). Compensatory growth in immature sheep. III. Feed utilization by sheep subjected to foed deprivation followed by rcalimontation. Journal of Agricultural Science, Cambridge 85, 193-204.
Fox, D. G., DOCKERTY, T. R., JOHNSON, R. R. &
PRESTON, R. L. (1972). Relationship of ompty body weight to carcass weight in beef cattle. Journal of Animal Science 43, 565-568.
GARRETT, W. N. & HINMAN, N. (1969). Re-evaluation of the relationship betwoen carcass density and body
composition of beef steers. Journal of Animal Science 28, 1-5.
GINGINS, M. (1978). The efficiency of the body weight loss-regain process in the adult ruminant. (In French with English summary.) Doctoral Thesis No.
6228 ETH Zurich.
GRAHAM, N. MCC. & SEARLE, T. W. (1975). Studies of weaner sheep during and after a period of weight stasis. I. Energy and nitrogen utilization. Australian Journal of Agricultural Research 26, 343-353.
GRAHAM, N. MCC. & SEARLE, T. W. (1979). Studies of weaned lambs before, during and after a period of weight loss. I. Energy and nitrogen utilization.
Australian Journal of Agricultural Research 30, 513-523.
KENNEDY, P. M., YOUNG, B. A. & CHRISTOPHERSON,
R. J. (1977). Studies on the relationship between thyroid function, cold acclimation and retention time of digesta in sheep. Journal of Animal Science 45, 1084-1090.
LORTSCHER, H., WEBER, R. & ZAUGG, U. (1975}.
Compensatory growth of dairy heifers after a period of alpine pasturing. Proceedings of the 3rd World Conference on Animal Production, pp. 242—245.
Sidney University Press.
LOFGREEN, G. P. (1965). A comparative slaughter technique for determining net energy values for beefs cattle. Proceedings of the 3rd Symposium on Energy Metabolism, pp. 309-317. London and New York:
Academic Press.
MCMANUS, W. R., REID, J. T. & DONALDSON, L. E.
(1972). Studios of compensatory growth in sheep.
Journal of Agricultural Science, Cambridge 79, 1-12.
MEYER, J. H. & CLAWSON, W. J. (1964). Undornutrition and subsequent realimentation of rats and sheep.
Journal of Animal Science 23, 214-224.
MEYER, J. H., WEITKAMP, W. H. & BONILLA, S. (1965).
Compensatory growth responses of fattening steers following various low energy intake regimes of hay or irrigated pasture. Journal of Animal Science 24, 29-32.
MILLER, J. K., SWANSON, E. W., LYKE, W. A., Moss,
B. R. & BYRNE, W. F. (1974). Effect of thyroid status on digestive tract fill and flow rate of undigested residues in cattle. Journalof Dairy Science 57,193-197.
MINISTRY OF AGRICULTURE, FISHERIES AND FOOD
(1975). Energy allowances and feeding systems for ruminants. Ministry of Agriculture, Fisheries and Food, Technical Bulletin, no. 33. London: H.M.S.O.
AGS 98
194
E. F . THOMSON, H. BICKEL AND A. SCHTIRCH 0BSKOV, E. R. & MCDONALD, I. (1976). The effects ofchanging from a low to a high protein diet on growth, body composition and energy utilization of lambs.
In Energy Metabolism of Farm Animals (ed. M.
Vermorel). Clermont Ferrand: G. de Busac.
0KSKOV, E. R., MCDONALD, I., GBUBB, D. A. &
PENNIE, K. (1976). The nutrition of the early weaned lamb. IV. Effects on growth rate, food utilization and body composition of changing from a low to a high protein diet. Journal of Agricultural Science, Cam- bridge 86, 411-423.
ROBELIN, J . (1975). Relation entre le volume de la carcasse des bovins et les poids de sea differents composants anatomique ou chimique. Annales de Zootechnie 24, 403-412.
SCHNEIDER, W. (1959). Die Bestimmung der Kohlens- toffgehalte von biologischen Substanzen mit Hilfe eines registrierenden Leitfahigkeitsmessgerates.
Landwirtschaftliche Forschung 12, 214-218.
SNEDECOR, G. W. & COCHBAN, W. G. (1967). Statistical Methods, 6th edn. Iowa University Press.
THOMSON, E. F. (1979). Energy metabolism of sheep and cattle during compensatory growth. Doctoral thesis, no. 6382, ETH Zurich.
THOMSON, E. F., GINOINS, M., BLUM, J . W., BICKEL, H.
& SCHUBCH, A. (1980). Energy metabolism of sheep during nutritional limitation and realimentation.
Proceedings of the 8th Symposium on Energy Metabo- lism, pp. 427-430. London: Butterworth.
THOMSON, E. F., LEHMANN, E. & BICKEL, H. (1978).
The performance of steers fattened with rations high in home-grown feedatuffs with or without a grazing period. Zeitschrift fur Tierphysiologie, Tiererndhrung und Futtermittelkunde 42, 237-240.
THORNTON, R. F., HOOD, R. L., JONES, P. N. & R E ,
V. M. (1979). Compensatory growth in sheep.
Australian Journal of Agricultural Research 30, 135-151.
WENK, C , PRABUCKI, A. L. & SCHURCH, A. (1970).
Beschreibung einer Apparatur zur automatischen Durchfuhrung von Respirationsversuchen an Schafen und Schweinen. Mitteilungen aus dem Qebiet der Lebensmitteluntersuchung und Hygiene 61, 378—387.
WILSON, P. N. & OSBOURN, D. F. (1960). Compensatory growth after undernutrition in mammals and birds.
Biological Review 35, 324-363.