https://doi.org/10.5194/bg-16-1019-2019
© Author(s) 2019. This work is distributed under the Creative Commons Attribution 4.0 License.
Phytoplankton calcifiers control nitrate cycling and the pace of transition in warming icehouse and cooling greenhouse climates
Karin F. Kvale1, Katherine E. Turner1,2, Angela Landolfi1, and Katrin J. Meissner3,4
1GEOMAR Helmholtz Centre for Ocean Research, West shore campus, Duesternbrooker Weg 20, Kiel, Germany
2Dept. of Earth, Ocean, and Ecological Sciences, Univ. of Liverpool, Nicholson Building, 4 Brownlow St., Liverpool, UK
3Climate Change Research Centre, Level 4 Mathews Building, UNSW, Sydney, Australia
4ARC Centre of Excellence for Climate Extremes, Sydney, Australia Correspondence:Karin F. Kvale (kkvale@geomar.de)
Received: 31 October 2018 – Discussion started: 26 November 2018
Revised: 24 February 2019 – Accepted: 1 March 2019 – Published: 14 March 2019
Abstract. Phytoplankton calcifiers contribute to global car- bon cycling through their dual formation of calcium car- bonate and particulate organic carbon (POC). The carbonate might provide an efficient export pathway for the associated POC to the deep ocean, reducing the particles’ exposure to biological degradation in the upper ocean and increasing the particle settling rate. Previous work has suggested ballasting of POC by carbonate might increase in a warming climate, in spite of increasing carbonate dissolution rates, because cal- cifiers benefit from the widespread nutrient limitation aris- ing from stratification. We compare the biogeochemical re- sponses of three models containing (1) a single mixed phy- toplankton class, (2) additional explicit small phytoplank- ton and calcifiers, and (3) additional explicit small phyto- plankton and calcifiers with a prognostic carbonate ballast model, to two rapid changes in atmospheric CO2. The first CO2 scenario represents a rapid (151-year) transition from a stable icehouse climate (283.9 ppm) into a greenhouse cli- mate (1263 ppm); the second represents a symmetric rapid transition from a stable greenhouse climate into an icehouse climate. We identify a slope change in the global net pri- mary production response with a transition point at about 3.5◦C global mean sea surface temperature change in all models, driven by a combination of physical and biologi- cal changes. We also find that in both warming and cool- ing scenarios, the application of a prognostic carbonate bal- last model moderates changes in carbon export production, suboxic volume, and nitrate sources and sinks, reducing the long-term model response to about one-third that of the cal-
cifier model without ballast. Explicit small phytoplankton and calcifiers, and carbonate ballasting, increase the physi- cal separation of nitrate sources and sinks through a com- bination of phytoplankton competition and lengthened rem- ineralization profile, resulting in a significantly higher global nitrate inventory in this model compared to the single phy- toplankton type model (15 % and 32 % higher for icehouse and greenhouse climates). Higher nitrate inventory allevi- ates nitrate limitation, increasing phytoplankton sensitivity to changes in physical limitation factors (light and temper- ature). This larger sensitivity to physical forcing produces stronger shifts in ocean phosphate storage between icehouse and greenhouse climates. The greenhouse climate is found to hold phosphate and nitrate deeper in the ocean, despite a shorter remineralization length scale than the icehouse cli- mate, because of the longer residence times of the deep water masses. We conclude the global biogeochemical impact of calcifiers extends beyond their role in global carbon cycling, and that the ecological composition of the global ocean can affect how ocean biogeochemistry responds to climate forc- ing.
1 Introduction
The importance of pelagic calcifiers to the marine carbon cycle is well-established (recently summarized by Balch, 2018). Their production of calcium carbonate contributes 1.08–1.60 Pg C yr−1to the ocean as particulate inorganic car-
bon (PIC; Balch, 2018). This estimate is only 1 %–3 % of the total annual primary production (Balch, 2018), but a global average carbonate content of 34 % in ocean sediments (Archer, 1996) suggests a disproportionately large role of PIC for deep-sea carbon export.
It has been proposed that sinking PIC provides protection against microbial remineralization to associated POC and in- creases its sinking rate (Armstrong et al., 2002). This “ballast hypothesis” is supported by satellite and sediment trap anal- yses that suggest an increase in organic carbon transfer effi- ciency occurs in the presence of PIC (Francois et al., 2002), and by a tight correlation between POC and PIC found in the traps (Armstrong et al., 2002; Klaas and Archer, 2002). Up to 83 % of global POC export below 1000 m water depth is associated with PIC (Klaas and Archer, 2002). However, the exact mechanisms that couple inorganic and organic carbon particle export and their impact on ballasting remain debated (discussed in the recent paper by Rosengard et al., 2015).
Wilson et al. (2012) failed to find a robust and globally uni- form relationship between sediment trap PIC and POC when taking into account spatial variability in their samples. Pas- sow and De La Rocha (2006) took a mechanistic approach and demonstrated that inclusion of minerals in organic car- bon aggregates decreased the particles’ volume and poros- ity, but caused the particles to fragment at high mineral con- centrations. They suggested a complex relationship between mineral content and organic carbon export and proposed that POC in fact ballasts PIC (Passow and De La Rocha, 2006).
However, a more recent study of sampled carbon fluxes by Rosengard et al. (2015) generally supports the PIC-ballasts- POC hypothesis. Whatever the coupling mechanism, it is possible to represent a robust correlation between PIC and POC deep-ocean export in ocean biogeochemical models us- ing the simple Armstrong et al. (2002) ballasting framework.
This has been done by Kvale et al. (2015a), who introduced a model of explicit small phytoplankton and calcifiers, and prognostic calcium carbonate to the University of Victoria Earth System Climate Model (UVic ESCM; Weaver et al., 2001). This model associates a fixed fraction of calculated POC export with a fraction of PIC export, increases the asso- ciated POC particles’ sinking rate, and stops remineralization (Armstrong et al., 2002). Quasi-thermodynamic dissolution of PIC “releases” a proportionate amount of ballasted POC, slowing its sinking rate and starting remineralization (Kvale et al., 2015a). The net effect is a lengthened remineraliza- tion profile for PIC-associated POC, which is supported by sediment trap data (e.g., Rosengard et al., 2015). This ballast scheme significantly improves the representation of ocean ni- trate in the UVic ESCM (Kvale et al., 2015a) with respect to World Ocean Atlas nitrate (Garcia et al., 2009) for reasons discussed in the following sections.
Early work on ocean acidification suggested the ballast effect is at risk from ocean acidification weakening phyto- plankton calcification rates (Riebesell et al., 2000); however, these concerns have since been reduced by studies demon-
strating net increases in calcification and primary produc- tion with increasingpCO2(Iglesias-Rodriguez et al., 2008), adaptability of phytoplankton calcifiers to acidified condi- tions (Lohbeck et al., 2012; Liu et al., 2018), adaptability of primary producer assemblages to acidification (Hoppe et al., 2018), and field evidence of historical increases in calcifica- tion over the past 200 years (Iglesias-Rodriguez et al., 2008).
Looking into the geological record, coccolithophores were more robust (Bolton et al., 2016) and more ubiquitous in warmer, more acidic oceans of the past (Hannisdal et al., 2012).
Recent observed expansion of coccolithophore habitat (Neukermans et al., 2018) agrees with ecological model- ing of explicit phytoplankton calcifiers in a warming (Kvale et al., 2015b) and more acidified environment (Furukawa et al., 2018). Coccolithophores have lower nutrient require- ments than many other phytoplankton species, which in- creases their relative fitness as circulation slows and the sur- face ocean stratifies (Kvale et al., 2015b). There may be a benefit to their expansion over hundred-year timescales in a warming future; a modeling study suggests carbonate ballast- ing has a stabilizing effect on export production, reducing the long-term decline in deep-ocean export relative to a model where ballasting is not included, even when export losses due to ocean acidification are considered (Kvale et al., 2015b).
This stabilization of export production occurs because an in- creasing proportion of the exported POC is protected from near-surface remineralization by PIC, which slows the tran- sition into a more “heterotrophic” export regime (relatively larger primary production and near-surface export values than modern but smaller deep-ocean export fluxes). Con- tinued carbon and nutrient export to the deep ocean damps the response of ocean primary production and remineraliza- tion to near-surface warming by removing nutrients from fast upper-ocean recycling (Kvale et al., 2015b).
A damped increase in remineralization, which consumes oxygen, should also slow the expansion of suboxic volume in a warming ocean. This mechanism linking PIC ballast to ocean suboxia was identified previously by Hofmann and Schellnhuber (2009) in the context of projected losses of PIC ballast due to ocean acidification increasing remineralization rates and suboxic volume. Kvale et al. (2015b) found the op- posite effect by PIC ballasting on changes in ocean suboxia in a warming climate because in their model, ocean acidifi- cation did not significantly reduce PIC export.
Hofmann and Schellnhuber (2009) described an ocean suboxic volume control by PIC ballasting that has the po- tential to change in a changing climate. We describe an addi- tional and previously unrecognized control by phytoplankton calcifiers on ocean biogeochemistry that also arises from PIC ballasting. By stabilizing suboxic volume, calcifiers mitigate changes in global ocean nitrogen fixation and denitrification rates during rapid changes in climate. Also in our model, competition with other phytoplankton types and the longer remineralization length scale due to PIC ballasting increases
global nitrate inventory by spatially separating nitrogen fixa- tion from denitrification (described by Landolfi et al., 2013, as the “vicious N cycle”). This effect increases in warmer cli- mates in which calcifiers benefit from more nutrient-limited conditions and compose a greater proportion of the total phy- toplankton biomass. In contrast to primary production, ex- port production, and suboxia, ocean phosphate storage be- comes more sensitive to rapid changes in climate when calci- fiers and PIC ballasting are included explicitly. Larger shifts in phosphate storage occur because all phytoplankton are less nitrate limited and are therefore more sensitive to changes in physical limitation factors (light and temperature). We ex- plore this control in two sets of idealized experiments: a rapid icehouse-to-greenhouse transition and a rapid greenhouse- to-icehouse transition. The physical responses of the ocean circulation to the atmospheric CO2forcing are described in Kvale et al. (2018).
2 Methods
For our experiment, we use UVic ESCM version 2.9 (Weaver et al., 2001; Meissner et al., 2003; Eby et al., 2009; Schmit- tner et al., 2005, 2008). The experimental setup is iden- tical to that of Kvale et al. (2018, and described below);
the current study is an expansion of the ramp-up (icehouse- to-greenhouse warming) and ramp-down (greenhouse-to- icehouse cooling) analyses documented there to include the ocean biogeochemical model outputs from the same data files. We employ the same three biogeochemical model configurations (MIXED, CAL, and NOCACO3TR) used in Kvale et al. (2015b, also described below).
Our climate model contains an ocean model, land and veg- etation components, dynamic–thermodynamic sea ice model, and sediments. The atmosphere is represented by a two- dimensional energy–moisture balance model. Winds are pre- scribed from monthly NCAR/NCEP reanalysis data and are adjusted geostrophically to surface pressure changes calcu- lated based on temperature anomalies (Weaver et al., 2001).
Continental ice sheets are fixed to a modern configuration (Weaver et al., 2001). The horizontal resolution is 3.6◦lon- gitude×1.8◦latitude, and there are 19 vertical levels in the ocean.
The standard UVic ESCM version 2.9 includes a NPZD (nutrients–phytoplankton–zooplankton–detritus) sub- model with “mixed phytoplankton” and “diazotroph” phyto- plankton functional types and one “zooplankton” functional type (Schmittner et al., 2008). The MIXED model config- uration is the standard UVic ESCM NPZD submodel, up- dated with the changes made by Keller et al. (2012). The CAL model configuration builds upon MIXED and addition- ally includes a “small and calcifying phytoplankton” func- tional type (simplified to “calcifiers” throughout this paper) and a prognostic CaCO3 tracer (Kvale et al., 2015a). This prognostic CaCO3tracer includes a POC-ballasting param-
Table 1.Summary of ecosystem components for each model con- figuration. Abbreviations are as follows: particulate organic carbon (POC), calcium carbonate (CaCO3), mixed phytoplankton (P), dia- zotrophs (D), zooplankton (Z), and small phytoplankton and calci- fiers (C).
Model Carbon Plankton
export functional
tracers types
MIXED Free POC P, D, Z
NOCACO3TR Free POC P, D, C, Z
CAL Free POC, ballast P, D, C, Z POC, CaCO3
eterization in which a fixed fraction of calcifier-associated POC is “protected” from water column remineralization and exported from the surface at the CaCO3 sinking rate. It is released back into the “free” POC pool at the rate of dissolu- tion of CaCO3. The NOCACO3TR model configuration only includes the additional “small and calcifying phytoplankton”
functional type and does not include the prognostic CaCO3 tracer. This intermediary model is used to distinguish be- tween model behavior arising due to phytoplankton competi- tion from that arising due to the use of the prognostic CaCO3 tracer. Table 1 summarizes relevant biogeochemical model tracers and functional types for the three model configura- tions used here. Additional model details can be found in Kvale et al. (2015a, b).
We first integrate the three model configurations (MIXED, NOCACO3TR, and CAL) for more than 20 000 years in two climate configurations to achieve six equilibrium cli- mate states. The first climate configuration, for the ramp- up simulations (hereafter, WARMING), equilibrates the bio- geochemical models with an atmospheric CO2concentration of 283.9 ppm and represents an icehouse climate. The sec- ond, for the ramp-down simulations (hereafter, COOLING), equilibrates the biogeochemical models with an atmospheric CO2 concentration of 1263 ppm to represent a greenhouse climate. Solar and orbital forcing are prescribed at modern levels in all configurations. Ocean nitrate concentration is al- lowed to evolve from the balance between nitrogen source (phytoplankton nitrogen fixation) and sink (denitrification).
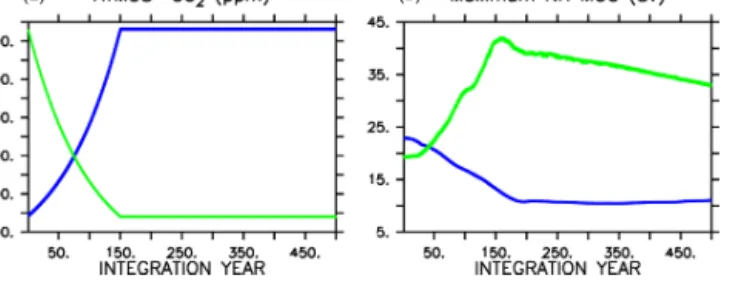
We then force each respective climate configuration with a 1 % per year increase (for WARMING) or 1 % per year decrease (for COOLING) in atmospheric CO2concentration for 151 years (Fig. 1). Each model is then integrated an ad- ditional 349 years, keeping atmospheric CO2concentrations fixed at year 151 levels (1263 ppm in the case of WARM- ING, and 280 ppm in the case of COOLING). No non-CO2 greenhouse gas forcings are included in the simulations.
Figure 1.Atmospheric CO2forcing used for WARMING icehouse (blue) and COOLING greenhouse (green) experiments (a), and maximum Northern Hemisphere meridional overturning(b). Dot- ted lines represent the MIXED model, thin dashed lines represent the NOCACO3TR model, and thick dashed lines represent the CAL model. The physical responses of the models to WARMING and COOLING forcing are nearly identical.
3 Simulation results
As in Kvale et al. (2015b), the physical responses of the three biogeochemical model configurations to each set of radia- tive forcings are nearly identical. The CAL model COOL- ING displays a slight difference in physical response rela- tive to the other two (Fig. 1) due to a significantly longer spinup (100 KY as opposed to 20 KY), in which internal drift resulted in small differences in initial state. In WARM- ING, global ocean ventilation shoals and maximum North- ern Hemisphere overturning declines from about 20 Sv at year 1 to about 11 Sv at integration year 400 (Kvale et al., 2018). Global average surface air temperature increases by more than 6.8◦C, but the maximum of zonal average upper- ocean temperatures increases by as much as 8.6◦C by year 500 (Kvale et al., 2018). Antarctic Bottom Water formation collapses (Kvale et al., 2018). In COOLING, the greenhouse ocean starts with an initial average temperature nearly 6◦C warmer than the icehouse ocean, and the greenhouse atmo- sphere is nearly 7◦C warmer (Kvale et al., 2018). Merid- ional overturning accelerates rapidly in both hemispheres in COOLING, with maximum Northern Hemisphere over- turning exceeding 40 Sv by year 150, and maximum South- ern Hemisphere overturning strengthening to nearly 20 Sv (Kvale et al., 2018). Stronger overturning is accompanied by a dramatic deepening and expansion of ventilation sites in the Southern Ocean, North Pacific, and North Atlantic (Kvale et al., 2018).
3.1 Calcifiers and ballasting mitigate changes in global carbon export
Large changes occur in carbon export (Fig. 2) in all models in WARMING and COOLING, as the models transition be- tween more “autotrophic” and more “heterotrophic” export regimes (Kvale et al., 2015b). The more autotrophic export regime is the initial WARMING state and final COOLING state, and is qualitatively described as a regime in which
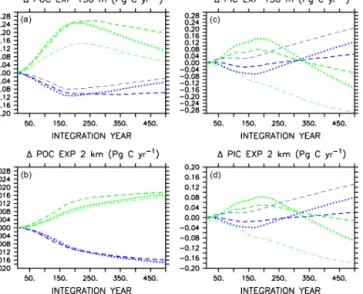
moderate amounts of POC and PIC are produced and ex- ported from the surface, and remineralize/dissolve in the deep ocean. The more heterotrophic export regime is the ini- tial COOLING and final WARMING states, in which larger amounts of POC and PIC are produced in the upper ocean, but less POC survives upper-ocean remineralization to reach the deep ocean. Figure 2 presents change in POC and PIC for each model, where each model has unique absolute POC and PIC export values (therefore, we do not assign specific POC and PIC export values to categorize export regimes). Addi- tional information is supplied as an appendix (Appendix A) that provides more insight into these regime transitions. In WARMING, early small declines in near-surface POC export (around 0.1 Pg C yr−1) occur in all models due to declining net primary production (NPP) prior to the transition into a more heterotrophic regime (see Appendix A for a descrip- tion of NPP responses). Around year 170, near-surface POC export starts to increase in models that do not include ballast- ing as near-surface stratification starts to reduce (stratifica- tion being a transient feature in WARMING that diminishes near the end of the simulation, not shown), SSTs continue to warm, and heterotrophic rates continue to increase. Alle- viated stratification, as well as increased nutrient recycling, drives an increase in NPP (and POC) in these models (Kvale et al., 2015b). However, the inclusion of PIC ballast in CAL causes near-surface POC export not to increase because the expanding calcifier population provides protection to an in- creasing proportion of the total POC from near-surface rem- ineralization (Fig. 2 and Kvale et al., 2015b). Protection of POC from near-surface remineralization by PIC reduces the amount of particle breakdown in the near-surface area, which reduces the availability of dissolved nutrients available for new primary production, thus mitigating a potential increase in near-surface POC export as the model becomes increas- ingly heterotrophic. Deep-ocean POC export does not re- cover from early declines and remains lower than the initial value for the duration of the WARMING simulation in all models, with an average export decline of 0.016 Pg C yr−1at year 500. PIC export drops in the near-surface area and in the deep ocean in CAL and MIXED as a response to initial de- clines in NPP (the NPP of calcifiers in CAL, and the NPP of mixed phytoplankton in MIXED) and then recovers as NPP increases in all models. A mitigated PIC export increase in CAL compared to the other two models (i.e., less than one- third of the NOCACO3TR response) is due to a combination of a mitigated NPP increase and increasing PIC dissolution rates with increasing ocean acidification. The magnified re- sponse in PIC export in NOCACO3TR is a result of the mag- nified NPP response in this model, with calcifiers responding favorably to stratification.
In COOLING, MIXED and CAL models show increases in POC and PIC export at all depths prior to the transition to the more autotrophic export regime (Fig. 2). This is driven by the temporary increase in NPP in both models, which is a result of the upward mixing and advection of nutrients
Figure 2. Change in globally integrated annual POC (a, b)and PIC(c, d)export in WARMING icehouse (blue) and COOLING greenhouse (green) experiments. Dotted lines represent the MIXED model, thin dashed lines represent the NOCACO3TR model, and thick dashed lines represent the CAL model.
(see acceleration of overturning in Fig. 1). Interestingly, NO- CACO3TR experiences a decline in NPP over this period but an increase in POC export. An increase in POC export con- current with a decline in NPP reflects decreasing respiration rates. Why this occurs only in NOCACO3TR becomes ap- parent by examining the PIC export plots, which show a de- cline in PIC at all depths in this model only. In the model, PIC export production is calculated as a fixed fraction of POC ex- port production from calcifiers and zooplankton only. There- fore, a decline in PIC can occur as a response to a loss of calcifiers and zooplankton but still accompany an increase in POC produced by mixed phytoplankton and diazotrophs.
Early losses of calcifiers result in a magnified response in the NOCACO3TR model (again, a response in shallow – 130 m depth – PIC more than 3 times larger than that of CAL by year 500, and a more rapid decline in shallow POC than that in CAL over the last 250 years of the simulation). Over the last 250 years of the simulations, all models simulate declines in shallow POC and shallow and deep (2 km depth) PIC as NPP declines and they transition into the more autotrophic export regime. Deep-ocean POC export increases as cooling temperatures reduce respiration rates.
In both WARMING and COOLING, a mitigating effect on the transition between export regimes (the last 250 years of the simulations) is apparent in the CAL model. In WARM- ING, this mitigation is due to the increasing ballast effect, which reduces the response of near-surface POC export, and surface and deep-ocean PIC export, to less than one-third that of NOCACO3TR. In COOLING, this mitigation is partly due to the loss of calcifiers and consequent declining bal- last effect in the high latitudes (Fig. A3), which leaves an
Table 2.Initial ocean nitrate inventory in Pmol N.
Model 283.9 ppm CO2 1263 ppm CO2
MIXED 37.11 29.78
NOCACO3TR 39.45 32.23
CAL 42.65 39.10
increasing proportion of POC exposed to near-surface res- piration, thus reducing the global rate of decline of NPP and POC export. Also, a mutually beneficial relationship between diazotrophs and calcifiers establishes in the low latitudes in COOLING. Calcifiers ballast carbon and nutrients away from the surface. Denitrification occurs in this region, so up- welled water is depleted with respect to nitrate. This ben- efits diazotrophs, who produce nitrate that is quickly recy- cled. Calcifiers have lower nutrient requirements than mixed phytoplankton and disproportionately take advantage of the newly fixed nitrate. This relationship does not establish in the NOCACO3TR model because, in the absence of ballast- ing, high remineralization rates allow nutrients to be recycled closer to the surface, where denitrification does not occur.
The mitigated response in CAL might also be partly driven by a substantially higher nitrate inventory (15 % higher in WARMING and 32 % in COOLING relative to MIXED; Ta- ble 2), which globally enhances NPP despite cooling temper- atures (see the strongest and most widely distributed mixed phytoplankton COOLING response in CAL; Fig. A3). The causes of this enhanced inventory are explored in Sect. 3.3.
3.2 Calcifiers and ballasting mitigate changes in suboxic volume and nitrate
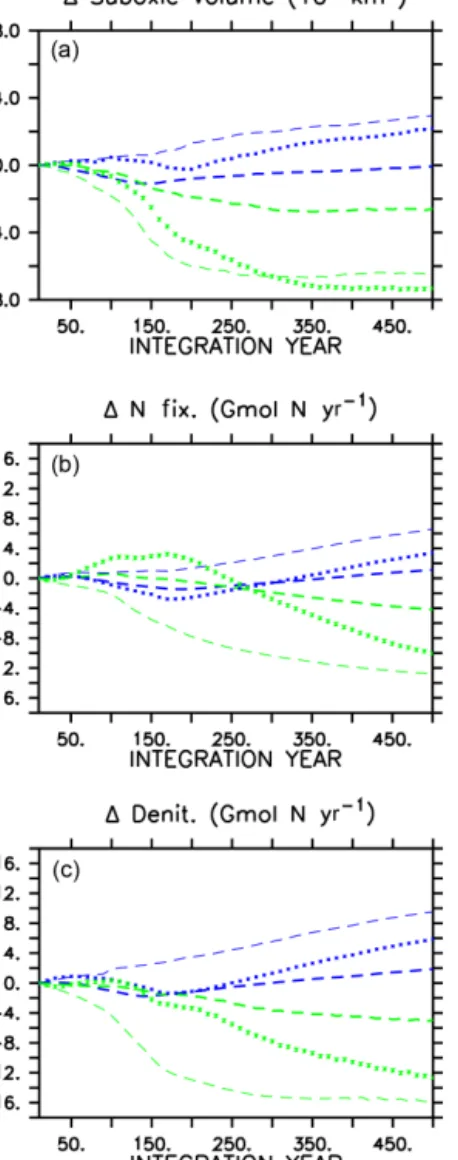
A consequence of mitigated changes in carbon (and asso- ciated nutrient) export is the mitigated response of suboxic (defined here as below 5 mmol O2m−3) volumes (Fig. 3). In all models, ocean oxygen is consumed by POC remineral- ization; therefore, smaller changes in POC produce smaller changes in oxygen consumption. In all WARMING models, suboxic volume increases after the transition to the more het- erotrophic export regime, but in the CAL model the suboxic volume at year 500 is basically the same as at year 1, whereas in the other two models the suboxic volume has grown sub- stantially (42 % increase in MIXED, 75 % increase in NO- CACO3TR). Likewise, in COOLING, in all models a de- cline in suboxic volume occurs with enhanced vertical mix- ing and ocean cooling but with the CAL model experiencing the smallest decline (50 % versus 56 % in MIXED, 71 % in NOCACO3TR by year 500).
Changes in suboxic volume regulate changes in denitrifi- cation (Fig. 3), which occurs in our model within suboxic zones. The mitigating effect of including a ballast model is apparent in a comparison of the denitrification rates in the three models’ WARMING and COOLING, where the
Figure 3.Change in globally integrated suboxic volume in WARM- ING icehouse (blue) and COOLING greenhouse (green) exper- iments (a). Change in globally integrated nitrogen fixation (b).
Change in globally integrated denitrification(c). Dotted lines rep- resent the MIXED model, thin dashed lines represent the NO- CACO3TR model, and thick dashed lines represent the CAL model.
smallest changes in denitrification occur in the CAL model (again, an eventual change less than one-third that of the NOCACO3TR response in both WARMING and COOL- ING). The smallest changes in nitrogen fixation also oc- cur in the CAL model because the combination of ballast- ing and competition between calcifiers and diazotrophs miti- gates increases in the diazotroph population. Diazotrophs do not have as large a competitive advantage in CAL because the calcifiers efficiently export the phosphate out of their growth zones. However, a destabilizing effect on suboxia, denitrification, and nitrogen fixation is apparent when includ- ing explicit calcifiers without ballasting (NOCACO3TR in Fig. 3). These larger changes in nitrate sources and sinks between icehouse and greenhouse biogeochemical regimes
occur as a result of the competition between diazotrophs, mixed phytoplankton, and calcifiers. In WARMING, the NO- CACO3TR calcifiers expand in the low latitudes and pro- duce detritus, which remineralizes; this consumes oxygen in already low-oxygen regions, accelerating the expansion of suboxia and resultant denitrification. The calcifiers simulta- neously benefit diazotroph populations by reducing the lat- eral export of phosphate out of the low latitudes, increasing nitrogen fixation by more than 6 Gmol N yr−1by year 500.
The largest responses in NOCACO3TR nitrate sources and sinks together produce the largest decline in ocean nitrate in- ventory in the NOCACO3TR model (about 900 Tmol N by year 500, not shown, compared to 800 Tmol N in MIXED and 100 Tmol N in CAL). In COOLING, the NOCACO3TR calcifiers rapidly decline, accelerating the contraction of sub- oxic volume and decline of denitrification. Nitrogen fixa- tion also declines the most dramatically in NOCACO3TR (by more than 12 Gmol N yr−1 by year 500). However, the MIXED model experiences the largest increase in nitrate inventory in COOLING (a gain of 1800 Tmol N by year 500, not shown, compared to about 1650 Tmol N in NO- CACO3TR and 500 Tmol N in CAL). This is due to the tem- porary increase in N fixation in the first 200 years of the MIXED simulation.
3.3 Calcifiers and ballasting enhance nitrate inventory and transfer of phosphate
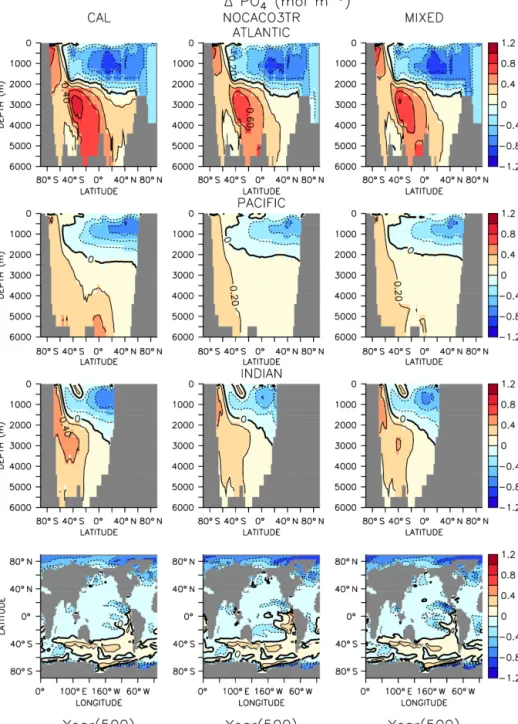
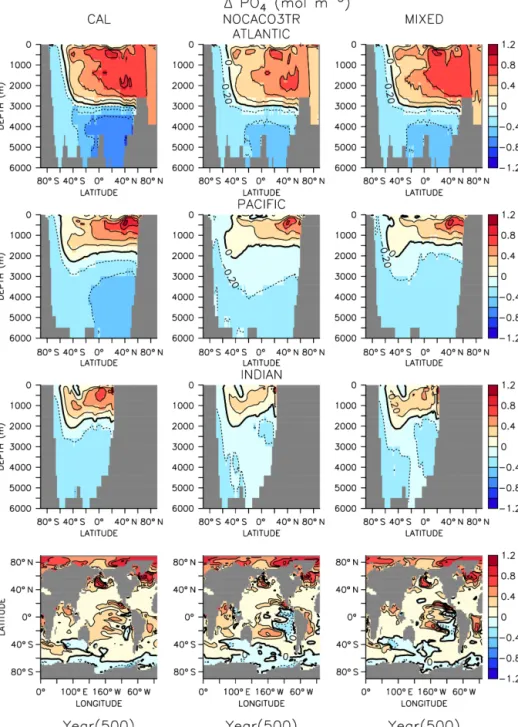
In all models, changes in ocean circulation, as well as changes in biological rates, produce strong shifts in nutrient storage in both WARMING and COOLING oceans (Figs. 4 and 5). In WARMING, slowing circulation, a poleward shift in NPP, and increasing respiration rates move phosphate and nitrate into the deep-ocean basins via the Southern Ocean (see discussion of the physical response in Kvale et al., 2018). The largest increases in deep-ocean phosphate (zonal average increase of more than 0.6 mol m−3) and nitrate con- centrations occur in the Atlantic Basin, which experiences a dramatic shoaling of overturning (from extending to the depth of the basin to extending less than 3000 m by year 150;
Kvale et al., 2018). Antarctic Bottom Water (AABW) for- mation slows, which increases the residence time of parti- cles and allows for more complete remineralization, increas- ing the dissolved nutrient concentrations of the deep wa- ter masses. Phosphate is conserved in all models; therefore, increased inventory in the deep oceans must also accom- pany decreased inventory in the upper ocean (up to about 1 mol m−3 in zonal profiles). Strong declines in the upper ocean also occur in nitrate as suboxic volume increases, which increases denitrification rates (Fig. 3) faster than in- creasing diazotroph production can compensate. It is inter- esting that, in spite of shoaling remineralization, which ought to increase the amount of nutrients held shallower in the wa- ter column, the net effect of climate warming is a deepen- ing of nutrient storage. Deeper nutrient storage contrasts the
Figure 4.Zonally averaged changes in phosphate concentration over the WARMING simulation. Bottom row shows changes at the surface.
physics-dominated trend in DIC, which is an increase in DIC storage in the upper ocean (Kvale et al., 2018). The differ- ences between DIC and phosphate storage trends illustrate the importance of where the changes in sources and sinks occur; the largest increases in biomass occur in the South- ern Ocean (see Fig. A2 in the Appendix), where AABW for- mation weakens (Kvale et al., 2018). An increased propor- tion of the global primary production occurring in the South- ern Ocean, combined with a slowing of AABW, sequesters an increasing proportion of the phosphate inventory in the deep ocean. However, ocean DIC uptake is more spatially
distributed, and thus storage has a different spatial pattern, at least under the transient conditions examined here. Model pre-existing DIC (DIC not due to rising atmospheric CO2 concentrations) storage follows the spatial pattern of nutri- ents and is increasingly stored in the deep ocean, as described by DeVries et al. (2017).
In COOLING, phosphate (Fig. 5) and nitrate concentra- tions rapidly increase (phosphate change of about 1 mol m−3 in zonal profiles) in the upper half of ocean basins and de- crease (zonal average decrease of more than 0.6 mol m−3) in the deeper regions. A deepening of ventilation and accel-
Figure 5.Zonally averaged changes in phosphate concentration over the COOLING simulation. Bottom row shows changes at the surface.
eration of meridional overturning (Kvale et al., 2018) mixes nutrient-rich deep water upwards and nutrient-depleted shal- low water down in all models. The strongest response is again found in the Atlantic Basin, where maximum overturn- ing exceeds 40 Sv by year 150 (Kvale et al., 2018). In addi- tion to accelerated overturning, a decline in NPP, paired with only small net increases in POC export production (and de- clines in PIC export) by year 500 in all models, also encour- ages increased upper-ocean nutrient storage in COOLING.
Again, increased near-surface nutrient storage is counterin- tuitive with a deepening remineralization length scale.
In both WARMING and COOLING, the CAL model dis- plays the largest changes in phosphate and nitrate storage.
This fact does not contradict the model mitigating changes in export fluxes. Maintenance of effective deep-ocean export in CAL WARMING should logically increase deep-ocean nu- trient inventory. Maintenance of ineffective deep-ocean ex- port in CAL COOLING should logically increase shallow ocean nutrient inventory. However, a separate process might also be driving the larger nutrient storage response in CAL.
As was noted earlier, the CAL model contains a larger ni- trate inventory than the other models (Table 2). This larger
nitrate inventory is produced during model spinup by a bet- ter spatial separation of nitrate production and denitrification.
Close spatial association of these two processes has been demonstrated to lead to system-wide N loss (Landolfi et al., 2013). Competition between calcifiers, mixed phytoplank- ton, and diazotrophs increases the separation between these processes in NOCACO3TR, leading to a modest increase in nitrate inventory. This increased separation occurs because calcifiers generally outcompete mixed phytoplankton in the low-latitude regions also inhabited by diazotrophs, but it is not a one-to-one replacement of mixed phytoplankton by cal- cifiers because calcifiers have lower nutrient requirements (this results in more calcifiers). These lower nutrient require- ments cause calcifiers to also replace diazotrophs in regions where a faster growth rate produces an advantage (the re- gions between the gyres and the equatorial upwelling zones), which reduces the diazotroph population and separates them spatially from denitrification regions. The CAL model ad- ditionally separates nitrogen fixation from denitrification in the vertical space by reducing ocean suboxic volumes and lengthening the remineralization length scale via ballast pro- tection. This reduction of “vicious N loss” (Landolfi et al., 2013) in the CAL model produces substantially higher ni- trate inventory than in the other models in the greenhouse ocean. Because at an annual scale the models are almost uni- versally nitrate limited, this additional nitrate inventory en- ables a stronger NPP response in all phytoplankton types in COOLING CAL. More nitrate available for photosynthesis means more phosphate is also taken up and therefore ex- ported (or in the case of COOLING, rapidly remineralized).
4 Discussion
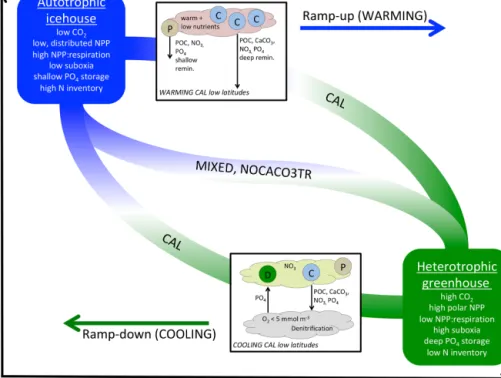
Taken together, WARMING and COOLING simulations us- ing the three model configurations (CAL, NOCACO3TR, and MIXED) produce a lot of information on both icehouse and greenhouse climate transitions as well as biogeochemi- cal controls related to the application of calcifiers and explicit PIC ballasting. These controls are summarized in Fig. 6. The icehouse ocean is characterized by low atmospheric CO2, deep overturning circulation dominated by the North At- lantic, a more autotrophic regime (lower rates of NPP with a high NPP : respiration ratio, distributed across latitudes, lower PIC and POC export, not shown, with a high pro- portion of POC exported to the deep ocean), low suboxic volume, high nitrate inventory, and shallower nutrient stor- age. The greenhouse ocean is characterized by high atmo- spheric CO2, strong overturning circulation distributed be- tween the Northern Hemisphere and Southern Hemisphere, a more heterotrophic regime (higher rates of NPP with a low NPP : respiration ratio, high production at polar latitudes, high PIC and POC export, not shown, but a low proportion of the POC reaching the deep ocean), high suboxic volume, lower nitrate inventory, and deeper nutrient storage.
The biogeochemical transition between icehouse and greenhouse climate states follows a pathway that maps to changes in temperature and ocean circulation. All models’
biogeochemistry becomes increasingly sensitive to the ef- fects of temperature (changing biological rates) as they ap- proach the greenhouse state, and increasingly sensitive to the effects of circulation (changing nutrient availability) as they approach the icehouse state. The quasi-symmetric response of ocean phosphate and nitrate storage in moving between icehouse and greenhouse states presents a counterintuitive example of competing temperature and circulation effects. In WARMING, remineralization rates increase and overturning circulation slows, which allows for more complete reminer- alization of particles. Therefore, in WARMING, migration of NPP towards the poles (and the Southern Ocean particularly) produces a strong export of dissolved phosphate and nitrate to the deep ocean. Polar deep water formation regions have a high sequestration efficiency (the length of time regenerated nutrients are stored in the interior before being returned to the surface; DeVries et al., 2012) and a high shallow ocean par- ticle transfer efficiency (the fraction of POC export surviving respiration above 1000 m depth; DeVries and Weber, 2017), so increasing NPP in these regions increases the storage of nutrients in the deep water masses downstream. In COOL- ING, migration of NPP towards the low latitudes, as a re- sponse to the flushing of nutrients from the deep ocean, pro- duces a strong migration of phosphate to the upper–middle latitude gyres and near-surface low latitudes. This occurs in spite of cooling temperatures reducing remineralization rates and a globally increased ocean ventilation, which together ought to reduce the amount of remineralization in the upper ocean and increase particle transfer efficiency. Even with de- clining remineralization rates, the particle transfer efficiency of the gyres and low latitudes remains low (the efficiency is low even in a modern climate, DeVries and Weber, 2017), causing upper-ocean nutrient concentrations to rise.
The spatial pattern in the shift in nutrient storage does not look like that of the dissolved inorganic carbon (DIC) anomaly from the same set of experiments, described in Kvale et al. (2018). DIC exchanges with the atmosphere and enters the ocean in WARMING through more distributed pathways, whereas phosphate and nitrate transport is strongly dominated by the Southern Ocean. However, COOLING anomalies of nutrient storage and DIC are more similar in that all share a common source of the deep ocean. Similarly counterintuitive anthropogenic carbon uptake responses to changing global circulation have been identified by DeVries et al. (2017). Their, and our, findings highlight the complex- ities of physical and biogeochemical changes that go beyond simple predictions of the global carbon and nutrient storage response to changing remineralization depths (e.g., Kwon et al., 2009; Meyer et al., 2016; Landolfi et al., 2017).
Inclusion of calcifiers and a ballast parameterization slows the rate of the transition in both directions. In WARMING, calcifiers outcompete mixed phytoplankton in the warming
Figure 6.A qualitative depiction of biogeochemical controls of calcifiers in WARMING and COOLING simulations. The biogeochemical transition between the two productivity regimes (yaxis) occurs along a pathway of changes to temperature and ocean circulation, which are driven exclusively by forcing of atmospheric CO2in our simulations (xaxis). Calcifiers control the pace of the biogeochemical transition through two mechanisms: PIC ballasting of POC and ecological competition. Application of explicit calcifiers and a PIC ballast model slows the pace of transition in both directions and reduces the magnitude of the total equilibrated change in suboxic volume, N inventory, and particle export. Application of explicit calcifiers, without ballasting, enhances the pace of transition along the pathway in both directions. Inset into the figure are diagrams depicting the low-latitude nutrient exchange between calcifiers (C) and mixed phytoplankton (P) in WARMING, and diazotrophs (D) and calcifiers (C) in the CAL model in COOLING. Calcifiers export carbon and nutrients with both ballasted and non-ballasted particles. In WARMING, calcifiers benefit from warming and stratification and efficiently export particles for deep-ocean remineralization and dissolution. This inhibits the recycling of nutrients in the near-surface area to form regenerated production by other phytoplankton (P), slowing the transition into greenhouse climate conditions. In COOLING, low-latitude denitrification reduces the nitrate content in upwelled water, which promotes the growth of diazotrophs. The fixed nitrate is used by the calcifiers, and thus both phytoplankton types benefit each other. Mixed phytoplankton (P) also benefit from nitrate fertilization, though the effect is smaller.
low latitudes in NOCACO3TR and CAL, maintaining NPP and PIC export, while it declines in MIXED due to changes in circulation. As the model transitions towards heterotrophy, PIC ballasting mitigates rapid increases in NPP, PIC, and POC export production, the expansion of suboxia, and the loss of nitrate. However, explicit calcifiers without ballast- ing enhance the transition by increasing the NOCACO3TR model NPP and POC response to warming. In COOLING, explicit calcifiers without ballasting again enhance the tran- sition by outcompeting diazotrophs, while heterotrophy still dominates, rapidly decreasing NPP, POC, and PIC produc- tion and export via surface nitrate limitation. However, in- clusion of a ballast model in CAL slows the rate of transition in COOLING by reducing surface nitrate limitation. This mitigation of nitrate limitation occurs through two mecha- nisms: (1) strong separation of nitrogen fixation and denitri- fication regions maintains a higher global nitrate inventory, and (2) ballasting of nutrients by PIC maintains a lower ni-
trate surface concentration, which encourages the growth of diazotrophs. A secondary effect of the higher nitrate inven- tory in the CAL model is a stronger response in phosphate storage to WARMING and COOLING transitions, as lower nitrate limitation increases the phytoplankton’s ability to take up and export phosphate.
Unfortunately, the idealized nature of our model simula- tions have no direct real-world analog, and common under- standing of greenhouse ocean nitrogen cycling is extremely limited (e.g., Kuypers et al., 2004; Junium and Arthur, 2007;
Junium et al., 2018). Rapid warming of the Paleocene–
Eocene Thermal Maximum (PETM; about 56 Ma) was ac- companied by rapidly expanding marine suboxia in the open ocean and some major reorganization of nitrogen cycling that left an isotopically similar signature to ocean anoxic events, possibly with an enhanced role of nitrogen fixers (Junium et al., 2018). Studies ofδ15N for past ocean anoxic events suggest an increase in nitrogen fixation (Kuypers et al., 2004;
Junium and Arthur, 2007), which would generally support our finding of overall higher nitrogen fixation in the green- house climate, and increasing N fixation in a warming ice- house climate. The mechanisms we identify regarding ni- trogen cycling broadly agree with those outlined by Tyrrell (1999); Kuypers et al. (2004); Junium and Arthur (2007);
enhanced denitrification rates produce an overall lower N in- ventory, but high phosphate concentrations in upwelled water (our greenhouse ocean contains a vigorous overturning and deep ventilation) stimulate diazotrophy.
It is important to remind the reader that the UVic ESCM does not currently account for any potential effect of pH or alkalinity on biological calcification. Therefore, increases (decreases) in primary production result in corresponding in- creases (decreases) in calcium carbonate production. This as- sumption might or might not be valid at a global scale, in which a large diversity of calcifier species is exposed to rapid changes in pH and alkalinity (e.g., Balch, 2018; Krumhardt et al., 2017; Monteiro et al., 2016). How rates of forcing compare to rates of changes to global carbonate weathering might also determine the legitimacy of our assumption (Bach et al., 2015). We acknowledge that pH-dependent calcifica- tion could lead to different sensitivities that might result in different conclusions than what we find here (i.e., the CAL model would respond to forcing more like the NOCACO3TR model). However, the CAL model does account for thermo- dynamic dissolution so that CaCO3dissolution rates increase with decreasing pH (Kvale et al., 2015a).
The dominance and distribution of coccolithophores have been shown to vary roughly proportionally to atmospheric pCO2over the past 50 million years, with coccolithophores being bigger, more dominant, and widespread during peri- ods of highpCO2(Hannisdal et al., 2012). It has been hy- pothesized that efficient particle sinking by coccolithophores maintains their ideal growth conditions by increasing ocean oxygen, which increases the availability of metal cofactors required for their growth (Meyer et al., 2016). A similar feed- back has also been speculated surrounding the evolution- ary rise of eukaryotes; more efficient particle sinking effi- ciently oxygenated the global ocean, reduced phosphate in- ventory, and further encouraged the development of complex life (Lenton et al., 2014). In our model, we do not find total ocean oxygen to be higher in the CAL model (not shown), but we do find the CAL model contains the smallest suboxic volume of the three model configurations. This suggests an additional stabilizing mechanism brought about by efficient particle export: the increased ocean inventory and stabiliza- tion of bioavailable nitrogen. Higher ocean inventory of ni- trate potentially benefits most phytoplankton, but calcifiers in a greenhouse ocean would benefit disproportionately due to their lower nutrient requirements, allowing them to thrive in oligotrophic conditions.
Our simulations present a highly idealized framework for exploring the multifaceted problem of ocean biogeochem- istry and climate. As is discussed in Kvale et al. (2018),
the WARMING simulation bears some resemblance to what might be expected in a rapid anthropogenically induced cli- mate warming scenario, but the COOLING simulation is more theoretical because any rapid decline in atmospheric CO2would be accompanied by a rapid flushing of ocean car- bon to the atmosphere, thus maintaining high atmospheric CO2. Furthermore, we do not critically analyze changes in ocean alkalinity, which might also exert a significant con- trol on calcification over geological timescales (e.g., Bolton et al., 2016) (i.e., in greenhouse climates). Greenhouse cli- mates likely also experienced different iron availability as well as weathering conditions, which we neglect in this study.
Iron availability can affect the severity of the “vicious N cy- cle” (Moore and Doney, 2007) through the same spatial sep- aration mechanism as additional competition by calcifiers.
While we apply a static iron mask to both icehouse (WARM- ING) and greenhouse (COOLING) climates, we do not sim- ulate an evolving iron cycle.
5 Conclusions
Our model simulations demonstrate that calcifiers exert sig- nificant control on marine nitrogen cycling through a com- bination of competition and improved particle export ef- ficiency. This control is apparent in both steady-state ice- house and greenhouse climates, in which calcifiers maintain a higher inventory of nitrate, as well as in transitions between states, in which the gain or loss of calcifiers due to competi- tion affects global particle export response to climate change.
Application of calcifiers (including ballasting) slows the bio- geochemical transition between more autotrophic icehouse and more heterotrophic greenhouse productivity regimes be- cause of this control on the nitrogen cycle.
We additionally demonstrate the importance of consider- ing both changes in biological rates as well as changes in physical circulation state in the simulation of net biogeo- chemical response to climate forcing. Accumulation of nu- trients in the deep ocean in a greenhouse climate, in spite of shoaling remineralization profiles, and accumulation of nu- trients in the upper ocean in an icehouse climate, in spite of lengthening remineralization profiles, are surprising results.
The importance of changing biological rates, as well as phys- ical environment, to transitions between more autotrophic and more heterotrophic productivity regimes is also appar- ent in the quasi-symmetry of the global NPP transition we describe.
Code and data availability. Model data and postprocessing scripts are available from https://thredds.geomar.de/thredds/catalog/
open_access/kvale_et_al_2018_bg/catalog.html (last access:
11 March 2019). Model code is available from the authors upon request.
Appendix A: Transitionary response of global integrated NPP
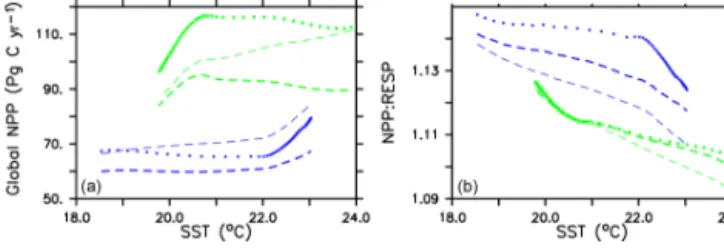
Global integrated net primary production (NPP) changes little with increasing sea surface temperatures (SSTs) in WARMING (Fig. A1) until after global average SSTs exceed 22◦C or after about 3.5◦C change. We note the similarity in the WARMING/COOLING transition point SST anomaly but cannot identify it as a tipping point without additional tests of different rates of forcing and equilibrium states. The drivers of NPP response before and after this threshold tem- perature change are explored in Kvale et al. (2015b). In Kvale et al. (2015b), the temperature threshold was found to be be- tween 2 and 4◦C average SST change; the clearer transition point in the present study is likely due to the more structured nature of the CO2forcing used here (rapid increase, then a sudden stabilization). Before the transition point, the ocean circulation response to increasing atmospheric CO2 drives the NPP trend (Kvale et al., 2015b). Surface stratification limits nutrient resupply from the deep ocean, and nutrient limitation spreads. The MIXED model shows a slight decline in NPP with increasing SSTs because the mixed phytoplank- ton are increasingly phosphate limited in the low latitudes (not shown). The models including explicit calcifiers do not experience a global decline in NPP because the calcifiers are able to take advantage of spreading nutrient limitation and their range expands (Fig. A2 and Kvale et al., 2015b). After the threshold 3.5◦C SST change is crossed in WARMING, enhanced upper-ocean biological rates become an increas- ingly important driver of global NPP (Kvale et al., 2015b).
NPP rapidly increases in all model configurations (Fig. A1).
Likewise, the ratio of NPP to upper-ocean (top 130 m) het- erotrophic rates (a total of microbial fast recycling, zooplank- ton digestion, and particle remineralization, termed “respira- tion” here and in Kvale et al., 2015b) declines at an acceler- ating rate (Fig. A1). Rapid remineralization shoals the rem- ineralization length scale, quickly recycling nutrients higher in the water column and making them available to primary producers on a shorter timescale. Mixed phytoplankton in the Southern Ocean become increasingly nutrient, rather than light, limited (not shown). In CAL and NOCACO3TR, calci- fiers expand their range in the North Atlantic. In all models, mixed phytoplankton increase in concentration in both polar oceans and in the Southern Hemisphere middle latitudes. Di- azotrophs increase in the low latitudes. Zooplankton respond to increasing food availability and their biomass increases in the high latitudes and Southern Hemisphere.
In COOLING, global NPP demonstrates a more model- specific response, though a threshold temperature is again apparent below 21◦C or after about 3.5◦C of global average SST cooling (read the green lines right to left in Fig. A1). As in WARMING, the early period of relatively small changes in global NPP lasts roughly until CO2forcing is stabilized, and is again driven by a combination of physical and bio- logical processes. Slight increases in global NPP occur in the
Figure A1.Globally integrated annual net primary production and average sea surface temperature transient response in WARMING icehouse (blue) and COOLING greenhouse (green) experiments from start to finish of each simulation(a). Globally integrated an- nual NPP divided by gross respiration in the upper 130 m and av- erage sea surface temperature, from start to finish of each simula- tion(b). Dotted lines represent the MIXED model, thin dashed lines represent the NOCACO3TR model, and thick dashed lines repre- sent the CAL model.
CAL and MIXED models as the global trend is dominated by an increase in low and middle-latitude Northern Hemisphere mixed phytoplankton biomass (Fig. A3). NPP increases in this region, as a response to the upward mixing of nutrients that occurs with the acceleration of meridional overturning, combined with relatively high SSTs (Kvale et al., 2018) that maintain high rates of respiration (Fig. A1). A decline in global NPP in the first 150 years of COOLING in the NO- CACO3TR model reflects the decline in diazotrophs in the low latitudes over this time (Fig. A3). All models experi- ence rapid declines in global NPP, and rapid increases in the NPP : respiration ratio, after the SST threshold is crossed, as cooling temperatures and slowing overturning (Kvale et al., 2018) reduce nutrient availability and biological rates. We in- terpret this to indicate a transition into a more “autotrophic”
regime, in which near-surface respiration has a reduced role in driving primary production.
In the MIXED model, diazotrophs respond strongly to in- creasing surface phosphate concentrations. The nitrate inven- tory is smaller in this model than in the other two (see Table 2 and described below), which places mixed phytoplankton at more of a relative disadvantage with respect to diazotrophs than in the other models. However, mixed phytoplankton ex- ploit the nitrate produced by diazotrophs so effectively that they are phosphate limited in parts of the low latitudes at the start of COOLING (not shown). This phosphate limitation subsides as more deep phosphate reaches the surface ocean and as sea surface temperatures cool and NPP slows.
In NOCACO3TR, inclusion of calcifiers increases ecolog- ical competition between phytoplankton types. Calcifiers re- quire both nitrate and phosphate for production, which is a handicap with respect to diazotrophs, but their growth rate is faster. Calcifiers grow slower relative to mixed phytoplank- ton but take advantage of lower nutrient requirements. The net response in calcifier biomass is a small increase in the first 150 years of COOLING in the Northern Hemisphere and along the Great Calcite Belt (an observed region of high coc-
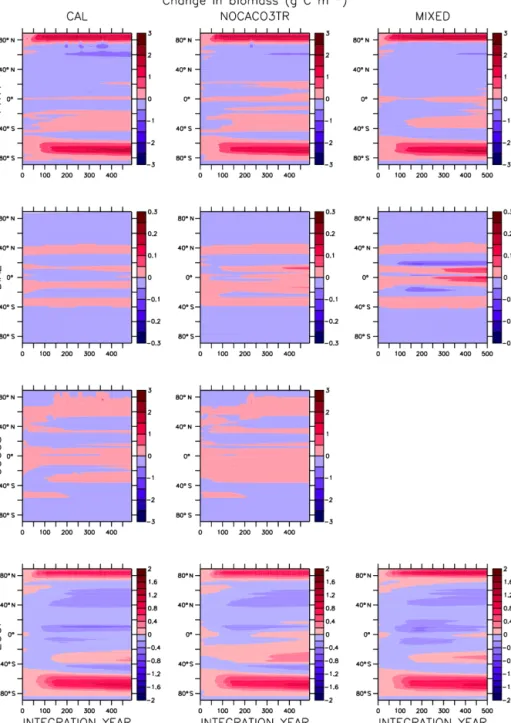
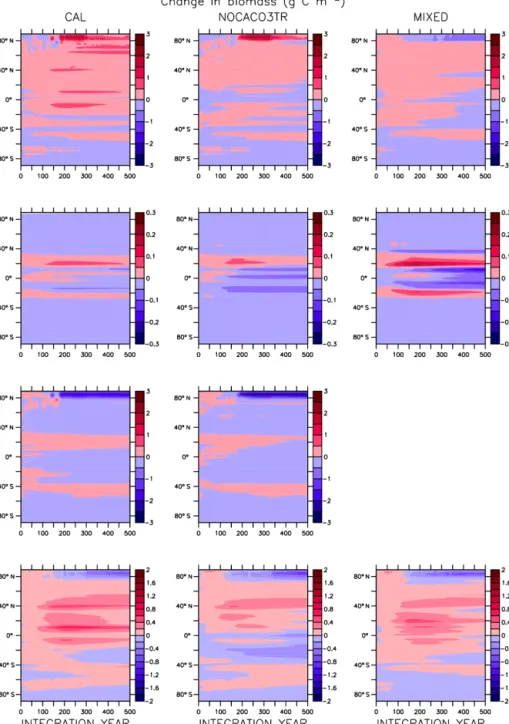
Figure A2.Zonally averaged changes in plankton biomass over the WARMING simulation.
colithophore population density around 40◦S; Balch et al., 2016), and small decreases everywhere else. An increase in calcifiers mitigates the positive diazotroph response to phos- phate fertilization from enhanced vertical mixing because the calcifiers consume the phosphate first. Diazotrophs suffer a net decline in biomass. Mixed phytoplankton nitrate limita- tion is therefore more ubiquitous than in the MIXED model.
Calcifiers are replaced by mixed phytoplankton in the Arctic.
The net change in NPP is a decline that accelerates after the SST threshold is reached.
Figure A1 clearly reveals the role of ballast by PIC in de- termining total NPP. In both WARMING and COOLING, the total NPP is lower when the ballast model is applied than in the other model configurations. This is because ballast- ing lowers total nutrient concentrations near the surface by effectively exporting particles to the deep sea for remineral- ization, thereby limiting all primary producers. The global integrated NPP response of the CAL model in COOLING is lower in magnitude but similar in slope to that of MIXED.
Like in MIXED, diazotroph biomass increases in the low lat- itudes and produces nitrate that is readily available for other
Figure A3.Zonally averaged changes in plankton biomass over the COOLING simulation.
phytoplankton to use. Like NOCACO3TR, calcifier biomass increases along the Great Calcite Belt and in the Northern Hemisphere, and declines in the middle latitudes and around the Equator. Mixed phytoplankton biomass increases almost globally and shows the largest biomass increases in any of the three models. However, the net NPP response is a decline after the threshold 3.5◦C SST change, which suggests the in- crease in mixed phytoplankton is not offset by the large de- crease in calcifiers and the reduction in primary production rates. In CAL, diazotroph biomass does not experience the large decline seen in the other two models. This is due to the
effect of ballasting, which maintains a lower surface nitrate concentration and thus a more favorable environment for dia- zotrophs. In all models, an equatorward shift in zooplankton biomass occurs over COOLING as the predators follow their prey, opposite to the poleward shift seen in WARMING.
Author contributions. KFK designed the experiment and wrote the paper with comments by the other authors. KET ran the simulations and contributed to the analysis of the data. AL and KJM contributed to the analysis.
Competing interests. The authors declare that they have no conflict of interest.
Acknowledgements. This work was supported by GEOMAR Helmholtz Centre for Ocean Research Kiel and Sonderforschungs- bereich 754. Katherine E. Turner and Karin F. Kvale are grateful for computing resources provided by GEOMAR and Kiel University.
Katrin J. Meissner acknowledges support from the Australia Research Council (DP180100048).
The article processing charges for this open-access publication were covered by a Research
Centre of the Helmholtz Association.
Review statement. This paper was edited by Christine Klaas and reviewed by two anonymous referees.
References
Archer, D.: An atlas of the distribution of calcium carbonate in sed- iments of the deep sea, Global Biogeochem. Cy., 10, 159–174, 1996.
Armstrong, R., Lee, C., Hedges, J., Honjo, S., and Wakeham, S.: A new, mechanistic model for organic carbon fluxes in the ocean based on the quantitative association of POC with ballast miner- als, Deep-Sea Res. Pt. II, 49, 219–236, 2002.
Bach, L. T., Riebesell, U., Gutowska, M. A., Federwisch, L., and Schulz, K. G.: A unifying concept of coccolithophore sensitivity to changing carbonate chemistry embedded in an ecological framework, Prog. Oceanogr., 135, 125–138, https://doi.org/10.1016/j.pocean.2015.04.012, 2015.
Balch, W. M.: The Ecology, Biogeochemistry, and Optical Prop- erties of Coccolithophores, Annu. Rev. Mar. Sci., 10, 71–98, https://doi.org/10.1146/annurev-marine-121916-063319, 2018.
Balch, W. M., Bates, N. R., Lam, P. J., Twining, B. S., Rosen- gard, S. Z., Bowler, B. C., Drapeau, D. T., Garley, R., Lubel- czyk, L. C., Mitchell, C., and Rauschenberg, S.: Factors regulat- ing the Great Calcite Belt in the Southern Ocean and its biogeo- chemical significance, Global Biogeochem. Cy., 30, 1124–1144, https://doi.org/10.1002/2016GB005414, 2016.
Bolton, C. T., Hernández-Sánchez, M. T., Fuertes, M.-Á., González-Lemos, S., Abrevaya, L., Mendez-Vicente, A., Flores, J.-A., Probert, I., Giosan, L., Johnson, J., and Stoll, H. M.: Decrease in coccolithophore calcification and CO2 since the middle Miocene, Nat. Commun., 7, 10284, https://doi.org/10.1038/ncomms10284, 2016.
DeVries, T. and Weber, T.: The export and fate of organicmatter in the ocean: New constraints from combining satellite and oceano- graphic tracer observations, Global Biogeochem. Cy., 31, 535–
555, https://doi.org/10.1002/2016GB005551, 2017.
DeVries, T., Primeau, F., and Deutsch, C.: The sequestration effi- ciency of the biological pump, Geophys. Res. Lett., 39, L13601, https://doi.org/10.1029/2012GL051963, 2012.
DeVries, T., Holzer, M., and Primeau, F.: Recent increase in oceanic carbon uptake driven by weaker upper-ocean overturning, Na- ture, 542, 215–218, https://doi.org/10.1038/nature21068, 2017.
Eby, M., Zickfeld, K., Montenegro, A., Archer, D., Meissner, K. J., and Weaver, A. J.: Lifetime of anthropogenic climate change: Millennial time scales of potential CO2 and sur- face temperature perturbations, J. Climate, 22, 2501–2511, https://doi.org/10.1175/2008JCLI2554.1, 2009.
Francois, R., Honjo, S., Krishfield, R., and Manganini, S.: Fac- tors controlling the flux of organic carbon to the bathy- pelagic zone of the ocean, Global Biogeochem. Cy., 16, 1087, https://doi.org/10.1029/2001gb001722, 2002.
Furukawa, M., Sato, T., Suzuki, Y., Casareto, B. E., and Hirabayashi, S.: Numerical modelling of phys- iological and ecological impacts of ocean acidifica- tion on coccolithophores, J. Marine Syst., 182, 12–30, https://doi.org/10.1016/j.jmarsys.2018.02.008, 2018.
Garcia, H. E., Locarnini, R., Boyer, T., Antonov, J., Zweng, M., Baranova, O., and Johnson, D.: World Ocean Atlas 2009: Nutri- ents (phosphate, nitrate, silicate), vol. 4, U.S. Government Print- ing Office, Washington, DC, 2009.
Hannisdal, B., Henderiks, J., and Liow, L. H.: Long-term evolu- tionary and ecological responses of calcifying phytoplankton to changes in atmospheric CO2, Glob. Change Biol., 18, 3504–
3516, https://doi.org/10.1111/gcb.12007, 2012.
Hofmann, M. and Schellnhuber, H.-J.: Oceanic acidification affects marine carbon pump and triggers extended marine oxygen holes, P. Natl. Acad. Sci. USA, 106, 3017–3022, 2009.
Hoppe, C. J. M., Wolf, K. K. E., Schuback, N., Tortell, P. D., and Rost, B.: Compensation of ocean acidification effects in Arc- tic phytoplankton assemblages, Nat. Clim. Change, 8, 529–533, https://doi.org/10.1038/s41558-018-0142-9, 2018.
Iglesias-Rodriguez, M. D., Halloran, P. R., Rickaby, R. E. M., Hall, I. R., Colmenero-Hidalgo, E., Gittins, J. R., Green, D. R. H., Tyrrell, T., Gibbs, S. J., von Dassow, P., Rehm, E., Armbrust, E. V., and Boessenkool, K. P.: Phytoplankton Calcification in a High-CO2 World, Science, 320, 336–340, https://doi.org/10.1126/science.1154122, 2008.
Junium, C. K. and Arthur, M. A.: Nitrogen cycling dur- ing the Cretaceous, Cenomanian-Turonian Oceanic Anoxic Event II, Geochem. Geophy. Geosy., 8, Q03002, https://doi.org/10.1029/2006GC001328, 2007.
Junium, C. K., Dickson, A. J., and Uveges, B. T.: Perturbation to the nitrogen cycle during rapid Early Eocene global warming, Nat.
Commun., 9, 3186, https://doi.org/10.1038/s41467-018-05486- w, 2018.
Keller, D. P., Oschlies, A., and Eby, M.: A new marine ecosystem model for the University of Victoria Earth Sys- tem Climate Model, Geosci. Model Dev., 5, 1195–1220, https://doi.org/10.5194/gmd-5-1195-2012, 2012.
Klaas, C. and Archer, D.: Association of sinking organic matter with various types of mineral ballast in the deep sea: Impli- cations for the rain ratio, Global Biogeochem. Cy., 16, 1116, https://doi.org/10.1029/2001GB001765, 2002.
Krumhardt, K. M., Lovenduski, N. S., Iglesias-Rodriguez, M. D., and Kleypas, J. A.: Coccolithophore growth and calcifica-
tion in a changing ocean, Prog. Oceanogr., 159, 276–295, https://doi.org/10.1016/j.pocean.2017.10.007, 2017.
Kuypers, M. M., van Breugel, Y., Schouten, S., Erba, E., and Damsté, J. S. S.: N2-fixing cyanobacteria supplied nutrient N for Cretaceous oceanic anoxic events, Geology, 32, 853–856, https://doi.org/10.1130/G20458.1, 2004.
Kvale, K. F., Meissner, K., Keller, D., Schmittner, A., and Eby, M.:
Explicit planktic calcifiers in the University of Victoria Earth System Climate Model, version 2.9, Atmos. Ocean, 53, 1–19, https://doi.org/10.1080/07055900.2015.1049112, 2015a.
Kvale, K. F., Meissner, K. J., and Keller, D. P.: Potential in- creasing dominance of heterotrophy in the global ocean, En- viron. Res. Lett., 10, 074009, https://doi.org/10.1088/1748- 9326/10/7/074009, 2015b.
Kvale, K. F., Turner, K. E., Keller, D. P., and Meissner, K. J.: Asym- metric dynamical ocean responses in warming icehouse and cooling greenhouse climates, Environ. Res. Lett., 13, 125011, https://doi.org/10.1088/1748-9326/aaedc3, 2018.
Kwon, E. Y., Primeau, F., and Sarmiento, J. L.: The impact of rem- ineralization depth on the air–sea carbon balance, Nat. Geosci., 2, 630–635, https://doi.org/10.1038/ngeo612, 2009.
Landolfi, A., Dietze, H., Koeve, W., and Oschlies, A.: Overlooked runaway feedback in the marine nitrogen cycle: the vicious cycle, Biogeosciences, 10, 1351–1363, https://doi.org/10.5194/bg-10- 1351-2013, 2013.
Landolfi, A., Somes, C. J., Koeve, W., Zamora, L. M., and Os- chlies, A.: Oceanic nitrogen cycling and N2O flux perturbations in the Anthropocene, Global Biogeochem. Cy., 31, 1236–1255, https://doi.org/10.1002/2017GB005633, 2017.
Lenton, T. M., Boyle, R. A., Poulton, S. W., Shields-Zhou, G. A., and Butterfield, N. J.: Co-evolution of eukaryotes and ocean oxy- genation in the Neoproterozoic era, Nat. Geosci., 7, 257–265, 2014.
Liu, Y.-W., Eagle, R. A., Aciego, S. M., Gilmore, R. E., and Ries, J. B.: A coastal coccolithophore maintains pH homeostasis and switches carbon sources in response to ocean acidification, Nat.
Commun., 9, 2857, https://doi.org/10.1038/s41467-018-04463- 7, 2018.
Lohbeck, K. T., Riebesell, U., and Reusch, T. B. H.: Adaptive evo- lution of a key phytoplankton species to ocean acidification, Nat.
Geosci., 5, 346–351, https://doi.org/10.1038/ngeo1441, 2012.
Meissner, K., Weaver, A., Matthews, H., and Cox, P.: The role of land surface dynamics in glacial inception: A study with the UVic Earth System Model, Clim. Dynam., 21, 515–537, https://doi.org/10.1007/s00382-003-0352-2, 2003.
Meyer, K. M., Ridgwell, A., and Payne, J. L.: The influence of the biological pump on ocean chemistry: implications for long- term trends in marine redox chemistry, the global carbon cy- cle, and marine animal ecosystems, Geobiology, 14, 207–219, https://doi.org/10.1111/gbi.12176, 2016.
Monteiro, F. M., Bach, L. T., Brownlee, C., Bown, P., Rickaby, R.
E. M., Poulton, A. J., Tyrrell, T., Beaufort, L., Dutkiewicz, S., Gibbs, S., Gutowska, M. A., Lee, R., Riebesell, U., Young, J., and Ridgwell, A.: Why marine phytoplankton calcify, Sci. Adv., 2, e1501822, https://doi.org/10.1126/sciadv.1501822, 2016.
Moore, J. K. and Doney, S. C.: Iron availability limits the ocean nitrogen inventory stabilizing feedbacks between marine deni- trification and nitrogen fixation, Global Biogeochem. Cy., 21, GB2001, https://doi.org/10.1029/2006GB002762, 2007.
Neukermans, G., Oziel, L., and Babin, M.: Increased intrusion of warming Atlantic water leads to rapid expansion of temperate phytoplankton in the Arctic, Glob. Change Biol., 24, 2545–2553, https://doi.org/10.1111/gcb.14075, 2018.
Passow, U. and De La Rocha, C. L.: Accumulation of mineral ballast on organic aggregates, Global Biogeochem. Cy., 20, GB1013, https://doi.org/10.1029/2005GB002579, 2006.
Riebesell, U., Zondervan, I., Rost, B., Tortell, P. D., Zeebe, R. E., and Morel, F. M. M.: Reduced calcification of marine plankton in response to increased atmospheric CO2, Nature, 407, 364–367, https://doi.org/10.1038/35030078, 2000.
Rosengard, S. Z., Lam, P. J., Balch, W. M., Auro, M. E., Pike, S., Drapeau, D., and Bowler, B.: Carbon export and transfer to depth across the Southern Ocean Great Calcite Belt, Biogeosciences, 12, 3953–3971, https://doi.org/10.5194/bg-12-3953-2015, 2015.
Schmittner, A., Oschlies, A., Giraud, X., Eby, M., and Sim- mons, H.: A global model of the marine ecosystem for long-term simulations: Sensitivity to ocean mixing, buoy- ancy forcing, particle sinking, and dissolved organic matter cycling, Global Biogeochem. Cy., 19, GB3004, https://doi.org/10.1029/2004GB002283, 2005.
Schmittner, A., Oschlies, A., Matthews, H. D., and Galbraith, E. D.:
Future changes in climate, ocean circulation, ecosystems, and biogeochemical cycling simulated for a business as usual CO2 emission scenario until year 4000 AD, Global Biogeochem. Cy., 22, GB1013, https://doi.org/10.1029/2007GB002953, 2008.
Tyrrell, T.: The relative influences of nitrogen and phospho- rus on oceanic primary production, Nature, 400, 525–531, https://doi.org/10.1038/22941, 1999.
Weaver, A., Eby, M., Wiebe, E., Bitz, C., Duffy, P., Ewen, T., Fanning, A., Holland, M., MacFadyen, A., Matthews, H., Meissner, K., Saenko, O., Schmittner, A., Wang, H., and Yoshimori, M.: The UVic Earth System Climate Model:
Model description, climatology, and applications to past, present and future climates, Atmos. Ocean, 39, 361–428, https://doi.org/10.1080/07055900.2001.9649686, 2001.
Wilson, J. D., Barker, S., and Ridgwell, A.: Assessment of the spatial variability in particulate organic matter and min- eral sinking fluxes in the ocean interior: Implications for the ballast hypothesis, Global Biogeochem. Cy., 26, GB4011, https://doi.org/10.1029/2012GB004398, 2012.