https://doi.org/10.1007/s00442-019-04408-x
POPULATION ECOLOGY – ORIGINAL RESEARCH
How invasive oysters can affect parasite infection patterns in native mussels on a large spatial scale
M. Anouk Goedknegt1 · Reinier Nauta1 · Mirjana Markovic1 · Christian Buschbaum2 · Eelke O. Folmer1 · Pieternella C. Luttikhuizen1 · Jaap van der Meer1 · Andreas M. Waser1 · K. Mathias Wegner2 · David W. Thieltges1
Received: 12 September 2018 / Accepted: 29 April 2019 / Published online: 10 May 2019
© Springer-Verlag GmbH Germany, part of Springer Nature 2019
Abstract
There are surprisingly few field studies on the role of invasive species on parasite infection patterns in native hosts. We investigated the role of invasive Pacific oysters (Magallana gigas) in determining parasite infection levels in native blue mussels (Mytilus edulis) in relation to other environmental and biotic factors. Using hierarchical field sampling covering three spatial scales along a large intertidal ecosystem (European Wadden Sea), we found strong spatial differences in infec- tion levels of five parasite species associated with mussels and oysters. We applied mixed models to analyse the associa- tions between parasite prevalence and abundance in mussels and oysters, and 12 biological and environmental factors. For each parasite–host relationship, an optimal model (either a null, one-factor or two-factor model) was selected based on AIC scores. We found that the density of invasive oysters contributed to three of the 12 models. Other biological factors such as host size (six models), and the density of target or alternative host species (five models) contributed more frequently to the best models. Furthermore, for parasite species infecting both mussels and oysters, parasite population densities were higher in native mussels, attributed to the higher densities of mussels. Our results indicate that invasive species can affect parasite infection patterns in native species in the field, but that their relative contribution may be further mediated by other biologi- cal and environmental parameters. These results stress the usefulness of large-scale field studies for detailed assessments of the mechanisms underlying the impacts of invasive species on native host communities.
Keywords Invasive species · Parasite spillover · Parasite spillback · Transmission interference · Wadden Sea
Introduction
Over the last decades, global trade and transport have expanded enormously leading to an unprecedented intro- duction of species to new ecosystems (Vitousek et al. 1996;
Mack et al. 2000; Bax et al. 2003; Levine and D’Antonio 2003; Jackson and Grey 2013). Besides the documented direct effects on species interactions with native organisms, it is increasingly recognised that introduced species can also alter parasite–host relationships in invaded ecosystems in manifold ways. For example, with many alien organisms their native parasites can be co-introduced to recipient eco- systems (Daszak et al. 2000; Taraschewski 2006; Lymbery et al. 2014). These introduced parasites may spill over from introduced to naïve native host species (parasite spillover;
Power and Mitchell 2004; Prenter et al. 2004; Kelly et al.
2009), which has already lead to emerging diseases and mass mortalities of native populations (Daszak et al. 2000;
Goedknegt et al. 2016). Furthermore, native parasites might
Communicated by Peter S. Petraitis.
M. Anouk Goedknegt: currently working in the Universite de Bordeaux, UMR 5805 EPOC, Station Marine d’Arcachon, 2, Rue du Professeur Jolyet, 33120 Arcachon, France.
Electronic supplementary material The online version of this article (https ://doi.org/10.1007/s0044 2-019-04408 -x) contains supplementary material, which is available to authorized users.
* M. Anouk Goedknegt
Anouk.Goedknegt@u-bordeaux.fr
1 Department of Coastal Systems, NIOZ Royal Netherlands Institute for Sea Research, and Utrecht University, P.O.
Box 59, 1790 AB Den Burg, Texel, The Netherlands
2 Biosciences | Coastal Ecology, Alfred Wegener Institute, Wadden Sea Station Sylt, Hafenstraße 43, 25992 List, Sylt, Germany
infect invasive host species in their new range which in turn may increase the disease risk for native species if the inva- sive hosts amplify transmission rates, resulting in increased infection levels in native host populations (parasite spill- back; Kelly et al. 2009; Poulin et al. 2011; Telfer and Brown 2012). Alternatively, invasive host species may be non-com- petent hosts for native parasites and instead interfere with transmission processes by removing free-living infectious stages of native parasites from the environment (e.g., by means of predation or being dead-end hosts; transmission interference; Johnson and Thieltges 2010; Goedknegt et al.
2016). This can lead to a reduced disease risk for native host species, a phenomenon similar to dilution effects observed in vector-borne diseases (Keesing et al. 2006).
Due to the crucial role of invasive species in these para- site infection scenarios, the presence and abundance of an invader has the potential to affect local parasite infection levels in native hosts (Kelly et al. 2009; Poulin et al. 2011;
Telfer and Brown 2012). While such effects have been stud- ied experimentally (e.g., Kopp and Jokela 2007; Thieltges et al. 2009; Goedknegt et al. 2015), surprisingly few stud- ies have attempted to study the effects of invasive species on infection patterns in native hosts in the field (but see Paterson et al. 2011, 2013 who used a combined approach).
Parasite infection levels in native hosts are not only poten- tially affected by invasive species, but also influenced by many other factors which have been shown to underlie the generally high spatial heterogeneities in infection levels observed in the field (Thieltges and Reise 2007; Byers et al.
2008; Wilson et al. 2011; Galaktionov et al. 2015; Stringer and Linklater 2015). For example, the population density of native hosts often affects infection patterns across many parasite and host taxa (Arneberg et al. 1998; Galaktionov et al. 2015; Stringer and Linklater 2015; Searle et al. 2016).
Other factors known to affect infection patterns include host size (Mouritsen et al. 2003; Thieltges and Reise 2007), the supply of free-living infective stages (often approximated via preceding intermediate host densities for parasites with complex life cycles; Byers et al. 2008; Wilson et al. 2011;
Galaktionov et al. 2015) and environmental variables such as temperature, pH and salinity (Pietrock and Marcogliese 2003; Poulin 2006). The existence of a multitude of biologi- cal and environmental factors driving infection levels, ques- tions the relative contribution of invasive hosts, or in other words, whether invader presence and abundance matter for infections in native hosts. Hence, field studies investigating infection patterns in native hosts in relation to the abundance of invasive species and other factors are desirable.
A suitable model system to investigate the relative impor- tance of invasive species in determining infection levels in native hosts in the field, is the invasion of the Pacific oyster (Magallana gigas) along north western European coasts. This bivalve was introduced to Europe in the 1960s
to replenish native oyster stocks for aquaculture purposes (Troost 2010), and today Pacific oyster populations co-occur with native blue mussels (Mytilus edulis) in dense bivalve beds on intertidal mudflats (Reise 1998; Troost 2010; Rues- ink et al. 2005; Buschbaum et al. 2016; Reise et al. 2017).
Pacific oysters co-introduced the invasive parasitic copepod Mytilicola orientalis that was likely co-introduced in large numbers or via multiple introductions and followed a simi- lar invasion route as oysters (Feis 2018) and subsequently spilled over to native blue mussels (Pogoda et al. 2012;
Goedknegt et al. 2017). This copepod has a direct life cycle and inhabits the intestines of its host, causing reductions in the condition of mussels (Goedknegt et al. 2018a), but not in oysters (Katkansky et al. 1967; Steele and Mulcahy 2001). A congeneric parasitic copepod species, Mytilicola intestinalis, has been infecting native mussels since its introduction to the region 80 years ago (Caspers 1939; Hockley 1951; Kor- ringa 1968). While the parasite was first observed in mussels (Mytilus galloprovincialis) in the Mediterranean Sea (Steuer 1902), genetic studies could not confirm the Mediterranean as its native region due to low genetic diversity and a lacking population structure, and, to date, its origin is still unknown (Feis 2018). At western European coasts, the parasite does not seem to infect invasive oysters, making the Pacific oyster a potential sink for M. intestinalis populations (Elsner et al.
2011; Goedknegt et al. 2017). Likewise, the Pacific oyster is a not a suitable host for the native trematodes Himas- thla elongata and Renicola roscovita (Thieltges et al. 2008, 2009; Welsh et al. 2014; Goedknegt et al. 2015). Instead, by filtering host-seeking trematode larvae out of the water column, the oyster interferes with the transmission between first (snails) and second intermediate hosts (several native bivalve species; Thieltges et al. 2008, 2009; Welsh et al.
2014; Goedknegt et al. 2015), preventing the parasite spe- cies to complete their life cycle in birds, the definitive host of both trematodes (gulls and waders; Stunkard 1964; Werd- ing 1969; Lauckner 1983; Galaktionov and Bustnes 1999).
Finally, for the native shell-boring polychaete Polydora cil- iata, which infects native blue mussels (M. edulis) and com- mon periwinkles (Littorina littorea; Buschbaum et al. 2007), invasive Pacific oysters act as a new competent host species (Thieltges et al. 2006), potentially increasing infection levels in native mussels via parasite spillback.
In this study, we analysed the relationship between the distribution and abundance of parasites in native mussels and the abundance of the invasive Pacific oyster (M. gigas) and other biotic and abiotic factors in the Wadden Sea, a large intertidal soft-bottom ecosystem stretching over 500 km of coastline. Using large-scale field observations we aimed to address the following questions: (1) what is the distribution and abundance of parasite species associated with parasite spillover (M. orientalis), spillback (P. ciliata) and transmis- sion interference processes (M. intestinalis, H. elongata, R.
roscovita) in invasive oysters and native mussels along the entire Wadden Sea ecosystem? (2) Can the contribution of invasive oysters be unravelled among other biological and environmental factors determining infection levels in native mussels? and (3) For parasites infecting mussel and oyster hosts (M. orientalis and P. ciliata), which host species serves as the dominant host for the parasite population? By investi- gating the relative importance of invasive oysters for parasite infection patterns in native mussels, this study contributes to a better understanding of the role of invasive species in parasite spillover, spillback and transmission interference processes.
Materials and methods
Parasite infection patterns Sampling on hierarchical scalesSampling took place on eight mixed beds of invasive Pacific oysters (M. gigas) and native blue mussels (M. edulis) spread over the entire Dutch and German Wadden Sea except for the
mid-German Wadden Sea, which is devoid of mussel beds (Folmer et al. 2014; see Fig. 1; Online Resource 1). Beds were selected based on geographic distribution and logisti- cal feasibility. The following regions were sampled: West Netherlands (locations 1 and 2), East Netherlands (locations 3 and 4), South Germany (locations 5 and 6) and North Ger- many (locations 7 and 8). All beds were sampled in autumn 2012 (Online Resource 1) as this period is well suited for documenting infection levels of macroparasites (summer is the main period of production of trematodes (Thieltges and Rick 2006; Poulin 2006) and parasitic copepods (Grainger 1951) and of the settlement of P. ciliata larvae (Harms and Anger 1983)).
To demarcate a plot, a quadrant of 1 m2 was haphazardly placed four times within each bed at low tide, at approxi- mately similar tidal heights and with 100 m distance between plots. From each plot, 20 individuals of each bivalve species (mussels and oysters) were randomly collected for parasito- logical analysis. We sampled medium-to-large size classes of mussels (30–70 mm) and oysters (40–230 mm), as these size classes are regularly infected with the five parasite species (Brenner et al. 2014; Goedknegt et al. 2017). Our sampling design was hierarchical, resulting in three spatial scales of
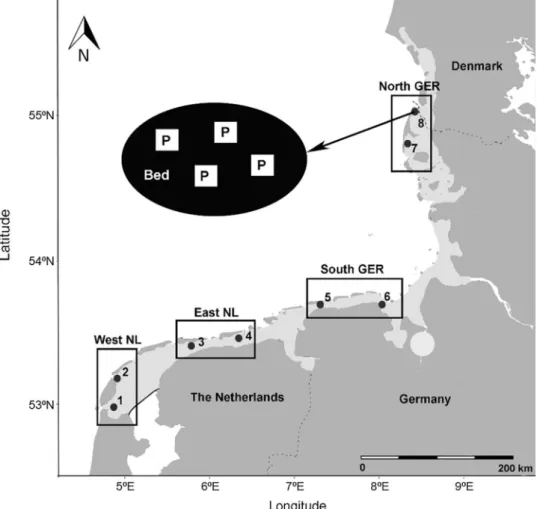
Fig. 1 Map of the eight sam- pling locations (mixed beds of Pacific oysters Magallana gigas and blue mussels Mytilus edulis, black dots) in four regions (black rectangles) in the Dutch (NL) and German (GER) Wadden Sea (shaded light grey area; see Online Resource 1 for coordinates and sample dates).
On each bed, four plots of 1 m2 (P; insert upper left) were hap- hazardly selected from which individual hosts were sampled.
In each plot, two cores (not shown) were taken to determine host densities and other param- eters (see text for details)
observations: region [r = 4], bed nested in region [b(r) = 2, btotal = 8] and plot nested in bed [p(b) = 4, ptotal = 32]. In total, 640 individuals of each bivalve species were investigated for parasitic infections.
Dissection procedures for parasite screening
In the laboratory, mussel and oyster shells were opened and inspected from the inside and outside for the presence of P.
ciliata markings as described in Catherine et al. (1990) and Ambariyanto and Seed (1991). As it was too time-consum- ing to crack mussel and, especially oyster shells, to find all Polydora individuals, we did not obtain P. ciliata intensities of both hosts. After shell inspections, host flesh was stored in labelled plastic bags and frozen at − 20 °C until further analysis.
We defrosted mussel and oyster flesh in batches (one species from a plot at a time, n = 20) and screened for the presence of endoparasites. As the mussel is host to four different endoparasite species (the copepods M. orientalis and M. intestinalis, and the trematodes R. roscovita and H.
elongata; Thieltges et al. 2006; Elsner et al. 2011; Pogoda et al. 2012; Brenner et al. 2014; Goedknegt et al. 2017) and the oyster only to one (M. orientalis; Elsner et al. 2011;
Pogoda et al. 2012; Goedknegt et al. 2017), the dissection procedures differed between the two hosts. Mussel tissue was inspected for adult copepods under a magnification glass (3–8 ×), subsequently squeezed between glass plates and scanned with a stereomicroscope (10–30 ×) for remaining copepod larvae and metacercarial stages of trematodes. For oysters, the digestive tissue was first dissected and inspected for copepods, after which remaining copepods were flushed out of the intestine with water from a squeezing bottle.
Trematode metacercaria were identified according to Werding (1969). The identification of adult Mytilicola was based on descriptions of Steuer (1902), Mori (1935), Ho and Kim (1992) and Elsner et al. (2011). However, as morpho- logical species identification is not entirely reliable when both Mytilicola species have overlapping host ranges and distributions (Elsner et al. 2011; Goedknegt et al. 2017;
Goedknegt et al. 2018b), a subset of Mytilicola specimens originating from blue mussels were also molecularly identi- fied to species level to support and improve the morphologi- cal identification (see Online Resource 2).
Biological and environmental drivers of parasite infection patterns
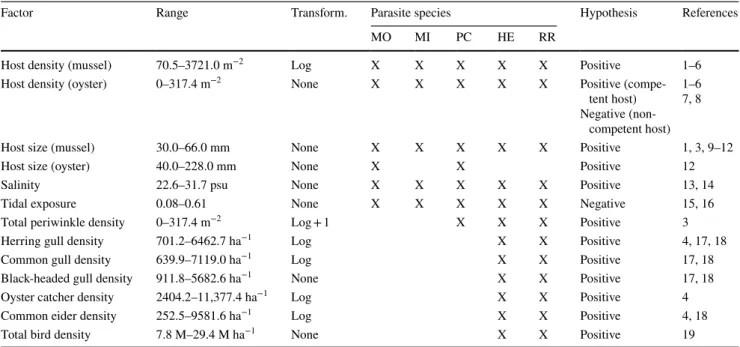
Based on existing literature on native parasite–host relation- ships, we selected a total of 12 potential biological and envi- ronmental drivers of parasite infection patterns for our analy- ses (see Table 1 for a literature overview and Goedknegt et al. 2019 for raw data). Densities of oyster, mussel and the
first intermediate snail host (i.e., mature periwinkles L. lit- torea with a shell length of > 14 mm from base to apex) for the trematodes R. roscovita and H. elongata) were obtained by taking two cores (Ø 19 cm, ± 20 cm deep) per plot. Core contents were sieved and brought to the lab where host num- bers were determined. The average of the two cores was used as a measure of host density (m−2) per plot. Host size was defined as the shell length (maximum anteroposterior axis) and measured with Vernier callipers to the nearest mm. To estimate densities of definitive hosts that play a role in the life cycle of trematodes, we used aerial counts (common eider Somateria mollissima) and high-tide roost counts (her- ring gull Larus argentatus, common gull Larus canus, black- headed gull Chroicocephalus ridibundus, oystercatcher Hae- matopus ostralegus) of long-term monitoring programmes from which we calculated the bird densities per intertidal hectare per location (see Waser 2018 and Online Resource 3 for details). Estimates of environmental data, salinity and exposure time, were obtained by means of simulation with the General Estuarine Transport Model (GETM; Burchard and Bolding 2002), which was previously used to simulate the hydrodynamics, temperature and salinity for the entire Wadden Sea (Gräwe et al. 2016). For further details regard- ing the simulations, we refer to Gräwe et al. (2016) and to Folmer et al. (2016) for post-processing of simulation data.
Statistical analysis
Calculations of infection measures
For each sampled plot and host species, we calculated para- site prevalence (the ratio of infected to sampled host spe- cies), intensity (the mean number of parasites per infected host), abundance (the mean number of parasites in all hosts), parasite population density m−2 (the product of parasite abundance and host density m−2) and infected host den- sity m−2 (the product of prevalence and host density m−2) according to the terminology of Bush et al. (1997). For P.
ciliata only prevalence and infected host density could be calculated due to missing intensity data. For both Mytilicola species, observations included morphologically as well as molecularly identified individuals, although the morpho- logical identification error was relatively small (< 10%; see Online Resource 2). When both identification techniques disagreed on the species identity of an individual copepod, preference was given to the molecular results. Raw data of all parasite infection parameters can be found in Goedknegt et al. (2019).
Spatial infection patterns
We determined how variability in prevalence (modelled as parasite presence/absence) and abundance (numbers
of parasites in individual hosts) in mussels and oysters depended on spatial scale by using (intercept only) general linear mixed models (GLMMs) following binomial dis- tributions for prevalence data (package lme4, Bates et al.
2015) and negative binomial distributions for abundance data (package glmmADMB; Fournier et al. 2012; Skaug et al. 2014) in the statistical software environment R (R Development Core Team 2015). We did not use intensity, as this measure of infection can only be obtained from infected hosts, which would have resulted in heavily unbal- anced datasets. In the GLMMs we considered plots to be nested within beds, beds nested within region, and regions as random effects and calculated the relative variance components for each of these spatial levels. For parasites infecting both host species (M. orientalis and P. ciliata), we used similar GLMMs including host species as fixed effect and compared the results with GLMMs without this fixed term using likelihood ratio tests following Chi- square distributions. To evaluate potential co-occurrences of parasites in each host species and on the smallest spatial scale (plot level), we used pairplots and performed nMDS analyses using the vegan package (Oksanen et al. 2019).
Predictors of infection levels
Density of the invasive host (Pacific oysters), density of the native host (blue mussels), mussel host size, tidal expo- sure time (i.e., the mean fraction of time that the seabed is exposed to the air) and salinity (psu) were included as explanatory variables in all parasite models. We did not include temperature as the range of average summer temper- atures (Jun–Sept over the years 2007–2011) in the Wadden Sea was too small to detect potential effects (16.0–16.5 °C;
E. Folmer, pers. comm.). For M. orientalis and P. ciliata which also infect oysters, we additionally included oyster host size in the models. Furthermore, for P. ciliata, we included the density of the common periwinkle L. littorea, which serves as an alternative host for this parasite species.
Finally, for trematodes with complex life cycles (H. elongata and R. roscovita), the density of the first intermediate host, the common periwinkle L. littorea, and of definitive hosts (several bird species; see Table 1) were included.
Prior to the analyses, we inspected all biological and environmental factors for skewed distributions and applied log10-transformations to linearise relationships when
Table 1 List of biological and environmental factors which were investigated as potential drivers of infection levels in the analyses
Given are the explanatory factor, its value ranges, the applied transformation, the parasite species for which the factor was included in the analy- ses and the directional hypothesis (positive or negative effect on the parasite) based on literature references. Abbreviations of parasite species:
MO = Mytilicola orientalis, MI = Mytilicola intestinalis, PC = Polydora ciliata, HE = Himasthla elongata, RR = Renicola roscovita
References: (1) Gee and Davey (1986), (2) Arneberg et al. (1998), (3) Thieltges and Reise (2007), (4) Galaktionov et al. (2015), (5) Stringer and Linklater (2015), (6) Searle et al. (2016), (7) Thieltges et al. (2009), (8) Mordecai (2013), (9) Ambaryianto and Seed (1991), (10) Nikolaev et al. (2006), (11) Stier et al. (2015), (12) Goedknegt et al. (2017), (13) Pietrock and Marcogliese (2003), (14) Bolster (1954), (15) Fingerut et al.
(2003), (16) Wilson et al. (2011), (17) Werding (1969), (18) Galaktionov and Bustnes (1999) and (19) Hechinger and Lafferty (2005)
Factor Range Transform. Parasite species Hypothesis References
MO MI PC HE RR
Host density (mussel) 70.5–3721.0 m−2 Log X X X X X Positive 1–6
Host density (oyster) 0–317.4 m−2 None X X X X X Positive (compe-
tent host) Negative (non-
competent host) 1–67, 8
Host size (mussel) 30.0–66.0 mm None X X X X X Positive 1, 3, 9–12
Host size (oyster) 40.0–228.0 mm None X X Positive 12
Salinity 22.6–31.7 psu None X X X X X Positive 13, 14
Tidal exposure 0.08–0.61 None X X X X X Negative 15, 16
Total periwinkle density 0–317.4 m−2 Log + 1 X X X Positive 3
Herring gull density 701.2–6462.7 ha−1 Log X X Positive 4, 17, 18
Common gull density 639.9–7119.0 ha−1 Log X X Positive 17, 18
Black-headed gull density 911.8–5682.6 ha−1 None X X Positive 17, 18
Oyster catcher density 2404.2–11,377.4 ha−1 Log X X Positive 4
Common eider density 252.5–9581.6 ha−1 Log X X Positive 4, 18
Total bird density 7.8 M–29.4 M ha−1 None X X Positive 19
necessary. Additionally, we examined collinearity with pair plots including Pearson correlations (Online Resource 4).
We conducted a series of nested GLMMs for each para- site–host species combination, including an intercept-only model (null model), to examine the effect of biological and environmental factors on prevalence (parasite presence- absence) and abundance (number of parasites per individual host). In all models, the number of explanatory variables was kept to a minimum by including at most a single explanatory variable as fixed effect in the model. Consequently, each individual GLMM included parasite prevalence or abun- dance as response variable, none or one individual driver as explanatory variable and the hierarchical sampling structure as random effect. Competing models were compared based on the Akaike information criterion corrected for sample sizes (AICc) and the model with the lowest AICc score was selected as the best driver model. Then, we produced a suite of models with two fixed effects that contained the fixed effect of the top performing model plus each of the other
explanatory variables in turn. Again, the best performing model was chosen based on the lowest AICc and the forward selection procedure was terminated at this point to avoid overfitting of the data. Finally, we estimated the Akaike weights of all models tested per parasite–host combination (MuMIn package; Barton 2018) to facilitate the interpreta- tion of the AIC model comparisons.
Results
Spatial distribution of host and parasite species Invasive Pacific oysters (mean shell length ± SE, 128.5 ± 1.5 mm) and native blue mussels (45.2 ± 0.25 mm) were present at all sampled beds in the Wadden Sea. In all beds mussel densities (mean ± SE; 1140.8 ± 121.4 m−2) were higher than oyster densities (139.4 ± 11.7 m−2; Online Resource 5). In addition, all targeted parasite species were found at all
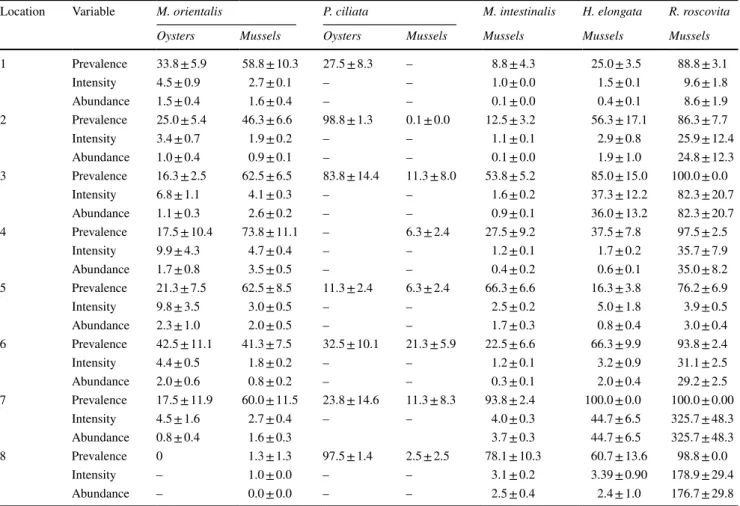
Table 2 Prevalence (%), intensity and abundance (± SE) of the five parasite species in native blue mussels (Mytilus edulis) and invasive Pacific oysters (Magallana gigas) sampled at eight locations in the Wadden Sea (for map of locations see Fig. 1)
The parasites play a role in parasite spillover (Mytilicola orientalis), spillback (Polydora ciliata) and transmission interference (Mytilicola intes- tinalis, Himasthla elongata and Renicola roscovita) induced by invasive oysters. Intensity data of P. ciliata, and prevalences of P. ciliata in mus- sels (location 1) and oysters (location 4) were not obtained
Location Variable M. orientalis P. ciliata M. intestinalis H. elongata R. roscovita
Oysters Mussels Oysters Mussels Mussels Mussels Mussels
1 Prevalence 33.8 ± 5.9 58.8 ± 10.3 27.5 ± 8.3 – 8.8 ± 4.3 25.0 ± 3.5 88.8 ± 3.1
Intensity 4.5 ± 0.9 2.7 ± 0.1 – – 1.0 ± 0.0 1.5 ± 0.1 9.6 ± 1.8
Abundance 1.5 ± 0.4 1.6 ± 0.4 – – 0.1 ± 0.0 0.4 ± 0.1 8.6 ± 1.9
2 Prevalence 25.0 ± 5.4 46.3 ± 6.6 98.8 ± 1.3 0.1 ± 0.0 12.5 ± 3.2 56.3 ± 17.1 86.3 ± 7.7
Intensity 3.4 ± 0.7 1.9 ± 0.2 – – 1.1 ± 0.1 2.9 ± 0.8 25.9 ± 12.4
Abundance 1.0 ± 0.4 0.9 ± 0.1 – – 0.1 ± 0.0 1.9 ± 1.0 24.8 ± 12.3
3 Prevalence 16.3 ± 2.5 62.5 ± 6.5 83.8 ± 14.4 11.3 ± 8.0 53.8 ± 5.2 85.0 ± 15.0 100.0 ± 0.0
Intensity 6.8 ± 1.1 4.1 ± 0.3 – – 1.6 ± 0.2 37.3 ± 12.2 82.3 ± 20.7
Abundance 1.1 ± 0.3 2.6 ± 0.2 – – 0.9 ± 0.1 36.0 ± 13.2 82.3 ± 20.7
4 Prevalence 17.5 ± 10.4 73.8 ± 11.1 – 6.3 ± 2.4 27.5 ± 9.2 37.5 ± 7.8 97.5 ± 2.5
Intensity 9.9 ± 4.3 4.7 ± 0.4 – – 1.2 ± 0.1 1.7 ± 0.2 35.7 ± 7.9
Abundance 1.7 ± 0.8 3.5 ± 0.5 – – 0.4 ± 0.2 0.6 ± 0.1 35.0 ± 8.2
5 Prevalence 21.3 ± 7.5 62.5 ± 8.5 11.3 ± 2.4 6.3 ± 2.4 66.3 ± 6.6 16.3 ± 3.8 76.2 ± 6.9
Intensity 9.8 ± 3.5 3.0 ± 0.5 – – 2.5 ± 0.2 5.0 ± 1.8 3.9 ± 0.5
Abundance 2.3 ± 1.0 2.0 ± 0.5 – – 1.7 ± 0.3 0.8 ± 0.4 3.0 ± 0.4
6 Prevalence 42.5 ± 11.1 41.3 ± 7.5 32.5 ± 10.1 21.3 ± 5.9 22.5 ± 6.6 66.3 ± 9.9 93.8 ± 2.4
Intensity 4.4 ± 0.5 1.8 ± 0.2 – – 1.2 ± 0.1 3.2 ± 0.9 31.1 ± 2.5
Abundance 2.0 ± 0.6 0.8 ± 0.2 – – 0.3 ± 0.1 2.0 ± 0.4 29.2 ± 2.5
7 Prevalence 17.5 ± 11.9 60.0 ± 11.5 23.8 ± 14.6 11.3 ± 8.3 93.8 ± 2.4 100.0 ± 0.0 100.0 ± 0.00
Intensity 4.5 ± 1.6 2.7 ± 0.4 – – 4.0 ± 0.3 44.7 ± 6.5 325.7 ± 48.3
Abundance 0.8 ± 0.4 1.6 ± 0.3 3.7 ± 0.3 44.7 ± 6.5 325.7 ± 48.3
8 Prevalence 0 1.3 ± 1.3 97.5 ± 1.4 2.5 ± 2.5 78.1 ± 10.3 60.7 ± 13.6 98.8 ± 0.0
Intensity – 1.0 ± 0.0 – – 3.1 ± 0.2 3.39 ± 0.90 178.9 ± 29.4
Abundance – 0.0 ± 0.0 – – 2.5 ± 0.4 2.4 ± 1.0 176.7 ± 29.8
locations, although not in each host species at every single loca- tion (Table 2). Native blue mussels were infected with five para- site species (the copepods M. orientalis and M. intestinalis, the shell-boring polychaete P. ciliata, and trematodes R. roscovita and H. elongata) with an overall prevalence of 98.4%, while invasive Pacific oysters were only infected with the invasive M.
orientalis and the native P. ciliata, with a total prevalence of 59.8%. Few parasite species tended to co-occur, as was particu- larly the case for the trematodes H. elongata and R. roscovita in mussels (Online Resources 6b, 7b, 8a and 8c).
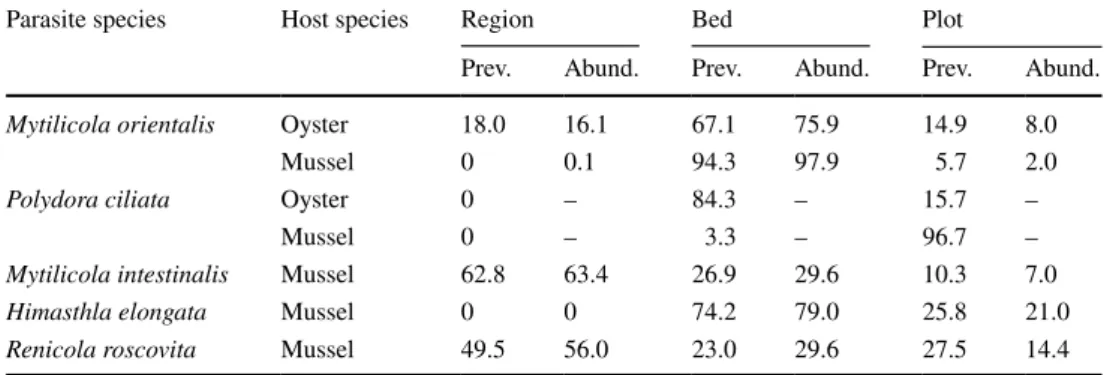
Some parasite species showed a strong regional pattern in their distribution (M. intestinalis and R. roscovita, for which the abundances also highly correlated (Online Resource 8c)), while for other species (H. elongata; M. orientalis in mussels and oysters; P. ciliata in oysters) spatial heteroge- neity was high on a more local (bed) level or even on the smallest scale within beds (P. ciliata in mussels) as indicated by the variance component analyses (Table 3).
Relative contribution of invasive oyster density to infection patterns in native mussels
Pacific oyster density was the factor giving the best fit for M. intestinalis and R. roscovita prevalence (Table 4) and M. intestinalis abundance (Table 5) in mussels. In the par- asitic copepod M. intestinalis, prevalence and abundance were negatively affected by the density of Pacific oysters.
The prevalence of the trematode R. roscovita in mussels increased with oyster density. Oyster density, however, did not come out in the best fitting models of the other three parasite species.
Regarding other factors driving infection levels in native mussels, host size resulted in five models as the best explanatory factor driving parasite prevalence and abundance (Tables 4, 5). Host size was an important factor determining the prevalence of the shell-boring polychaete P. ciliata, the prevalence and abundance of the trematode H. elongata, of abundance of the copepod M. intestinalis
and of the trematode R. roscovita. For the two trematode species, the density of definitive hosts turned out as an additional explanatory factor of infection levels, in particu- lar the density of common gulls (L. canus) for the preva- lence of R. roscovita and the density of eider ducks (S.
mollissima) for the prevalence of H. elongata (Table 4).
However, this pattern was not observed when looking at trematode abundance (Table 5). Instead, the density of first intermediate host species, of the snail L. littorea, was iden- tified as one of the best factors driving H. elongata abun- dances in mussels and the density of second intermediate host species (of the mussel M. edulis) for abundances in mussels (Table 5).
Furthermore, the prevalence of P. ciliata in mussels was negatively affected by the density of the common periwinkle L. littorea, which represents an alternative host species for this shell-boring polychaete. For M. orientalis in mussels, none of the prevalence and abundance models including bio- logical and/or environmental factors was better than the null model (Tables 4, 5).
Looking at infection levels in Pacific oysters, oyster size had a positive effect on P. ciliata prevalence. In addition, prevalence and abundance of M. orientalis in oysters were affected by the environmental factors tidal exposure and salinity (Tables 4, 5).
Importance of oyster hosts for parasite species shared with mussels
Invasive oysters shared two parasite species with native mussels, the invasive copepod M. orientalis via spillover effects and the native polychaete P. ciliata via spillback pro- cesses. Interestingly, for each parasite species there was a clear co-occurrence in mussels and oyster hosts on the plot level (Online Resource 7). However, M. orientalis was more often present in mussel than in oyster hosts (ΔDev. = 130.59, p < 0.001), with prevalences being, on average, twice as high in mussels (average ± SD, 50.8 ± 0.2%) compared to
Table 3 Results of the variance component analyses, with the parasite species, host species and the variance components (% variance) per spatial scale (region, bed or plot)
Variance components were calculated from variances of (intercept only) GLMMs using parasite prevalence (Prev., modelled as presence-absence) and abundance (Abund.) as response variable, and the nested spatial sampling structure as random effect
Parasite species Host species Region Bed Plot
Prev. Abund. Prev. Abund. Prev. Abund.
Mytilicola orientalis Oyster 18.0 16.1 67.1 75.9 14.9 8.0
Mussel 0 0.1 94.3 97.9 5.7 2.0
Polydora ciliata Oyster 0 – 84.3 – 15.7 –
Mussel 0 – 3.3 – 96.7 –
Mytilicola intestinalis Mussel 62.8 63.4 26.9 29.6 10.3 7.0
Himasthla elongata Mussel 0 0 74.2 79.0 25.8 21.0
Renicola roscovita Mussel 49.5 56.0 23.0 29.6 27.5 14.4
oysters (21.7 ± 0.2%). On the other hand, when oysters were infected with M. orientalis, overall intensities were twice as high (average ± SD, 6.2 ± 4.7) than when mussels (2.9 ± 1.2) were infected (ΔDev. = 78.96, p < 0.001). In addition, the maximum intensity of M. orientalis found in oysters was
75, while in mussels a maximum of 11 copepods was found in one individual host. These contradicting patterns resulted in almost similar parasite abundances for mussel (aver- age ± SD, 1.6 ± 1.2) and oyster (1.3 ± 1.2) hosts (ΔDev. = 3.12, p = 0.077). However, as mussels occurred in generally higher
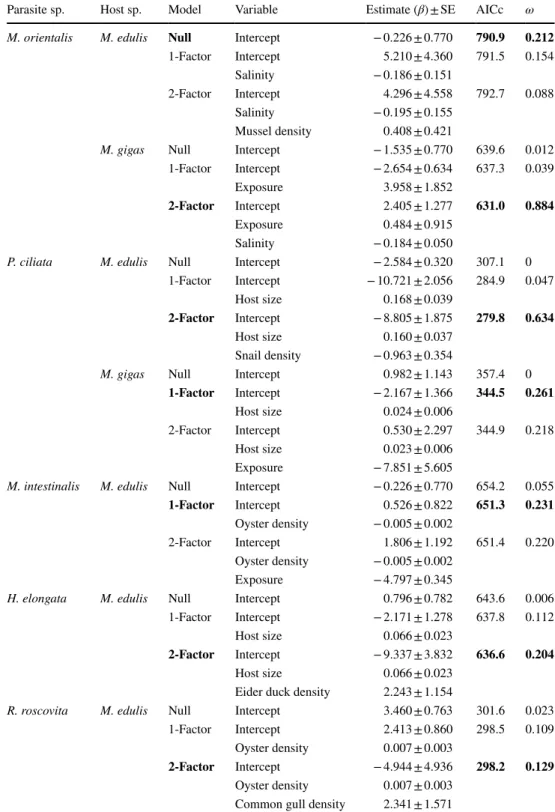
Table 4 Overview of the best one- and two-factor models explaining parasite prevalences of the five parasite species Mytilicola orientalis, Polydora ciliata, Mytilicola intestinalis, Himasthla elongata and Renicola roscovita infecting native blue mussels (Mytilus edulis) and the two parasite species (M. orientalis and P.
ciliata) also infecting invasive Pacific oysters (Magallana gigas)
Best models (in bold) were selected based on their lowest AICc scores and highest Akaike’s weights (ω;
also in bold)
Parasite sp. Host sp. Model Variable Estimate (β) ± SE AICc ω
M. orientalis M. edulis Null Intercept − 0.226 ± 0.770 790.9 0.212
1-Factor Intercept 5.210 ± 4.360 791.5 0.154
Salinity − 0.186 ± 0.151
2-Factor Intercept 4.296 ± 4.558 792.7 0.088
Salinity − 0.195 ± 0.155
Mussel density 0.408 ± 0.421
M. gigas Null Intercept − 1.535 ± 0.770 639.6 0.012
1-Factor Intercept − 2.654 ± 0.634 637.3 0.039
Exposure 3.958 ± 1.852
2-Factor Intercept 2.405 ± 1.277 631.0 0.884
Exposure 0.484 ± 0.915
Salinity − 0.184 ± 0.050
P. ciliata M. edulis Null Intercept − 2.584 ± 0.320 307.1 0
1-Factor Intercept − 10.721 ± 2.056 284.9 0.047
Host size 0.168 ± 0.039
2-Factor Intercept − 8.805 ± 1.875 279.8 0.634
Host size 0.160 ± 0.037
Snail density − 0.963 ± 0.354
M. gigas Null Intercept 0.982 ± 1.143 357.4 0
1-Factor Intercept − 2.167 ± 1.366 344.5 0.261
Host size 0.024 ± 0.006
2-Factor Intercept 0.530 ± 2.297 344.9 0.218
Host size 0.023 ± 0.006
Exposure − 7.851 ± 5.605
M. intestinalis M. edulis Null Intercept − 0.226 ± 0.770 654.2 0.055
1-Factor Intercept 0.526 ± 0.822 651.3 0.231 Oyster density − 0.005 ± 0.002
2-Factor Intercept 1.806 ± 1.192 651.4 0.220
Oyster density − 0.005 ± 0.002
Exposure − 4.797 ± 0.345
H. elongata M. edulis Null Intercept 0.796 ± 0.782 643.6 0.006
1-Factor Intercept − 2.171 ± 1.278 637.8 0.112
Host size 0.066 ± 0.023
2-Factor Intercept − 9.337 ± 3.832 636.6 0.204
Host size 0.066 ± 0.023
Eider duck density 2.243 ± 1.154
R. roscovita M. edulis Null Intercept 3.460 ± 0.763 301.6 0.023
1-Factor Intercept 2.413 ± 0.860 298.5 0.109
Oyster density 0.007 ± 0.003
2-Factor Intercept − 4.944 ± 4.936 298.2 0.129 Oyster density 0.007 ± 0.003
Common gull density 2.341 ± 1.571
densities than oysters (Online Resource 5), the density of infected hosts was at all locations larger in mussels than in oysters (Fig. 2a). Consequently, M. orientalis population densities in the Wadden Sea were much higher in native mussel compared to invasive oyster hosts (Fig. 3). More specifically, at locations where M. orientalis was abundant (at all locations, except for location 8), parasite population densities were 2–35 times larger in native mussels than in invasive oysters (Fig. 3).
For the native polychaete P. ciliata, the importance of oyster hosts for the parasite population density was less clear. Although prevalences of the polychaete were five times higher in oysters (average ± SD, 57.9 ± 0.4%) than in mussels (10.2 ± 0.11%; ΔDev. = 323.94, p < 0.001), this dif- ference was buffered by the high population density of mus- sels, resulting in a lack of an overall pattern in the density of infected hosts (Fig. 2b). At some locations the density of
infected mussels was higher than infected oysters (locations 5 and 6), while at other locations this pattern was reversed (locations 2 and 8) or densities of infected hosts were similar (locations 3 and 7; Fig. 2b).
Discussion
Effects of non‑native oyster density
Contrary to expectation, Pacific oyster density was not included in most of the best models explaining parasite prevalence or abundance in native mussels. Oyster density only explained prevalence and abundance of the copepod M. intestinalis and prevalence of the trematode R. rosco- vita. In the case of M. intestinalis, oyster density negatively affected the prevalence and abundance of the parasite in
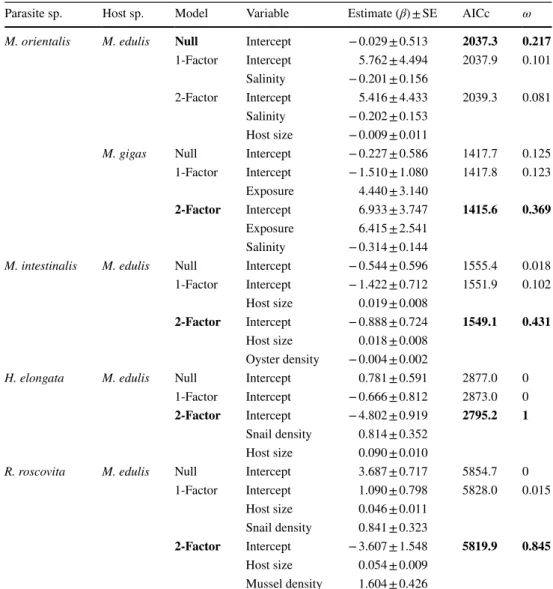
Table 5 Overview of the best one- and two-factor models explaining parasite abundance of the four parasite species Mytilicola orientalis, Mytilicola intestinalis, Himasthla elongata and Renicola roscovita infecting native blue mussels (Mytilus edulis) and the parasite species M. orientalis also infecting invasive Pacific oysters (Magallana gigas)
Abundance data were not available for the parasite Polydora ciliata. Best models (in bold) were selected based on their lowest AICc scores and highest Akaike’s weights (ω; also in bold)
Parasite sp. Host sp. Model Variable Estimate (β) ± SE AICc ω
M. orientalis M. edulis Null Intercept − 0.029 ± 0.513 2037.3 0.217
1-Factor Intercept 5.762 ± 4.494 2037.9 0.101
Salinity − 0.201 ± 0.156
2-Factor Intercept 5.416 ± 4.433 2039.3 0.081
Salinity − 0.202 ± 0.153 Host size − 0.009 ± 0.011
M. gigas Null Intercept − 0.227 ± 0.586 1417.7 0.125
1-Factor Intercept − 1.510 ± 1.080 1417.8 0.123 Exposure 4.440 ± 3.140
2-Factor Intercept 6.933 ± 3.747 1415.6 0.369 Exposure 6.415 ± 2.541
Salinity − 0.314 ± 0.144
M. intestinalis M. edulis Null Intercept − 0.544 ± 0.596 1555.4 0.018 1-Factor Intercept − 1.422 ± 0.712 1551.9 0.102
Host size 0.019 ± 0.008
2-Factor Intercept − 0.888 ± 0.724 1549.1 0.431 Host size 0.018 ± 0.008
Oyster density − 0.004 ± 0.002
H. elongata M. edulis Null Intercept 0.781 ± 0.591 2877.0 0
1-Factor Intercept − 0.666 ± 0.812 2873.0 0 2-Factor Intercept − 4.802 ± 0.919 2795.2 1
Snail density 0.814 ± 0.352 Host size 0.090 ± 0.010
R. roscovita M. edulis Null Intercept 3.687 ± 0.717 5854.7 0
1-Factor Intercept 1.090 ± 0.798 5828.0 0.015
Host size 0.046 ± 0.011 Snail density 0.841 ± 0.323
2-Factor Intercept − 3.607 ± 1.548 5819.9 0.845 Host size 0.054 ± 0.009
Mussel density 1.604 ± 0.426
native mussels. Previous studies have not reported M. intes- tinalis in invasive oysters (Elsner et al. 2011; Goedknegt et al. 2017) and controlled infections were not success- ful (Elsner et al. 2011; M; Feis pers. comm.), suggesting that the Pacific oyster is not a competent host for M. intes- tinalis. Therefore, oysters may act as a sink (Elsner et al.
2011; Goedknegt et al. 2017) but the exact mechanism is yet unknown. In contrast to the negative effects on parasitic copepods, oyster density had a positive effect on R. rosco- vita prevalence in native mussels. This was not anticipated given the known negative effects of oysters on trematode infective stages via transmission interference (Thieltges et al.
2008, 2009; Goedknegt et al. 2015). The obvious explana- tion that oyster density could positively correlate with the
densities of the first intermediate snail host of the parasite does not hold true, as exploratory investigations prior to the statistical analyses could not find any correlations between both variables. Alternatively, oysters may affect R. roscovita infection levels in mussels via the three-dimensional matrix structure they create. Most mussels are found deep in the oyster matrix where they gain protection from predation and detrimental barnacle epibionts (Eschweiler and Christensen 2011; Buschbaum et al. 2016). Experimental studies indicate that this position of mussels inside the matrix leads to higher prevalence and intensities of R. roscovita in mussels com- pared to conspecifics positioned on top of the matrix (Goed- knegt 2017). Possibly, at the bottom of the oyster matrix, first intermediate snail hosts locally produce infective R.
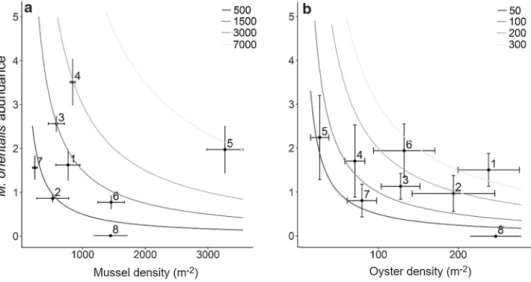
Fig. 2 Mean density m− 2 (± SE) of infected blue mussel (Mytilus edulis; black dots; N = 28 plots) and Pacific oyster (Magallana gigas;
grey triangles; N = 28 plots) hosts for the parasites a Mytilicola ori- entalis and b Polydora ciliata, the two parasite species infecting both
host species. Infected host density of P. ciliata at location 1 (for mus- sels) and location 4 (for oysters) are missing because of the lack of prevalence data at these locations. Numbering of locations is as in Fig. 1
Fig. 3 Mean abundance (± SE) of the invasive parasite Mytilicola orientalis versus the mean density (± SE) of a blue mussels (Mytilus edulis; N = 32 plots) and b Pacific oysters (Magallana gigas; N = 32 plots) at each of the eight sampled bivalve beds (indicated by black numbering, numbering of loca- tions as in Fig. 1). Grey-scaled isoclines represent parasite population densities m− 2
roscovita stages which are concentrated and trapped by the oyster structure (Goedknegt 2017). With increasing oyster density, the structural complexity will also increase and likely result in the observed positive effect of oyster density on infection levels in mussels.
Effects of host size
The lack of oyster density in the best models explaining infection patterns of M. orientalis, P. ciliata and H. elon- gata in native mussels suggests that the dynamics of many parasite species are rather driven by other biotic and envi- ronmental drivers than the density of the invasive species.
According to the best models identified in the GLMMs, host size was one of these factors as mussel size was an impor- tant positive driver of P. ciliata and H. elongata prevalence, and of M. intestinalis, H. elongata and R. roscovita abun- dance, which was expected according to our hypothesis. A positive relationship between host size and infection levels could reflect a relationship with host age, with older hosts accumulating more infections over time, which has been previously suggested for P. ciliata infecting mussels and periwinkles (Ambaryianto and Seed 1991; Warner 1997) and H. elongata infecting mussels (Nikolaev et al. 2006).
However, the positive effect of host size does not necessar- ily have to be age-related but can also correspond with the larger shell surface area that is available for P. ciliata infec- tion and enhanced filtration currents exerted by larger mol- luscs, enabling these individuals to inhale larger quantities of free-living infective stages of endoparasites resulting in higher infection levels (Nikolaev et al. 2006). Furthermore, the low number of smaller mussels with Polydora mark- ings may be explained by the higher vulnerability of smaller, infected mussels to crab predation (Ambaryianto and Seed 1991) as has previously been shown for periwinkles L. lit- torea (Buschbaum et al. 2007).
Effects of alternative and obligatory host density In addition to host size, the density of alternative hosts or obligatory hosts required to complete a life cycle, turned out to be important biological variables determining infection levels in mussels. For example, for P. ciliata which infects mussels and oysters, native periwinkles (L. littorea) are an important alternative host and therefore it is not surpris- ing that snail density also showed to be an important factor negatively affecting Polydora infections in mussels. When more periwinkles are present, parasite prevalence in mussels decreases, suggesting that periwinkles are probably a more important host than native mussels. As this effect was not observed for P. ciliata in oysters, periwinkles are probably not dominant over the invasive host species, but more exper- imental work needs to be conducted to test what the exact
host preference of the parasite actually is. For the trematodes H. elongata and R. roscovita with complex life cycles, den- sities of upstream and downstream hosts in the life cycle were identified as important determinants of infection levels in mussels. Densities of the definitive bird host, more spe- cifically eider ducks (S. mollissima) and common gulls (L.
canus), were, respectively, driving H. elongata and R. rosco- vita prevalences. Gull density was also found to be a driving factor of R. roscovita prevalence and intensity in blue mus- sels in the Arctic (Galaktionov et al. 2015). Furthermore, the density of the first intermediate snail host, L. littorea, was identified to be an important factor to determine H. elon- gata abundances in the mussel host, while for R. roscovita the density of the mussel host itself was positively affecting abundances of this parasite. The importance of obligatory hosts as driving factors of trematode infection levels is not surprising, as trematode species require the presence of all three hosts to complete their life cycle (Werding 1969).
Importance of environmental factors
Regarding environmental factors, tidal exposure and salin- ity only appeared in the best fitting model of M. orientalis infecting oysters. Exposure time positively affected M. ori- entalis prevalences in oysters. This was surprising, as an inverse relationship between the degree of exposure and infection rates has previously been found for M. intestinalis in mussels, which was attributed to the shorter submersion time of hosts in the water, limiting the time window of free- swimming infective copepodid larvae to locate and infect their host (Bolster 1954; Davey and Gee 1976). On the rea- sons behind the positive effect of exposure time on M. ori- entalis infection levels in oysters we can only speculate. For example, less submersion time means less exposure to cur- rents directing the larvae away from their hosts, potentially explaining the effect found. Alternatively, mussels higher on the mudflat might be present in higher densities, presenting a source of copepodid larvae to the oysters. The negative effect of salinity confirms earlier findings from the North Pacific where higher prevalences were reported from mus- sels (Mytilus trossulus) situated in sheltered estuarine areas compared to mussels at exposed coastal shores (Goater and Weber 1996). The congeneric species M. intestinalis also prefers reduced salinities (Korringa 1968), but salinity was not an important driver of M. intestinalis prevalences and abundances in mussels, suggesting that the invasive M. ori- entalis may be more sensitive to salinity changes than M.
intestinalis.
Potential other factors
Although we have assessed 12 biological and environmental parameters in this study, additional factors could play a role
in determining parasite infection patterns. Among these fac- tors is local water flow velocity. For example, higher para- site prevalences were reported from mussels (M. trossulus) situated in sheltered estuarine areas compared to mussels at exposed coastal shores (Goater and Weber 1996). Another possible variable driving infection levels is the ambient fauna as it can play a role in transmission interference, as some species prey upon free-living stages of parasites. For example, crabs, shrimps and barnacles can reduce the num- ber of trematode infective stages in the water column (Welsh et al. 2014). In addition, sea weeds can physically prevent parasite larvae to infect the host (Welsh et al. 2014). Finally, parasite species already infecting hosts could either prevent the establishment of novel parasite species by occupying infection space or, vice versa, make the host more suscep- tible to novel infections via detrimental effects on the host.
The observed co-occurrence of H. elongata and R. roscovita could be an example of the latter, although the exact mecha- nism needs to be fully explored.
Relative importance of mussel and oyster hosts For parasites infecting both invasive oysters and native mussels (the copepod M. orientalis and the polychaete P.
ciliata) Pacific oysters were expected to be an important determinant in the distribution of both parasite populations.
Indeed, each parasite species tended to co-occur in oyster and mussel hosts on the smallest spatial scale. However, in both cases, oyster density did not affect prevalence or abun- dance in native mussels. In addition, the calculations of para- site population densities in the two host species indicated that the oyster as host species might not be as important as previously thought.
At all locations where M. orientalis occurred, mean prevalences were always higher in mussels but the mean and maximum intensity was higher in oysters. The latter is likely caused by the larger digestive system of oysters, providing the intestinal parasite with ample space for mul- tiple infections, whereas intensities in mussels are limited by mussel size (Goedknegt et al. 2017). Differences in the relative prevalence and intensity of the invasive copepod lead to almost similar abundances of M. orientalis in both host species. Nevertheless, when host density was taken into account, the newly acquired native mussel host appeared to carry the majority of the M. orientalis population in the Wadden Sea. For P. ciliata, the role of oysters for the total parasite population is less clear. The native shell-boring polychaete occurred in native blue mussels and invasive Pacific oysters at all sampled locations across the Wadden Sea. Since its introduction in the 1980s/1990s (Reise 1998;
Drinkwaard 1999; Troost 2010), invasive oysters became an important host for this native shell-boring polychaete spe- cies with average prevalences at present being five times
higher in invasive oysters compared to native mussels.
However, when host density was considered, the share of infected hosts was often still higher in blue mussels relative to oysters. As the lack of a protocol limited us to acquire information on P. ciliata intensities, we do not know how these differences in prevalence relate to relative P. ciliata abundances in both host species, limiting our knowledge on host specific parasite population sizes. Therefore, whether this high competence of invasive oysters results in amplifica- tion of infection levels in native mussels (parasite spillback sensu Kelly et al. 2009) is a topic for further studies. In addi- tion, without intensity information, the potential effects of the parasite on host populations remain to be assessed. The polychaete burrows in mollusc shells, causing reductions in the shell strength and condition (Kent 1979, 1981; Busch- baum et al. 2007) and makes infected hosts more vulnerable to crab predation (Ambaryianto and Seed 1991).
Conclusions
In this study, we have shown that invasive Pacific oysters can contribute to the distribution and abundance of parasite infections in native mussels. However, we could not identify invasive oysters as a universal driver of patterns in parasite infections of native mussels nor as the dominant host for populations of parasites infecting both native mussels and invasive oysters in the invaded region. For the two parasite species that were affected by oysters (M. intestinalis nega- tively and R. roscovita positively), oysters did not act as a host species, but influenced parasite populations by a more indirect way (i.e., via the filtering of infective stages or habi- tat effects). For the other parasite species, infections were further mediated by other biotic and environmental factors, limiting the role of oysters in determining infection levels of those parasites. This also seems to be the case in the two parasite species (M. orientalis and P. ciliata) infecting both oysters and mussels where parasite densities were mostly higher in the native mussels, suggesting a dominant role of the native species for the parasite populations of those species. The results of this case study demonstrate the use- fulness of large-scale field studies in identifying the mecha- nisms underlying the impacts of invasive species on native parasite–host communities.
Acknowledgements We are grateful to B.D.H.K. Eriksson of the Uni- versity of Groningen (The Netherlands) for the provision of lab space during our field sampling campaign. We also thank the volunteers who assisted us with transport, field and lab work: Ewout Adriaans, Christian Einer, Jarco Havermans, Jonas Martin, Fokje Schaafsma, and Samira Theis. For the permission to use bird data from the Trilateral Monitoring and Assessment Programme (TMAP) carried out in the Wadden Sea by The Netherlands, Germany and Denmark, we thank SOVON (in particular Erik van Winden), Rijkswaterstaat, Wageningen Marine Research (WMR), Staatliche Vogelschutzwarte (Lower Saxony