Development of Mobile Data Collection Applications by Domain Experts:
Experimental Results from a Usability Study
Johannes Schobel1, R¨udiger Pryss1, Winfried Schlee2, Thomas Probst1, Dominic Gebhardt1, Marc Schickler1, Manfred Reichert1
1 Institute of Databases and Information Systems, Ulm University, Ulm, Germany
2 Department of Psychiatry and Psychotherapy, Regensburg University, Germany {johannes.schobel, ruediger.pryss, thomas.probst, dominic.gebhardt, marc.schickler,
manfred.reichert}@uni-ulm.de, winfried.schlee@gmail.com
Abstract. Despite their drawbacks, paper-based questionnaires are still used to collect data in many application domains. In the QuestionSys project, we develop an advanced framework that enables domain experts to transform paper-based instruments to mobile data collection applica- tions, which then run on smart mobile devices. The framework empow- ers domain experts to develop robust mobile data collection applications on their own without the need to involve programmers. To realize this vision, a configurator component applying a model-driven approach is developed. As this component shall relieve domain experts from techni- cal issues, it has to be proven that domain experts are actually able to use the configurator properly. The experiment presented in this paper investigates the mental efforts for creating such data collection applica- tions by comparing novices and experts. Results reveal that even novices are able to model instruments with an acceptable number of errors. Alto- gether, the QuestionSys framework empowers domain experts to develop sophisticated mobile data collection applications by orders of magnitude faster compared to current mobile application development practices.
Keywords: Process-driven applications, End-user programming, Ex- perimental results
1 Introduction
Self-report questionnaires are commonly used to collect data in healthcare, psy- chology, and social sciences [8]. Although existing technologies enable researchers to create questionnaires electronically, the latter are still distributed and filled out in apaper-and-pencil fashion. As opposed to paper-based approaches, elec- tronic data collection applications enable full automation of data processing (e.g., transfering data to spreadsheets), saving time and costs, especially in the context of large-scale studies (e.g., clinical trials). According to [15], approxi- mately 50-60% of the data collection costs can be saved when using electronic instead of paper-based instruments. Besides this, the electronic instruments do
not affect psychometric properties [5], while enabling a higher quality of the collected data [14]. In this context, [12] confirms that mobile data collection applications allow for more complete datasets compared to traditional paper- based ones. Additionally, the collected data can be directly stored and processed, whereas paper-based approaches require considerable manual efforts to digitize the data. Note that this bears the risk of errors and decreases data quality. In general, electronic questionnaires are increasingly demanded in the context of studies [11]. However, the development of mobile data collection applications with contemporary approaches requires considerable programming efforts. For example, platform-specific peculiarities (e.g., concerning user interfaces) need to be properly handled. Furthermore, profound insights into mobile data collec- tion scenarios are needed. Especially, if more sophisticated features are required to guide inexperienced users through the process of data collection, hard-coded mobile applications become costly to maintain. Note that adapting already de- ployed and running mobile applications is challenging, as the consistency of the data collected needs to be ensured.
To relieve IT experts from these challenges and to give control back to domain experts, theQuestionSys framework is developed. The latter aims at supporting domain experts in collecting large amounts of data using smart mobile devices.
QuestionSys offers a user-friendly configurator for creating flexible data collec- tion instruments. More precisely, it relies on process management technology and end-user programming techniques. Particularly, it allows domain experts without any programming skills to graphically model electronic instruments as well as to deploy them to smart mobile devices. Furthermore, the framework provides a lightweight mobile process engine that executes the individually configured questionnaires on common smart mobile devices.
To demonstrate the feasibility and usability of the QuestionSys framework, this paper presents results from a controlled experiment evaluating the config- urator component we implemented. For this purpose, subjects were asked to create data collection instruments. Altogether, the results indicate that domain experts are able to properly realize mobile data collection applications on their own using the configurator. The paper is structured as follows: In Section 2, fun- damentals of the QuestionSys framework are introduced. Section 3 presents the conducted experiment, while Section 4 discusses experimental results. Related work is discussed in Section 5; Section 6 summarizes the paper.
2 Mobile Data Collection with QuestionSys
This section introduces the fundamental concepts of the QuestionSys framework.
In particular, we focus on the configurator component, which will be evaluated in the presented experiment.
2.1 The QuestionSys Framework
The main goal of the QuestionSys framework is to enable domain experts (e.g., physicians, psychologists) that have no programming skills to develop sophisti-
Alcohol Consumption
Cigarette Consumption
StartFlow
Activity XORjoin
DataElement
WriteAccess ReadAccess
EndFlow
ET_ControlFlow_Default ET_DataFlow Alcohol
Cigarettes
(Cigarettes = yes)AND (Alcohol = yes)
XORsplit else (Cigarettes = yes) AND (Alcohol = no)
ET_ControlFlow
Cigarettes
& Alcohol
Page Intro
Page
General Cigarettes End
Process-Centric Instrument Logic
1) Configurator 3) Process-Driven Mobile
Data Collection Application 2) Process Model
Lightweight Process Engine for Process Execution and Monitoring
Sensor Framework To Integrate Hardware
UI Generator with Custom Control Elements Create Mobile Data Collection
Instrument through End-User Programming
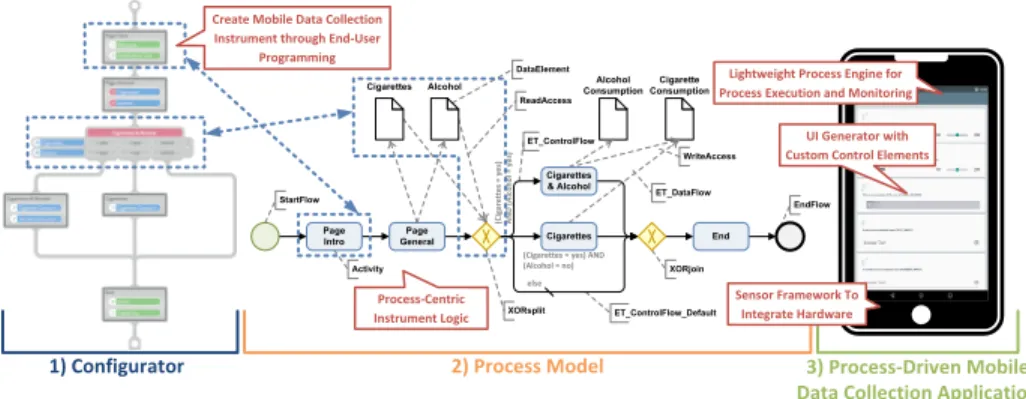
Fig. 1. The QuestionSys Approach: (1) Modeling a Data Collection Instrument; (2) Mapping it to an Executable Process Model; (3) Executing it on a Smart Mobile Device.
cated data collection instruments as well as to deploy and execute them on smart mobile devices. In particular, development costs shall be reduced, development time be fastened, and the quality of the collected data be increased. Moreover, changes of already running data collection applications shall be possible for do- main experts themselves without the need to involve IT experts [21].
In order to enable domain experts to develop flexible mobile applications themselves, a model-driven approach is introduced. This approach allows de- scribing the logic of an instrument in terms of an executable process model (cf.
Fig. 1). The latter can then be interpreted and executed by a lightweight process engine running on smart mobile devices [20]. By applying this approach, process logic and application code are separated [17]. The process model acts as a schema for creating and executing process instances (i.e., questionnaire instances). The process model itself consists of process activities as well as the control and data flow between them. Gateways (e.g., XORsplit) are used to describe more com- plex questionnaire logic. Following this model-driven approach, both the content and the logic of a paper-based instrument can be mapped to a process model.
Pages of an instrument directly correspond to process activities; the flow be- tween them, in turn, matches thenavigation logicof the instruments.Questions are mapped to process data elements, which are connected to activities using READ or WRITE data edges. These data elements are used to store answers to various questions when executing the instrument on smart mobile devices. Alto- gether, QuestionSys applies fundamental BPM principles in a broader context, thus enabling novel perspectives for process-related technologies.
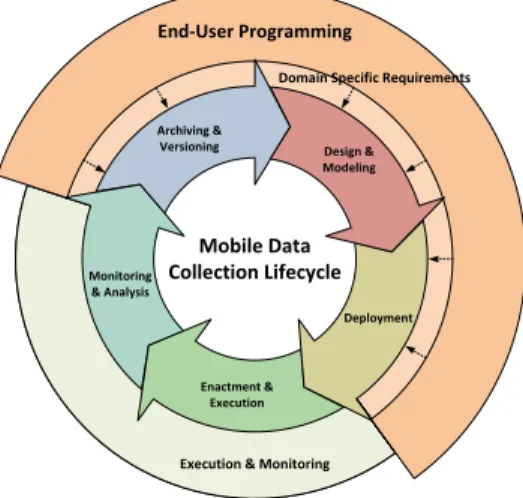
To properly support domain experts, the QuestionSys framework considers the entireMobile Data Collection Lifecycle(cf. Fig. 2). TheDesign & Modeling phase allows designing sophisticated data collection instruments. During the Deployment phase, the modeled instrument is transferred to and installed on registered smart mobile devices. In theEnactment & Execution phase, multiple instances of the respective mobile data collection instrument may be executed on a smart mobile device. TheMonitoring & Analysis phase evaluates the collected
Archiving &
Versioning
Monitoring
& Analysis
Enactment &
Execution
Deployment Design &
Modeling
Mobile Data Collection Lifecycle
Domain Specific Requirements
Execution & Monitoring
End-User Programming
Fig. 2.Mobile Data Collection Lifecycle
data in real-time on the smart mobile device. Finally, different releases of the data collection instrument can be handled in theArchiving & Versioning phase.
In order to address domain-specific requirements on one hand and to support domain experts on the other, technologies known from end-user programming are applied [21]. The presented study focuses on the configurator component of the presented framework. The latter covers theDesign & Modeling,Deployment andArchiving & Versioning phases of the lifecycle.
2.2 Configurator Component
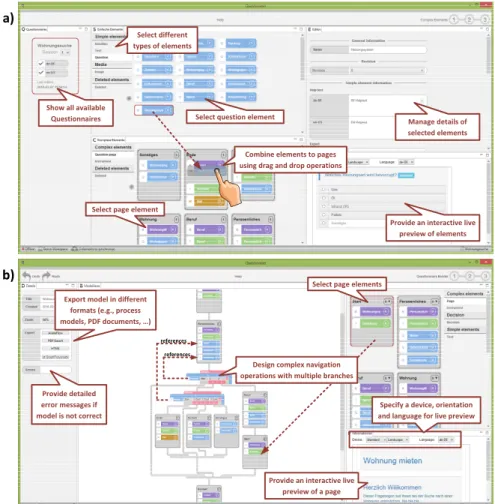
The configurator component we developed (cf. Fig. 3) applies techniques known from end-user programming and process management technology to empower domain experts to create flexible data collection instruments on their own. Due to lack of space, this component is only sketched here [19]:
a) Element and Page Repository View(cf. Fig. 3a). The element repos- itory allows creating basic elements of a questionnaire (e.g., headlines and ques- tions). The rightmost part shows the editor, where particular attributes of the respective elements may be edited. Note that the configurator allows handling multiple languages. It further keeps track of different element revisions. Finally, created elements may be combined to pages using drag and drop operations.
b) Modeling Area View(cf. Fig. 3b). Domain experts may use previously created pages and drag them to the model in the center part. Furthermore, they are able to model sophisticated navigation operations to provide guidance during the data collection process. The graphical editor, in turn, strictly follows a correctness-by-construction approach; i.e., it is ensured that created models are executable by the lightweight process engine that runs on heterogeneous
Show all available
Questionnaires Select question element
Select different types of elements
Combine elements to pages using drag and drop operations
Provide an interactive live preview of elements
Manage details of selected elements
Select page element
Export model in different formats (e.g., process models, PDF documents, …)
Select page elements
Provide detailed error messages if model is not correct
Provide an interactive live preview of a page
Specify a device, orientation and language for live preview Design complex navigation
operations with multiple branches references
references
a)
b)
Fig. 3.The QuestionSys Configurator: (a) Combining Elements to Pages; (b) Modeling a Data Collection Instrument.
smart mobile devices. When deploying the model to smart mobile devices, it is automatically mapped to an executable process model.
Altogether, the configurator component and its model-driven approach allow domain experts to visually define data collection instruments. Thus, development time can be reduced and data collection applications can be realized more easily.
3 Experimental Setting
In order to ensure that domain experts are able to properly work with the con- figurator component, the overall concept presented in Section 2 needs to be evaluated. This section presents a controlled experiment, whose goal is to eval- uate the feasibility and usability of the configurator component. In particular, we provide insights into the subjects and variables selected. Finally, we present
the experimental design. Note that the latter constitutes a valuable template for conducting mental effort experiments on mobile data collection modeling approaches in general. Furthermore, when using the presented experimental set- ting, gathered results may indicate further directions on how to integrate mobile data collection with existing information systems.
3.1 Goal Definition
When developing an application, various software developing models (e.g., water- fall, V-model, SCRUM) may be chosen. Although these models includetestingor validation phases, it cannot be guaranteed that end-users accept the final soft- ware product. Therefore, additional aspects need to be covered. For example, ISO25010 defines main software product quality characteristics, like functional suitability, performance efficiency, usability, and security [16]. The experiment presented in this paper, focuses on the usability of the presented configurator component. In particular, the experiment investigates whether domain experts understand the provided modeling concept and, therefore, are able to work prop- erly with the configurator. For the preparation of the experiment, theGoal Ques- tion Metric(GQM) [2] is used in order to properly set up the goal (cf. Table 1).
Based on this, we defined our research question:
Research Question
Do end-users understand the modeling concept of the questionnaire con- figurator with respect to the complexity of the provided application?
The subjects recruited for the experiment are students from different domains as well as research associates. [9] discusses that students can act as proper sub- stitutes for domain experts in empirical studies. We do not require specific skills or knowledge from the subjects. The conducted experiment considers two in- dependent variables (i.e., factors). First, we consider the experience level of the respective subjects with its two levelsnovice and expert. We assign subjects to one of the two groups based on answers regarding prior experience in process modeling given in the demographic questionnaire. In applied settings, novices would be domain experts with little experience in process modeling and experts would be domain experts with more experience in process modeling. Another variable we consider is the difficulty level of the task to be handled by the sub- jects (i.e.,easy andadvanced levels). As a criterion for assessing the complexity
Analyze the questionnaire configurator for the purpose of evaluating the concept
with respect to the intuitiveness of the modeling concept from the point of developers and researchers
in the context of students and research associates in a controlled environment.
Table 1.Goal Definition
of a task, we decide to focus on the number of pages and decisions as well as the number of branches of the instrument to be modeled.
Twodependent variablesare selected to measure an effect when changing the above mentioned factors. The experiment focuses on the time needed to solve the respective tasks as well as thenumber of errors in the resulting data collec- tion instrument. We assume that prior experience in process modeling directly influences the subject’s time to complete the tasks. In particular, we expect that experts are significantly faster than novices when modeling instruments. In order to automatically measure both dependent variables, a logging feature is added to the configurator. This feature, in turn, allows generating an execution log file containing all operations (i.e., all modeling steps) of respective subjects. We further record snapshots (i.e., images) of the data collection instrument modeled by a subject after each operation in order to allow for a graphic evaluation as well. The errors made are classified manually based on the submitted model and are weighted accordingly. Finally, hypotheses were derived (cf. Table 2).
3.2 Experimental Design
To be able to quickly react to possible malfunctions, the study is conducted as an offline experiment in a controlled environment. For this scenario, the computer lab of the Institute of Databases and Information Systems at Ulm University is prepared accordingly. The lab provides 10 workstations, each comparable with respect to hardware resources (e.g., RAM or CPU cores). Each workstation is equipped with one monitor using a common screen resolution. Before the exper- iment is performed, respective workstations are prepared carefully. This includes re-installing the configurator component and placing the consent form, task de- scriptions, and mental effort questionnaires beside each workstation.
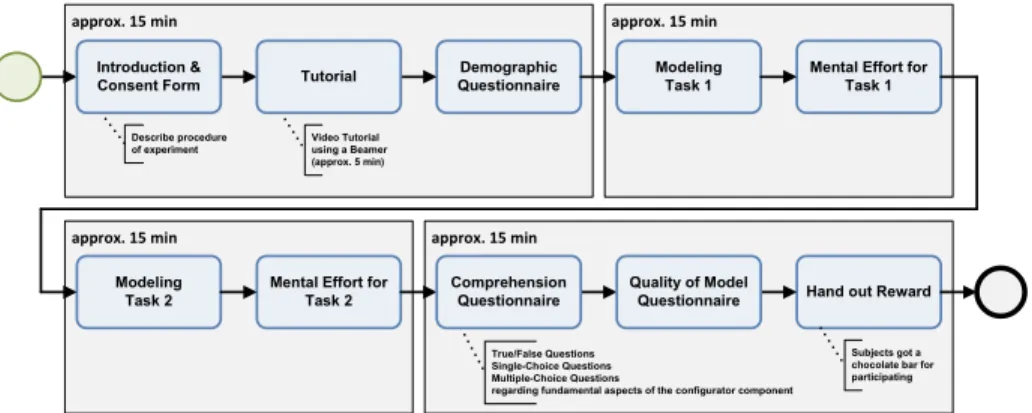
The procedure of the experiment is outlined in Fig. 4: The experiment starts with welcoming the subjects. Afterwards, the goal of the study is described and the overall procedure is introduced. Then, the subjects are asked to sign an informed consent form. Next, we provide a 5 minutes live tutorial to demonstrate the most important features of the configurator component. Up to this point, the subjects may ask questions. Following this short introduction, the subjects are asked to fill in a demographic questionnaire that collects personal information.
Ha0 Novices are not slower when solving advanced tasks compared to easy tasks.
Ha1 Novices are significantly slower when solving advanced tasks compared to easy tasks.
Hb0 Experts are not slower when solving advanced tasks compared to easy tasks.
Hb1 Experts are significantly slower when solving advanced tasks compared to easy tasks.
Hc0 Novices do not make more errors when solving advanced tasks compared to easy tasks.
Hc1 Novices make significantly more errors when solving advanced tasks compared to easy tasks.
Hd0 Experts do not make more errors when solving advanced tasks compared to easy tasks.
Hd1 Experts make significantly more errors when solving advanced tasks compared to easy tasks.
He0 Novices are not slower than experts when solving tasks.
He1 Novices are significantly slower than experts when solving tasks.
Hf0 Novices do not make more errors than experts when solving tasks.
Hf1 Novices make significantly more errors than experts when solving tasks.
Table 2.Derived Hypotheses
approx. 15 min
Demographic Questionnaire
approx. 15 min
Modeling Task 1
Mental Effort for Task 1
approx. 15 min
Video Tutorial using a Beamer (approx. 5 min)
Modeling Task 2
Mental Effort for Task 2
approx. 15 min
Hand out Reward Describe procedure
of experiment
True/False Questions Single-Choice Questions Multiple-Choice Questions
regarding fundamental aspects of the configurator component Tutorial
Quality of Model Questionnaire Introduction &
Consent Form
Comprehension Questionnaire
Subjects got a chocolate bar for participating
Fig. 4.Experiment Design
Afterwards, subjects have to model their first data collection instrument using the configurator, followed by filling in questions regarding their mental effort when handling respective task. Then, subjects have to model a second instrument (with increasing difficulty) and answer mental effort questions again. Thereby, subjects need to answer comprehension questions with respect to fundamental aspects of the developed configurator component. In the following, one final questionnaire dealing with the quality of the modeled data collection instruments has to be answered. Altogether, the experiment took about 60 minutes in total1.
4 Evaluation
A total of 44 subjects participated in the experiment. Prior to analyzing the results, data is validated. [23] states that it has to be ensured that all subjects understand the tasks as well as the forms to be processed. Furthermore, invalid data (e.g., due to non-serious participation) has to be detected and removed. Two datasets need to be excluded due to invalidity (one participant aborts the study during Task 2) and doubts regarding the correctness of demographic information (>20 years of process modeling experience). After excluding these datasets, the final sample comprises 42 subjects. Based on their prior experience in process modeling, subjects are divided into two groups. Applying our criterion (have read no more than 20 process models or have created less than 10 process models within the last 12 months) finally results in 24 novices and 18 experts. Most of the subjects receive between 15 and 19 years of education up to this point.
As no special knowledge is required for participating (besides prior experience in process modeling to count asexpert), we consider the collected data as valid with respect to the goal of the study.
First, thetotal time (sec) subjects need to complete both modeling tasks is evaluated (cf. Table 3). Overall, novices need less time than experts to complete
1 The dataset can be found at https://www.dropbox.com/s/tjte18zfu1j4bfk/dataset.zip
●
●
●
●●
●
●
●
0 200 400 600 800 1000 1200 1400
Task 1 Task 2
Total Time (sec)
Fig. 5.Total Time (Novices)
0 200 400 600 800 1000 1200 1400
Task 1 Task 2
Total Time (sec)
Fig. 6.Total Time (Experts)
respective tasks. This may be explained by the fact that novices are not as con- scientious as experts. Possibly, novices do not focus on all details needed to create data collection instruments. Next, the difference in the median is approximately 80 sec. for Task 1. The time to complete Task 2, however, barely differs for both groups. Furthermore, both groups need less time for modeling Task 1. Given the fact that Task 2 is more complex than the first one, this can be explained as well. Figs. 5 and 6 present boxplots for the total time needed. Note that the plot for novices indicates outliers in both directions. All outliers are carefully analyzed to check whether they need to be removed from the dataset. However, when considering other aspects (e.g., the number of errors), it can be shown that the outliers represent valid datasets and, therefore, must not be removed.
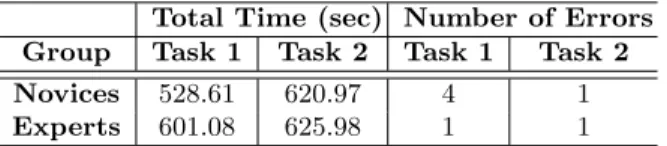
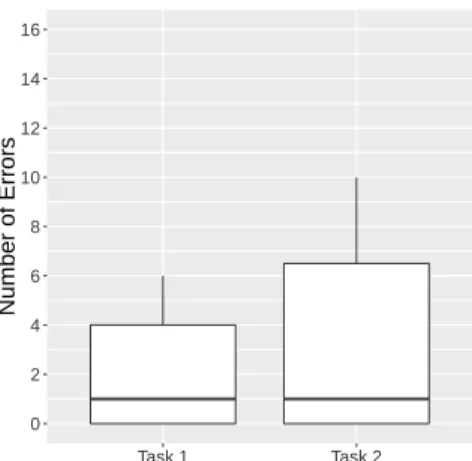
Second, thenumber of errorsin the resulting models are evaluated (cf. Table 3). As expected, experts make fewer errors than novices in the context of Task 1. Considering the results for the time needed, one can observe that novices are faster, but produce more errors than experts when accomplishing Task 1. When modeling Task 2, however, both groups can be considered the same. This may be explained by the fact that experts have prior knowledge with respect to process modeling. Furthermore, it is conceivable that some kind of learning effect has taken place during Task 1 as novices make fewer errors when performing the second one. Boxplots in Figs. 7 and 8 show results for each task. Again, outliers can be observed in the group of novices.
Total Time (sec) Number of Errors Group Task 1 Task 2 Task 1 Task 2
Novices 528.61 620.97 4 1
Experts 601.08 625.98 1 1
Table 3.Total Time and Number of Errors when Handling Tasks (Median Values)
●
●
●
●
●
●
0 2 4 6 8 10 12 14 16
Task 1 Task 2
Number of Errors
Fig. 7.Number of Errors (Novices)
0 2 4 6 8 10 12 14 16
Task 1 Task 2
Number of Errors
Fig. 8.Number of Errors (Experts)
Third,mental effort and comprehension questionnaires are evaluated with respect to the previously mentioned variables. Recall that each subject has to fill in a short questionnaire after handling a certain task (cf. Table 4, top part).
Figs. 9 and 10 show respective medians. The calculated score (median value) for the comprehension questionnaire is shown in Table 5. We consider the results for both the mental effort and comprehension questionnaire as reasonable. Table 4 (bottom part) shows the questions for rating the model quality when completing the experiment (cf. Fig. 11). When combining answers of the subjects (e.g., how satisfied they are with their own models) with the analysis of the errors made, results are convincing. Interestingly, novices rate their models better compared to experts. Note that from 84 data collection instruments in total (Task 1 and Task 2 combined), 43 models (21 models from novices and 22 from experts) have zero or one error. The results regarding mental effort, comprehension, and model quality questionnaires as well as the submitted instrument models do not differ largely among the two groups. Therefore, our results indicate that the modeling concept of the developed configurator component is intuitive and end-users with relatively low prior process modeling experience are able to use the configurator.
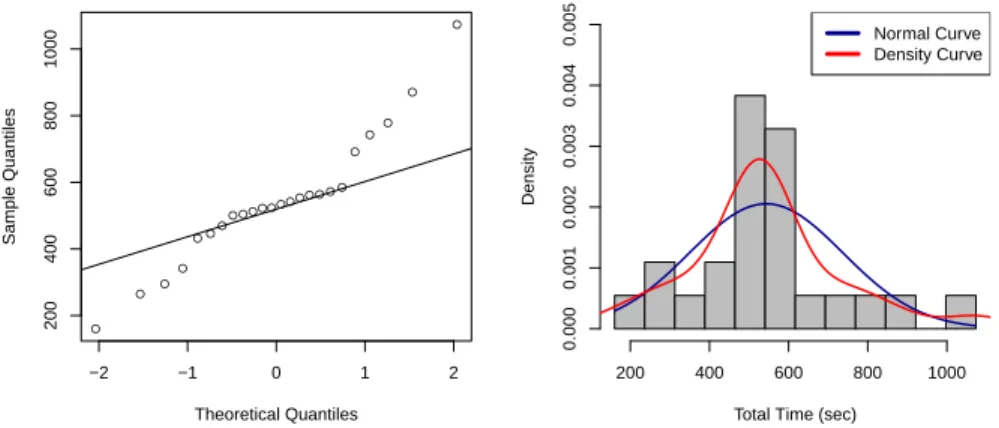
The collected data is further checked for its normal distribution (cf. Fig. 12).
The first graph shows a quantile-quantile (Q-Q) graph plotting the quantiles of
Question Answers
The mental effort for creating the questionnaire model was considerably high. 7 Point Likert-Scale The mental effort for changing elements was considerably high. 7 Point Likert-Scale I was able to successfully solve the task. 7 Point Likert-Scale Do your models represent the questionnaires in the given tasks? 7 Point Likert-Scale Are there significant aspects that are missing in your models? 7 Point Likert-Scale Do your models represent the logic of the given questionnaires exactly? 7 Point Likert-Scale Are there any significant errors in your models? 7 Point Likert-Scale Would you change your models if you were allowed to? 7 Point Likert-Scale
Table 4.Mental Effort Questionnaires
1 2 3 4 5 6 7
Modeling (higher = better)
Change Request (higher = better)
Correctness (lower = better)
Task 1 Task 2
n = 42
Fig. 9.Mental Effort (Novices)
1 2 3 4 5 6 7
Modeling (higher = better)
Change Request (higher = better)
Correctness (lower = better)
Task 1 Task 2
n = 42
Fig. 10.Mental Effort (Experts)
1 2 3 4 5 6 7
Correct Model (lower = better)
Missing Aspects (higher = better)
Correct Logic (lower = better)
Major Errors (higher = better)
Modify Models (higher = better)
Novices Experts
n = 42
Fig. 11.Quality of Models
Group Score (Median) Novices 20.5 out of 25 Experts 21.5 out of 25
Table 5.Comprehension Questionnaire the sample against the ones of a theoretical distribution (i.e., normal distribu- tion). The second graph presents a histogram of probability densities including the normal distribution (i.e., blue) and density curve (i.e., red line).
Considering the presented results, several statistical methods are used to test the hypotheses described in Section 3.1 (with p-value≤α(0.05)). For normally distributed datasets,t-Tests are applied. Non-normally distributed datasets are tested with One-Tailed Wilcoxon(-Mann-Whitney) Tests [23]. When applying the tests,Ha showed significant results (p-value = 0.046). The other tests, how- ever, show non-significant results (with p-value> 0.05) and the corresponding null hypotheses are accepted. Besides the hypothesis that novices are signifi- cantly slower in solving more advanced tasks, all other alternative hypotheses have to be rejected. In particular, the one stating that experts are faster than novices (i.e., hypothesisHe1) cannot be confirmed. Considering the errors in the context of Task 1, however, novices make more errors. This may be explained by the fact that subjects having no prior experience in process modeling are not as conscientious as subjects with more experience. Novices, in turn, possibly not focus on details needed to model data collection instruments properly. The latter may be addressed by conducting aneye-trackingexperiment with respective sub- jects. Furthermore, the assumption that experts make fewer errors than novices (i.e., hypothesisHf1) cannot be confirmed. Although there is a difference in the descriptive statistics in Task 1, the difference does not attain statistical signifi- cance. In summary, results indicate that the prior experience of a subject does not affect the modeling of data collection instruments. In particular, the exper- iment shows that users without prior experience may gain sufficient knowledge within approximately 60 minutes (total time of the experiment) to model data collection applications themselves. Moreover, the learning effect between the first and second task have to be addressed more specifically in a future experiment.
●
●
● ●
●
●
●
●
●
●
● ●
●
●
●
●
●
●
●
●
●
●
●
●
−2 −1 0 1 2
2004006008001000
Theoretical Quantiles
Sample Quantiles
Total Time (sec)
Density
200 400 600 800 1000
0.0000.0010.0020.0030.0040.005 Normal Curve
Density Curve
Fig. 12.Distribution of Total Time for Task 1 (Novices)
To conclude, the results indicate the feasibility of the modeling concept.
Overall, 43 out of 84 created instruments have been completed with zero or only one error. Given the fact that none of the subjects had ever used the application before, this relatively low number of errors confirms that the application can be easily used by novices. Hence, the QuestionSys configurator is suited to enable domain experts create mobile data collection applications themselves.
Threats to validity.First of all,external,internal,construct andconclusion validity, as proposed in [7], were carefully considered. However, any experiment bears risks that might affect its results. Thus, its levels of validity need to be checked and limitations be discussed. The selection of involved subjects is a possible risk. First, in the experiment, solely subjects from Computer Science (34) and Business Science (8) participated. Second, 36 participants have already worked with process models. Concerning these two risks, in future experiments we will particularly involve psychologists and medical doctors (1) being experi- enced with creating paper-based questionnaires and (2) having no experiences with process modeling. Third, the categorization of the subjects to the groups of novices and experts regarding their prior experience in process modeling is a possible risk. It is debatable whether an individual, who has read more than 20 process models or created more than 10 process models within the last 12 months, can be considered as an expert. A broader distinguishing, for example, between novices, intermediates, and experts (with long-term practical experience) could be evaluated as well. The questionnaires used for the modeling task of the exper- iment constitute an additional risk. For example, if subjects feel more familiar with the underlying scenario of the questionnaire, this might positively affect the modeling of the data collection instrument. Furthermore, the given tasks might have been too simple regarding the low number of modeling errors. Hence, ad- ditional experiments should take the influence of the used questionnaires as well as their complexity into account. In addition, we address the potential learning effect when modeling data collection instruments in more detail. Finally, an-
other limitation of the present study is the relatively small sample size of N=42 participants. However, the sample is large enough to run meaningful inferential statistical tests, though their results can only be seen as preliminary with lim- ited external validity. Therefore, we will run another experiment to evaluate the configurator component with a larger and more heterogeneous sample.
5 Related Work
Several experiments measuring mental efforts in the context of process model- ing are described in literature. Common to them is their focus on the resulting process model. For example, [13] evaluates the process of modeling processes itself. Furthermore, [22] identifies a set of fixation patterns with eye tracking for acquiring a better understanding of factors that influence the way process mod- els are created by individuals. The different steps a process modeler undertakes when modeling processes are visually presented in [6]. However, in our study the process models represent data collection instruments. Therefore, additional aspects have to be modeled that are normally not important for process mod- els (e.g., different versions of elements). On the other hand, these aspects may increase overall mental efforts during modeling. Consequently, our experiment differs from the ones conducted in the discussed approaches.
Various approaches supporting non-programmers with creating software have proven their feasibility in a multitude of studies. For example, [10] provides an en- vironment allowing system administrators to visually model script applications.
An experiment revealed the applicability of the proposed approach. In turn, [3]
introduces a graphical programming language, representing each function of a computer program as a block.
Regarding the systematic evaluation of configurators that enable domain ex- perts to create flexible questionnaires on their own, only few literature exists.
For example, [1] evaluates aweb-based configurator for ambulatory assessments against movisensXS. More precisely, two studies are described. On one hand, the configurator component is assessed by two experts. On the other, 10 sub- jects evaluate the respective client component capable of enacting the configured assessment. Both studies, however, rely on standardized user-experience ques- tionnaires (e.g., System Usability Scale [4]) to obtain feedback. The results are limited due to the low number of subjects. In [18], a web-based application to create and coordinate interactive information retrieval (IIR) experiments is presented. The authors evaluate their application in two ways: First, usability analyses are performed for the application backend by a human computer in- teraction researcher and a student. Both confirm an easy-to-use user interface.
Second, the frontend is evaluated by performing an IIR experiment with 48 par- ticipants. Thereby, the time to complete tasks is measured by the application and participants are asked to provide feedback on how they rate their performance.
Though these studies focus on the usability of the developed applications, our study pursues a different approach as it evaluates the configurator by observing correctness aspects when solving specific tasks. To the best of our knowledge,
when using a configurator application for modeling data collection instruments, no similar approaches are available so far.
6 Summary and Outlook
This paper investigated the questionnaire configurator of the QuestionSys frame- work with respect to its usability. The configurator, in turn, shall enable domain experts to create mobile data collection applications on their own. To address the usability of the configurator, a controlled experiment with 44 participants was conducted. For the experiment, the participants were separated into two groups, based on their background knowledge and experience in process modeling. To evaluate differences between both groups, we focused on the total time needed to solve specific tasks as well as the number of errors in the submitted models.
We showed that user experience in process modeling has minimal effects on the overall understanding of the configurator. Furthermore, the subjects gained re- spective knowledge to use the configurator in adequate time. One could argue that a learning effect took place. However, contrary to our expectations, the study showed that there are no significant differences in working with the con- figurator regarding the experience the user has with process modeling. In order to evaluate the results with respect to domain differences, we plan a large-scale study with subjects from multiple domains. Currently, we are recruiting subjects from Psychology and Business Science. Furthermore, we address the learning ef- fect observed and, therefore, rerun respective studies multiple times with the same subjects. The results obtained in this study confirm the intuitiveness and improve the overall user-experience of the developed configurator component.
Altogether, the QuestionSys approach will significantly influence the way data is collected in large-scale studies (e.g., clinical trials).
References
1. Bachmann, A., Zetzsche, R., Schankin, A., Riedel, T., Beigl, M., Reichert, M., San- tangelo, P., Ebner-Priemer, U.: ESMAC: A Web-Based Configurator for Context- Aware Experience Sampling Apps in Ambulatory Assessment. In: 5th Int’l Conf on Wireless Mobile Communication and Healthcare. pp. 15–18 (2015)
2. Basili, V.R.: Software Modeling and Measurement: The Goal/Question/Metric Paradigm (1992)
3. Begel, A., Klopfer, E.: Starlogo TNG: An Introduction to Game Development.
Journal of E-Learning (2007)
4. Brooke, J., et al.: SUS - A quick and dirty usability scale. Usability evaluation in industry 189(194), 4–7 (1996)
5. Carlbring, P., Brunt, S., Bohman, S., Austin, D., Richards, J., ¨Ost, L.G., Anders- son, G.: Internet vs. paper and pencil administration of questionnaires commonly used in panic/agoraphobia research. Computers in Human Behavior 23(3), 1421–
1434 (2007)
6. Claes, J., Vanderfeesten, I., Pinggera, J., Reijers, H.A., Weber, B., Poels, G.: A visual analysis of the process of process modeling. Information Systems and e- Business Management 13(1), 147–190 (2015)
7. Cook, T.D., Campbell, D.T., Day, A.: Quasi-Experimentation: Design & Analysis Issues for Field Settings, vol. 351. Houghton Mifflin Boston (1979)
8. Fernandez-Ballesteros, R.: Self-report questionnaires. Comprehensive handbook of psychological assessment 3, 194–221 (2004)
9. H¨ost, M., Regnell, B., Wohlin, C.: Using Students as Subjects - A Comparative Study of Students and Professionals in Lead-Time Impact Assessment. Empirical Software Engineering 5(3), 201–214 (2000)
10. Kandogan, E., Haber, E., Barrett, R., Cypher, A., Maglio, P., Zhao, H.: A1: End- User Programming for Web-based System Administration. In: Proc. 18th ACM symposium on User interface software and technology. ACM (2005)
11. Lane, S.J., Heddle, N.M., Arnold, E., Walker, I.: A review of randomized controlled trials comparing the effectiveness of hand held computers with paper methods for data collection. BMC medical informatics and decision making 6(1), 1 (2006) 12. Marcano Belisario, J.S., Jamsek, J., Huckvale, K., O’Donoghue, J., Morrison, C.P.,
Car, J.: Comparison of self-administered survey questionnaire responses collected using mobile apps versus other methods. The Cochrane Library (2015)
13. Martini, M., Pinggera, J., Neurauter, M., Sachse, P., Furtner, M.R., Weber, B.:
The impact of working memory and the process of process modelling on model quality: Investigating experienced versus inexperienced modellers. Scientific reports 6 (2016)
14. Palermo, T.M., Valenzuela, D., Stork, P.P.: A randomized trial of electronic versus paper pain diaries in children: impact on compliance, accuracy, and acceptability.
Pain 107(3), 213–219 (2004)
15. Pavlovi´c, I., Kern, T., Miklavˇciˇc, D.: Comparison of paper-based and electronic data collection process in clinical trials: costs simulation study. Contemporary clin- ical trials 30(4), 300–316 (2009)
16. Rafique, I., Lew, P., Abbasi, M.Q., Li, Z.: Information Quality Evaluation Frame- work: Extending ISO 25012 Data Quality Model. World Academy of Science, En- gineering and Technology 65, 523–528 (2012)
17. Reichert, M., Weber, B.: Enabling Flexibility in Process-Aware Information Sys- tems: Challenges, Methods, Technologies. Springer, Berlin-Heidelberg (2012) 18. Renaud, G., Azzopardi, L.: SCAMP: A Tool for Conducting Interactive Informa-
tion Retrieval Experiments. In: IIiX. pp. 286–289 (2012)
19. Schobel, J., Pryss, R., Schickler, M., Reichert, M.: A Configurator Component for End-User Defined Mobile Data Collection Processes. In: Demo Track of the 14th Int’l Conf on Service Oriented Computing (October 2016)
20. Schobel, J., Pryss, R., Schickler, M., Reichert, M.: A Lightweight Process Engine for Enabling Advanced Mobile Applications. In: 24th Int’l Conf on Cooperative Information Systems. pp. 552–569. No. 10033 in LNCS, Springer (October 2016) 21. Schobel, J., Pryss, R., Schickler, M., Ruf-Leuschner, M., Elbert, T., Reichert, M.:
End-User Programming of Mobile Services: Empowering Domain Experts to Im- plement Mobile Data Collection Applications. In: IEEE 5th Int’l Conf on Mobile Services. IEEE Computer Society Press (June 2016)
22. Weber, B., Pinggera, J., Neurauter, M., Zugal, S., Martini, M., Furtner, M., Sachse, P., Schnitzer, D.: Fixation patterns during process model creation: Initial steps to- ward neuro-adaptive process modeling environments. In: System Sciences (HICSS), 2016 49th Hawaii International Conference on. pp. 600–609. IEEE (2016)
23. Wohlin, C., Runeson, P., H¨ost, M., Ohlsson, M.C., Regnell, B., Wessl´en, A.: Ex- perimentation in software engineering. Springer Science & Business Media (2012)