DISSERTATION
submitted to the
Combined Faculties for the
Natural Sciences and for Mathematics of the
Ruperto-Carola University of Heidelberg Germany
for the Degree of
Doctor of the Natural Sciences
presented by
Dipl.-Phys. Tobias A. Knoch
born in Mannheim
Date of oral examination: 11th July, 2002
Approaching the
Three-Dimensional Organization of the Human Genome
-
Structural-, Scaling- and Dynamic-Properties in the Simulation of
Interphase Chromosomes and Cell Nuclei Long-Range Correlations in Complete Genomes
In Vivo Analysis of the Chromatin Distribution
Construct Conversions in Simultaneous Co-Transfections
Referees: Prof. Dr. Jörg Langowski Prof. Dr. Dr. Christoph Cremer
Zusammenfassung
Um sich an die immer noch weitgehend unbekannte sequentielle und dreidimensionale Organisation des menschlichen Zellkernes anzunähren, wurden strukturelle, skalierungs und dynamische Eigenschaften von Chromosomen und Zellkernen in der Interphase auf der Ebene der 30nm Chromatinfaser mit Monte Carlo, Brownschen Dynamic und parallelen Computer Methoden simuliert. Unterschiede zwischen den benutzten Modellen erklären verschiedene experimentelle Bedingungen, die ein Multi-Loop-Subcompartment Modell mit 63-126kbp Schleifen, die zu Rosetten aggregiert und durch einen 63-126kbp Linker verbun- den sind, favorisieren. Dieses Modell sagt auch die Mobilität von Molekülen durch moderat behinderte Diffusion korrekt vorher. Korrelations Analysen von komplett sequenzierten Archaea, Bacteria und Eukarya Chromosomen zeigten fein-strukturierte positive lang- reichweitige Korrelationen aufgrund von Codon-, Nucleosomen- und Blockorganisation dieser Genome, die Klassifikation und Baumkonstruktion ermöglichen. Konstruktion und Expression von Fusionsproteinen aus den Histonen H1, H2A, H2B, H3, H4 und mH2A1.2 mit den autofluoreszenten Proteinen CFP, GFP, YFP, DsRed-1 und DsRed-2 erlaubte die Untersuchung der Chromatinstruktur in vivo während der Interphase, der Mitose oder Apoptose und zeigte verschiedene Interphase-Morphologien, quantifizierbar mit Ska- lierungsanalysen. Schließlich, wurden Konstrukt-Konversionen in simultanen Ko-Transfek- tionen basierend auf Rekombination/Reparatur/Replikation in ≤25% der Zellen entdeckt.
Abstract
To approach the still largely unknown sequential and three-dimensional organization of the human cell nucleus, the structural-, scaling- and dynamic properties of interphase chromo- somes and cell nuclei were simulated on the 30nm chromatin fiber level with Monte Carlo, Brownian Dynamics and parallel computing methods. Differences between used models explain various experimental conditions, favouring a Multi-Loop-Subcompartment model with 63-126kbp loops aggregated to rosettes and connected by 63-126kbp linkers, and pre- dict correctly the mobility of molecules by moderately obstructed diffusion excluding the Inter-Chromosomal Domain hypothesis. Correlation analyses of completely sequenced Archaea, Bacteria and Eukarya chromosomes revealed fine-structured positive long-range correlation due to codon, nucleosomal or block organization of the genomes, allowing clas- sification and tree construction. By construction and expression of fusionproteins from the histones H1, H2A, H2B, H3, H4 and mH2A1.2 with the autofluorescent proteins CFP, GFP, YFP, DsRed-1 and DsRed-2, the chromatin morphology could be investigated in vivo during interphase, mitosis or apoptosis and revealed different interphase morphologies for cell lines quantifiable by scaling analyses. Finally, construct conversions in simultaneous co- transfections due to recombination/repair/replication were discovered in ≤25% of cells.
Dr. Tobias A. Knoch Offenburgerstr. 100 D-68239 Mannheim
Germany
© Dr. Tobias A. Knoch 2002 Dissertation Edition
Dissertation Edition (soft cover, 1st edition) Special Dissertation Edition (hard cover, 2nd edition)
ISBN 3-00-009959-X (soft cover, 3rd edition) ISBN 3-00-009960-3 (hard cover, 3rd edition)
Printing: German Cancer Research Center (DKFZ), Heidelberg Binding: Dyroff, Heidelberg
Printed in Germany on Acid-Free Paper
T A
Acknowledgements
Prof. Dr. Jörg Langowski is thanked for the possibility to conduct this thesis under ideal conditions in his interdisciplinary group Biophysics of Macromolecules, Ger- man Cancer Research Center (DKFZ), Heidelberg.
Prof. Dr. Dr. Christoph Cremer is thanked for many discussions and for represent- ing this thesis at the Combined Faculty for the Natural Sciences and Mathematics of the University Ruperto-Carola, Heidelberg.
Prof. Dr. Josef Bille and Prof. Dr. Reimer Kühn are thanked for being members of the disputation jury.
Dr. Thomas Weidemann is grateful acknowledged for his supportive friendship, pluralistic debates and his constructive criticism.
Dr. Malte Wachsmuth is regarded for many ideas and discussions as well as for his great motivation and cooperation in experiments.
Dr. Markus Hammermann is not only thanked for sharing the same laboratory and many thoughts but also for his friendship and many theatre visits.
Dr. Volkmar Baumgärtner must be tributed for his critical impulses, creative dis- courses and his friendship. Thanks go also to Dipl.-Arch. Miriam Baumgärtner for her great encouragement.
Dr. Georg Eysel is recognised for his support, distraction from lab work and for organizing several flats in the end phase of this thesis.
Secretary Erica Stolte is thanked for very her friendly and happy support.
Dr. Christian Münkel is appreciated for writing parallel simulation code and initiat- ing the work leading to Chapter 2 “Simulation of Single Chromosomes”, later suc- ceeding into Chapter 3 “Simulation of Interphase Nuclei”, and Chapter 5
“Simulation of the Dynamics in Interphase Nuclei”.
Dr. Gregor Kreth should be recognized for many constructive questions and ideas.
Dipl.-Biol. Markus Göker is thanked for his friendship, many constructive ideas, his expertise and cooperation in the work of Chapter 6 “Long-Range Correlations in DNA Sequences” as well as for initiating a cooperation leading to fractal analyses of foraging trails of leaf cutting ants.
PD Dr. Rudolf Lohner is greatly appreciated for his ready enthusiasm and support with exact numerics, programming, implementation as well as job management on the IBM SP2 concerning Chapter 6 “Long-Range Correlations in DNA Sequences”.
Dr. Waldemar Waldeck is greatefully acknowledged for many fruitful scientific con- versations leading to Chapter 7 “Chromatin Alive” as well as other projects. TA Gabriela Müller is thanked for introducing me to cell culture and some molecular techniques as well as for her general technical assistance.
Dr. Katalin Fejes-Toth and PD Dr. Karsten Rippe for valuable advice and dyn-amic cooperation on chromatin regulation, related to Chapter 7 “Chromatin Alive”.
Prof. Dr. Angel Alonso is thanked for providing some of the coding sequences for the development of histone-AFP fusionproteins and many information and Prof. Dr.
Detlef Doenecke is thanked for providing plasmids encoding histones with their nat- ural promoter for the histone-AFP fusionproteins.
Dr. Michael Stoehr is not only honoured for his cooperation in fluorescence acti- vated cell sorting (FACS) measurements, cell cycle analysis and the many another help but also his original open-mindedness and instrumental conversations. Great thanks go also to TA Monika Stoehr for her technical assistance and proceeding of the cell cycle analysis as well as for her friendly motivation.
Dipl.-Ing. Andreas Hunziker is thanked for extremely well control sequencing of plasmids encoding the histone-AFP fusionproteins, for the difficult sequencing of PCR products proving the “GFP-Walking” of Chapter 7 and many a relaxing chat.
Prof. Dr. Peter Lichter is regarded for providing the confocal laser scanning micro- scope facilities used in Chapter 7 “Chromatin Alive” and helpful discussions.
Dr. Karsten Richter and Dipl.-Biol. Michaela Reichenzeller are thanked for many fruitful discussions on the three-dimensional organization of the cell nucleus and cooperative advancement of the confocal laser scanning microscope facilities.
Dipl.-Biol. Felix Bestvater has to be honoured for making the initial observation and for the excellent cooperation on the equally shared project leading to Chapter 8 “GFP-Walking” as well as for his dear friendship.
Prof. Dr. Eberhard Spiess needs not only to be regarded for his ready cooperation leading to Chapter 8 “GFP-Walking” but also for his motivation, the many discus- sions and the great support of the Diploma/PhD student initiative I worked in.
Dipl.-Chem. Nina Baudendistel is thanked for continuing the AP1-AFP project as her PhD thesis and for her great cooperation.
Dr. Karin Monier and Prof. Dr. Kevin Sullivan are thanked for many important dis- cussions and suggestions, e. g. concerning Chapter 7 “Chromatin Alive”.
Besides thanking all other members of the group Biophysics of Macromolecules, all those from the DKFZ who supported me, I would like to appreciate all of those who integrated my results and propositions into cooperative research projects: Dr. Peter Quicken, Dr. Anna Friedel and Prof. Dr. A. Kellerer integrated simulations from Chapter 1 “Simulation of Single Chromosomes” into “Simulation of Fragment Dis- tributions caused by Carbon-Ion Irradiation”. Dr. Rainer Wirth’s and Dipl.-Biol.
Christian Kost’s foraging trails of leaf-cutting ants were subject to fractal analyses.
Dr. Gabriela Westphal cooperated me into her Nerve Growth Factor (NGF) and Erythropietin and Dr. Shirley Gil Parado into her µ-calpain research counting on the histone-AFPs and in vivo confocal laser scanning microscopy.
The German Cancer Research Center (DKFZ) is thanked for providing me with a dissertation grant, besides its infrastructure especially parallel high performance computing on various IBM SP2 and HP machines. I would also like to thank the Federal Ministry of Research and Technology (BMFT) for its support under grant 01 KW 9602/2 (3D-Heidelberg Human Genome Study Group, German Human Genome Project). The High-Performance Computing Center Stuttgart (HLRS) and the Supercomputing Center (SCC) Karlsruhe guaranteeing a frictionless access to their CRAY T3E and IBM SP2s are also thanked for their many a support.
The Molecular Graphics and Modelling Society (MGMS) as well as the German Cancer Research Center (DKFZ) are thanked for honouring my interdisciplinary research approaches by awards for a talk and a poster.
Great thanks go to those who supported me in the endphase of this thesis with their constructive criticism: Dr. Malte Wachsmuth, Dr. Thomas Weidemann, Dr. Walde- mar Waldeck, Dipl.-Biol. Markus Göker, PD Dr. Rudolf Lohner, Dr. Katalin Fejes-Toth, PD Dr. Karsten Rippe and Prof. Dr. Eberhard Spiess.
Finally, I would like to thank deeply Prof. Dr. Kurt Egger and all people of the Human Ecology (HÖ) Working Group at the University of Heidelberg for their support, inspirations, insights and happy moments I was so lucky to receive.
To my parents Waltraut Knoch and Wolfgang F. Knoch, I owe a debt to great to be repaid for their constant support, encouragement and love!
Heidelberg, 15th May, 2002,
Tobias Aurelius Knoch
Contents
1 Introduction . . . 1
1.1 Intention . . . 1
1.2 The First Three Compaction Levels of the Human Genome . . . 3
1.2.1 Deoxyribonucleicacid (DNA) Structure . . . 4
1.2.2 The Nucleosome . . . 5
1.2.3 The Chromatin Fiber . . . 6
1.3 Hypotheses of the Higher-Order Chromatin Structure . . . 8
1.3.1 The Rabl and Boveri Interphase Model . . . 9
1.3.2 The Interphase Models of Comings and of Vogel & Schroeder . 10 1.3.3 Ideogram Banding and The Radial-Loop-Scaffold Metaphase Model . . . 12
1.3.4 The Pienta and Coffey Interphase-Metaphase Model . . . 13
1.3.5 The (Extended) Inter-Chromosomal Domain (ICD) Interphase Model . . . 14
1.3.6 The Chromonema Fiber Interphase Model . . . 17
1.3.7 The Random-Walk/Giant-Loop (RW/GL) Interphase Model . . . 17
1.3.8 The Multi-Loop-Subcompartment Interphase-Metaphase Model . . . 20
1.4 Questions Leading to this Thesis . . . 21
2 Simulation of Single Chromosomes . . . 23
2.1 Introduction . . . 23
2.2 Simulation Methods . . . 24
2.2.1 Chain Properties . . . 24
xiv Tobias A. Knoch Contents
2.2.2 Monte Carlo Algorithm . . . 26
2.2.3 Brownian Dynamics Algorithm . . . 28
2.2.4 Parallelization of Simulation Code . . . 29
2.3 Simulated Models and Their Properties . . . 30
2.3.1 Random-Walk/Giant-Loop (RW/GL) Model . . . 30
2.3.2 Multi-Loop-Subcompartment (MLS) Model . . . 30
2.3.3 Starting Configurations . . . 31
2.3.4 Excluded Volume and Nuclear Volume Properties . . . 32
2.4 Morphology of Simulated Chromosomes . . . 32
2.5 Radial Mass and Density Distribution of Chromosome Territories . . . . 34
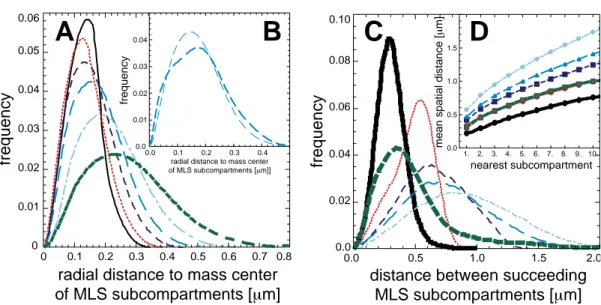
2.6 Properties of MLS - Subcompartments . . . 35
2.6.1 Radial Mass and Density Distribution . . . 35
2.6.2 Spatial Distance between Succeeding Subcompartments . . . 36
2.6.3 Spatial Distance between Nearest Subcompartments . . . 37
2.7 Spatial Distances between Genomic Markers . . . 38
2.7.1 Position Independent Spatial Distances . . . 38
2.7.2 Position Dependent Spatial Distances . . . 42
2.7.3 Dependencies of Spatial Distances in a Set of Genomic Markers . . . 44
2.8 Excluded Volume and Embedding Nuclear Volume Dependencies . . . 44
2.9 Comparison between Simulated and Experimental Spatial Distances . . 47
2.9.1 General Properties of Methods Used in Different Studies . . . 47
2.9.2 Comparison of Simulated Position Independent Spatial Distances to Experiments . . . 51
2.10 Discussion of the Simulation of Single Chromosomes . . . 54
3 Simulation of Interphase Nuclei . . . 59
3.1 Introduction . . . 59
3.2 Starting Configuration, Decondensation into Interphase and Properties of Simulated Models . . . 60
3.2.1 Metaphase Starting Configurations and Simulated Annealing . . 60
3.2.2 Decondensation from Metaphase into Interphase . . . 61
3.2.3 Multi-Loop-Subcompartment (MLS) Model . . . 62
3.2.4 Random-Walk/Giant-Loop (RW/GL) Model . . . 64
3.2.5 Excluded Volume and Nuclear Volume Properties . . . 64
xv
3.3 Morphology and General Properties of Simulated Nuclei . . . 65
3.3.1 Rendering and Simulation of EM and CLSM Images . . . 65
3.3.2 Morphology of Simulated Nuclei . . . 66
3.3.3 Radial Mass Distribution of Nuclei . . . 68
3.3.4 Intensity and Mass Distribution in CLSM-Stacks of Nuclei . . . . 70
3.4 Properties of Chromosome Territories . . . 72
3.4.1 Radial Mass and Density Distribution of Territories . . . 72
3.4.2 Roundness of Territories . . . 74
3.4.3 Spatial Distance between Arbitrary and Nearest Chromosome Territories . . . 74
3.4.4 “Volume” and Overlap of Territories Based on CLSM Images . . . 76
3.5 Properties of MLS - Subcompartments . . . 78
3.5.1 Radial Mass Distribution of Subcompartments . . . 78
3.5.2 Spatial D istance between Succeeding Subcompartments . . . 79
3.5.3 Spatial Distance between Arbitrary and Nearest Subcompartments . . . 81
3.5.4 “Volume” and Overlap of Subcompartments Based on CLSM Images . . . 82
3.6 Position Independent Spatial Distances between Genomic Markers . . . . 82
3.7 Discussion of the Simulation of Interphase Nuclei . . . 84
4 Scaling Properties of the Nuclear Organization . . . 89
4.1 Introduction . . . 89
4.2 Scaling Analyses Methods . . . 90
4.2.1 Exact Spatial-Distance and Exact Yard-Stick Dimension . . . 90
4.2.2 Weighted Box-Counting and Lacunarity Dimension . . . 92
4.2.3 Calculation of the Scaling Exponents/Dimensions . . . 94
4.2.4 Weighted Local Dimension, Diffuseness, Skewness and Kurtosis . . . 94
4.3 Scaling Behaviour of the 30nm Chromatin Fiber . . . 96
4.3.1 Appearance of Scaling . . . 96
4.3.2 Multi-Scaling and Fine-Structured Multi-Scaling . . . 97
4.4 Scaling of Simulated Confocal Images of Nuclei . . . 100
4.4.1 Weighted Box-Counting and Weighted Lacunarity Dimension . . . 100
4.4.2 Weighted Local Mass Dimension . . . 104
xvi Tobias A. Knoch Contents
4.4.3 Weighted Local Diffuseness . . . 104
4.4.4 Weighted Local Skewness and Weighted Local Kurtosis . . . . 105
4.5 Scaling of the Nuclear Membrane . . . 105
4.6 Discussion of Scaling Properties of the Nuclear Higher Order Structure . . . 106
5 Simulation of the Dynamics in Interphase Nuclei . . . 111
5.1 Introduction . . . 111
5.2 Simulation Methods . . . 112
5.2.1 Analytical Description of Obstructed Diffusion . . . 112
5.2.2 Simulation Method . . . 114
5.3 Morphologic Volume and Diffusion Relationships . . . 114
5.3.1 Volume Fraction of the Chromatin Fiber in Cell Nuclei . . . 116
5.3.2 Approximation of the Mean Isotropic Mesh Spacing . . . 118
5.4 Particle Diffusion in a Static Nuclear Chromatin Mesh . . . 119
5.5 Discussion of the Simulation of Dynamics of Interphase Nuclei . . . 120
6 Long-Range Correlations in DNA Sequences . . . 123
6.1 Introduction . . . 123
6.2 Correlation Analysis, Random Sequence Design and Tree Construction . . . 124
6.2.1 Correlation Analysis of DNA Sequences and Genomes . . . 124
6.2.2 Design of Arteficial Random DNA Sequences/Genomes . . . . 125
6.2.3 Correlation Based Tree Construction and Classification of Genomes . . . 128
6.3 Appearance of Long-Range Correlations . . . 129
6.4 Multi-Scaling of Long-Range Correlations . . . 131
6.4.1 General Behaviour of the Multi-Scaling in Eukarya . . . 133
6.4.2 General Behaviour of the Multi-Scaling in Archaea and Bacteria . . . 138
6.4.3 Origin and Interpretation of Multi-Scaling . . . 139
6.5 Fine Structure of Long-Range Correlations . . . 144
6.5.1 Codon Usage Associated Fine Structure . . . 144
xvii
6.5.2 Nucleosomal Binding Associated Fine Structure . . . 146
6.6 Classification of Correlations by Tree Construction . . . 148
6.6.1 Tree Construction of b-Tubulin Genes of Oomycetes . . . 148
6.6.2 Tree Construction of Eukarya, Archaea and Bacteria Genomes . . . 150
6.7 Discussion of Long Range Correlations in DNA Sequences . . . 153
7 “Chromatin Alive“: In vivo Analysis of the Chromatin Distribution in Cell Nuclei . . . 159
7.1 Introduction . . . 159
7.2 Vector Construction, Cell Culture and Microscopy . . . 160
7.2.1 Vectors . . . 160
7.2.2 Transfection in Eucariotic Cells and Cell Culture . . . 163
7.2.3 Proliferation and Cell Cycle Analysis of Cell Clones . . . 165
7.2.4 Fluorescence Properties of Cell Clones . . . 167
7.2.5 Confocal Laser Scanning Microscopy . . . 169
7.3 Quantitative Analysis Methods . . . 171
7.3.1 Nuclear Volume and Surface Segmentation, and Nuclear Roundness . . . 172
7.3.2 (Absolute) Intensity and Nucleosome Distribution of Nuclei . . 172
7.4 In vivo Properties of Histone-AFP Expressing Cell Lines . . . 173
7.5 Qualitative Chromatin Morphology of Cell Nuclei in vivo . . . 177
7.5.1 Interphase . . . 178
7.5.2 Mitosis . . . 182
7.5.3 Apoptosis . . . 183
7.6 Quantitative Chromatin Morphology of Cell Nuclei in vivo . . . 183
7.7 Discussion of “Chromatin Alive“ and Future Aspects . . . 184
7.7.1 In vivo Method for Co-Localization and Dynamics . . . 186
7.7.2 Improvement of Apoptosis Analysis . . . 188
7.7.3 Specific Labeling and Specific Isolation of Histones . . . 188
7.7.4 In Organo and In Organismo Labelling of Chromatin . . . 189
xviii Tobias A. Knoch Contents
8 “GFP-Walking”: Artificial Construct Conversions
Caused by Simultaneous Co-Transfection . . . 191
8.1 Introduction . . . 191
8.2 Material and Methods . . . 192
8.2.1 Cell Culture . . . 192
8.2.2 Vectors . . . 192
8.2.3 Transfection Procedures . . . 193
8.2.4 Determination of Converted Sequences . . . 194
8.2.5 Fluorescence Microscopy . . . 196
8.3 Qualitative Description and Proof of Conversion . . . 196
8.3.1 Observation of the Conversion Effect . . . 196
8.3.2 Variation of Protocols and Generality of Conversion . . . 197
8.4 Proof of Conversion by DNA Sequence Analysis . . . 200
8.5 Quantification of the Conversion Rates . . . 200
8.5.1 Space and Intensity Resolved Planeometric Microscopy (SIRPM) . . . 200
8.5.2 Detailed Quantification of the Conversion Rates . . . 202
8.6 Discussion of “GFP-Walking“ and Future Aspects . . . 202
8.6.1 In vivo and in vitro Method for the Integral Investigation of RRR Processes . . . 205
8.6.2 An Optimized Plasmid for FACS Analysis . . . 206
8.6.3 In vivo and in vitro Method for the Creation of DNA Constructs . . . 206
9 Summary and Synthesis . . . 209
9.1 Summary . . . 209
9.2 Synthesis . . . 214
Grants and Prizes . . . 217
Grants . . . 217
Prizes . . . 217
xix
Patents and Publications Related to this Thesis . . . 219
Patents . . . 219
Publications . . . 219
Literature . . . 223
List of Figures
1 Introduction . . . 1
1.1 Approaching the Three-Dimensional Organization of the Human Genome . . . 1
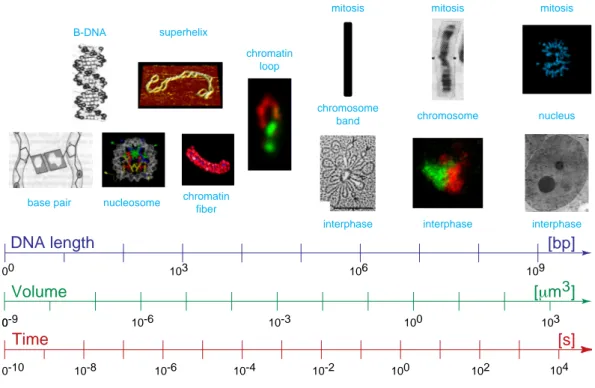
1.2 Overview on the Size and Time Scaling of the Human Genome Organization . . . 3
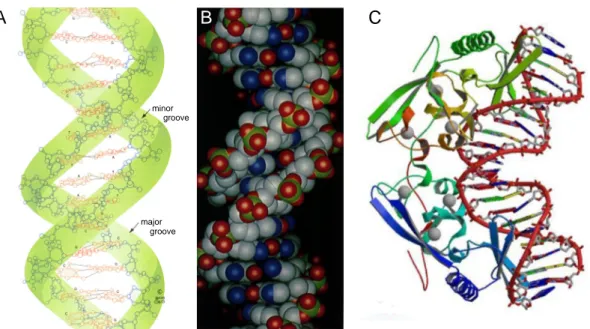
1.3 DNA Double Helix Structure and Protein Binding to DNA . . . 5
1.4 Structure of the Nucleosome . . . 7
1.5 Structure and Loops of the 30nm Chromatin Fiber . . . 8
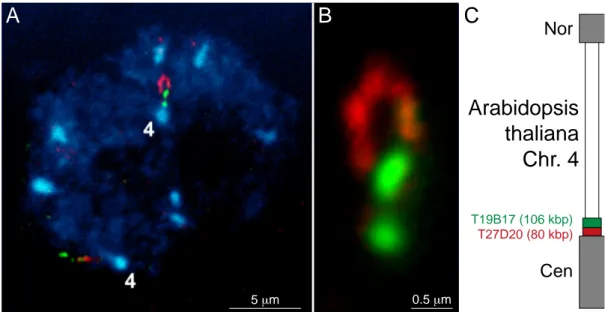
1.6 Loop Structures in the Arabidopsis thaliana Genome visualized by FISH . . . 9
1.7 Folding of the Chromatin Loops into Rosettes/Chromomeres in EM Images . . . 10
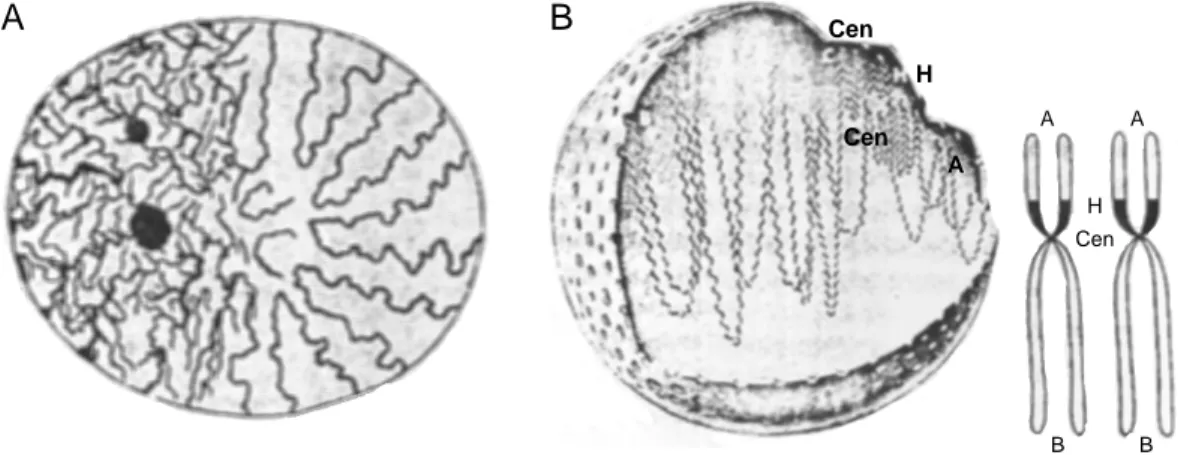
1.8 Model of Rabl and Boveri, and Model of Comings . . . 13
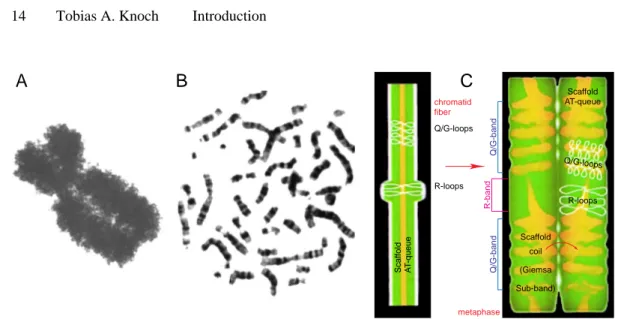
1.9 Ideogram Banding and the Radial-Loop-Scaffold Model of Metaphase Chromosomes . . . 14
1.10 Ideogram Banding and Data of the Human Genome . . . 15
1.11 The Pienta and Coffey as well as the Chromonema Fiber Model of Chromosomes . . . 16
1.12 FISH of Chromosomes, Chromosome Arms, Subcompartments and Genetic Markers . . . 18
1.13 The Inter-Chromosomal Domain (ICD) Model of Interphase Nuclei . . . 19
1.14 Random-Walk/Giant-Loop (RW/GL) and Multi-Loop-Subcompartment (MLS) Model . . . 20
xxii Tobias A. Knoch List of Figures
2 Simulation of Single Chromosomes . . . 23
2.1 Volume Rendered Images of Simulated Chromosome Models for Chromosome XV . . . 23 2.2 Monte Carlo Moves on Various Length Scales . . . 27 2.3 Structure of the Simulation Programmes and Dynamic Load Balancing . . . 31 2.4 Radial Density and Radial Mass Distribution of Chromosomes . . . 35 2.5 Radial Mass Distribution and Succeeding/Nearest Distance of
Subcompartments . . . 37 2.6 Measuring Procedures for Spatial Distances and Error in Epifluorescence Microscopy . . . 39 2.7 Simulated Position Independent Spatial Distances Compared to Experiment - I . . . 40 2.8 Simulated Position Independent Spatial Distances Compared to Experiment - II . . . 42 2.9 Position Independent Spatial Distances as Function of the Loop Size . . 45 2.10 Position Dependent versus Position Independent Spatial Distances . . . . 47 2.11 Spatial Distances in an Ensemble of Genetic Markers . . . 49
3 Simulation of Interphase Nuclei . . . 59
3.1 Startconfigurations and Decondensation into Interphase of Simulated Cell Nuclei . . . 59 3.2 Morphology of Cell Nuclei by Rendering, EM Images and
CLSM Images . . . 68 3.3 Radial Mass and Radial Density Distribution of Nuclei and Chromosome Location . . . 71 3.4 Absolute Intensity and Mass Distributions of 3D-CLSM Image Stacks . . . 73 3.5 Properties of Chromosome Territories in Cell Nuclei . . . 75 3.6 Volume and Overlap of Chromosome Territories . . . 77 3.7 Properties of MLS Subcompartments in Cell Nuclei . . . 80 3.8 Volume and Overlap of MLS Subcompartments . . . 83 3.9 Position Independent Spatial Distances between Genomic Markers in Cell Nuclei . . . 85
xxiii
4 Scaling Properties of the Nuclear Organization . . . 89
4.1 Multi-Scaling Morphology of Simulated Electron Microscopic Images . . . 89 4.2 Analyses used for the Scaling Analyses . . . 91 4.3 Spatial-Distance and Yard-Stick Dimensions of Simulated Single Chromosomes . . . 93 4.4 Spatial-Distance and Yard-Stick Dimensions of Simulated Nuclei . . . . 95 4.5 Weighted Box-Counting Dimension of Simulated Nuclear CLSM Image Stacks . . . 98 4.6 Morphology-I of Weighted Local Mass Dimension, Diffuseness, Skewness and Kurtosis . . . 100 4.7 Morphology-II of Weighted Local Mass Dimension, Diffuseness, Skewness and Kurtosis . . . 102 4.8 Weighted Local Dimension, Diffuseness, Skewness and Kurtosis . . . . 106 4.9 Nuclear Membrane/Surface Dimension of Simulated Nuclei . . . 108
5 Simulation of the Dynamics in Interphase Nuclei . . . 111
5.1 Morphology of Obstructed Dynamics and Diffusion in the Organization of Nuclei . . . 111 5.2 Excluded Volume Potential and Forces . . . 113 5.3 Visualization of the Volume Relationships in Rendered Nuclei . . . 115 5.4 Mean Square Displacement of Spheres in a Static Nuclear Chromatin Mesh . . . 117 5.5 Obstructed Diffusion Coefficient of Spheres in a Static Nuclear Chromatin Mesh . . . 119
6 Long-Range Correlations in DNA Sequences . . . 123
6.1 Correlations in a Piece of Sequence from Homo sapiens Chromosome XXI . . . 123 6.2 Introduction to the Correlation Function and Correlation Coefficient . . . 127 6.3 Correlations in Chromosomes of Homo sapiens and their Fine Structural Features . . . 132 6.4 Correlations in Chromosomes of Drosophila melangoster . . . 133 6.5 Correlations in the Saccharomyces cerevisae and
Schizosaccharomyces pombe Genomes . . . 134
xxiv Tobias A. Knoch List of Figures
6.6 Correlations in Chromosomes of Arabidopsis thaliana . . . 135 6.7 Correlations in Archaea and Bacteria Genomes and their Classification . . . 140, 141 6.8 Simulation of the Block Structure of Genomes . . . 143 6.9 Appearance and Simulation of the Codon Usage . . . 145 6.10 Simulation of the Fine Feature attributable to the Nucleosome . . . 147 6.11 Correlation Analysis of β-Tubulin Genes . . . 149 6.12 Comparison of Trees based on Phylogeny and for β-Tubulin Genes . 151 6.13 UPGMA Tree of Eukarya Chromosomes using . . . 152 6.14 Comparison of Trees based on Phylogeny and for Archaea . . . 153 6.15 Classification Tree of the Correlation Coefficient for Archaea and Bacteria . . . 154 6.16 Comparison of Means of Correlation Coefficients for all Analysed Genomes . . . 155
7 “Chromatin Alive“: In vivo Analysis of the Chromatin Distribution in Cell Nuclei . . . 159
7.1 Interphase Morphology of Various Histone-AFP Constructs in Different Cell Lines . . . 159 7.2 Structure Proposal for a Nucleosome Containing a Histone-AFP Fusionprotein . . . 161 7.3 Basic Maps of Constructed Histone-AFP Plasmids . . . 163 7.4 Control Gel of Successful Histone-AFP Vector Construction after Ligation . . . 165 7.5 Proliferation of Histone-YFP Expressing Cell Lines . . . 166 7.6 Cell Cycle Analysis of Histone-YFP Expressing Cell Lines . . . 167 7.7 Spectral Properties of YFPs in Histone-YFP Expressing Cell Lines . . 168 7.8 Fluorescence Intensity Distribution of Histone-AFP expressing Cell Lines . . . 169 7.9 Confocal Laser Scanning Microscope, Incubator and Measuring Chamber Set-Ups . . . 171 7.10 Stages of Mitosis . . . 173 7.11 Time Course of a Mitosis . . . 175 7.12 Stages of Apoptosis induced by Sodiumbutyrate . . . 176 7.13 Structural Chromatin Changes Induced by the
Deacetylase Inhibitor Trichostatin-A (TSA) . . . 177 7.14 Time Course of Apoptosis Induced by Deoxyglucose . . . 178 7.15 Volume and Surface Distributions of H2A-YFP Expressing Cell Lines . . . 185 7.16 Colocalization of Human Vimentin hV-CFP against Chromatin H2A-YFP . . . 187
xxv
8 “GFP-Walking”: Artificial Construct Conversions
Caused by Simultaneous Co-Transfection . . . 191
8.1 Fluorescence Exchange by Simultaneous Cotransfection . . . 191 8.2 Complexity of Possible False Positive Phenotypes . . . 192 8.3 Sequence Comparison of pSV–H2A–eCFP and
pcDNA3–CATB–eYFP . . . 193 8.4 Gel Separation of the PCR Amplification of H2A-YFP from
Three Converted Clones . . . 194 8.5 Sequencing Results Proving Conversion . . . 194 8.6 Imaging procedure . . . 197 8.7 Image Analysis - Background Subtraction . . . 198 8.8 Separation of the H2A from the CATB Signals and Analysis of Signals . . . 199 8.9 Quantification of the Total Conversion Rate and Typical Signal Analysis Plot of a Standard Cotransfection Experiment . . . 201 8.10 Test Plasmid for Conversion Optimized for FACS Usage . . . 205
9 Summary and Synthesis . . . 209
9.1 Rendered Image of Nucleus . . . 209
Grants and Prizes . . . 217
Poster 1 Student Travel Award Winning Poster, DKFZ, 1999. . . . 217
Patents and Publications Related to this Thesis . . . 219
Poster 2 Poster Shown on Various Conferences 1998. . . . 219
Literature . . . 223
Poster 3 Poster together with Malte Wachsmuth, 2001. . . . 223
List of Tables
1 Introduction 1
2 Simulation of Single Chromosomes . . . 23
2.1 Simulated Chromosome Models with their Physical Properties . . . 33 2.2 Properties of Experimental Spatial Distance Measurements . . . 54, 55
3 Simulation of Interphase Nuclei . . . 59
3.1 Simulated Nuclei and Physical Properties of the Used MLS Chromosome Model . . . 63 3.2 Simulated Nuclei and Physical Properties of the Used RW/GL Chromosome Model . . . 65
4
5 Simulation of the Dynamics in Interphase Nuclei . . . 111
5.1 General Volume, Concentration and Spacing Properties of Nuclei . . . 116
6 Long-Range Correlations in DNA Sequences . . . 123
6.1 Attributes and Correlation Properties of Analysed Eukarya Genomes . . . 130, 131 6.2 Attributes and Correlation Properties of Analysed Archaea (A) and Bacteria (B) Genomes . . . 136 - 138 6.3 Attributes and Correlation Properties of Analysed ß-Tubulin Genes . . 150
xxviii Tobias A. Knoch List of Tables
7 “Chromatin Alive“: In vivo Analysis of the Chromatin Distribution in Cell Nuclei . . . 159
7.1 Constructed Histone-AFP Plasmids and their Properties . . . 162 7.2 Primers used for Plasmid Construction . . . 164 7.3 Properties of Clones Expressing Histone-XFP Fusionproteins . . . 170
8 “GFP-Walking”: Artificial Construct Conversions
Caused by Simultaneous Co-Transfection . . . 191
8.1 Quantification of the Conversion Rate for Different Experimental Conditions . . . 203
9 Summary and Synthesis . . . 209
9.1 Comparison between Simulated and Experimental Chromosome Parameters . . . 212, 213
Apoptosis by Proteases
Chromatin Colocalization Vimentin a. o.
Chromatin Structure &
Apoptosis by Acetylation Patterns
Foraging Leaf-Cutting
Ants Chromatin
Colocalization Proteases
Simulation Carbon-Ion Irradiation
Chromatin Finestructure
by FISH FCS
Chromatin Structure
FCS Diffussion Particles versus
Chromatin Chromosome
& Finestructure by FISH
Sequence Correlations
Phylogenetic Relationship
(Fine-) Structural Features
RNA/DNA Construct Creation
Investigation RRR-Processes
SIRP Microscopy Detailed
Folding Morphology
CLSM/EM Morphology
Static Particle Diffusion
Spatial Distances between Genetic Markers
Radial Mass Density Distribution
Chromosomes Subcompartments
Spatial-Distance/
Exact Yard-Stick Dimension Box/Lacunarity/Local
Dimension
Extensive Comparison Spatial Distances Simulation-Experiments
Phylogenetic Relationship In Vivo
Simulation Simulation
Simulation Simulation
Artificial
DNA
?
Single Chromosomes
Interphase Nuclei
Nuclear Dynamics Scaling
Chromatin Labelling
Construct Conversions
Sequence Correlations Properties
1 Introduction
1.1 Intention
In human cells the genetic information controlling most processes from the cellular level, over embryogeneses to cognitive ability, manifests in a diploid set of 23 DNA molecules, the chromosomes. They consist of ~7x10⁹base pairs (bp) storing around 1.4x10¹⁰Bit or 1.75GByte. This whole genome, whose added molecular length totals ~2m, is kept in comparably small cell nuclei with typical diameters of ~10µm or volumes of 500µm3. This corresponds to a compaction factor of ~2x10⁵. Conse- quently, beyond pure compaction, the structuring of the genetic information in sev- eral organizational levels seems obvious to allow on the one hand sufficient performance during information transcription in interphase and on the other hand replication of the information and segregation of the chromosomes into the daughter cells in metaphase. Additionally, the abundant mutations need to be continuously found, controled and repaired to avoid the inevitable course of entropy. Considering the huge length and time scales, which bridge 10-9 to 10-5m and 10-10 to 104s, the genetic information of the human genome involves seven organizational levels according to current believe (Fig. 1.2, 1.2, 1.3): the DNA double helix (i) winds around a protein complex forming the nucleosome (ii), which condenses irregularly to the 30nm chromatin fiber (iii), which is folded into chromatin loops (iv), which aggregate to chromosomal subdomains (v), which constitute a chromosome (vi), being nonrandomly arranged in the nucleus (vii). The DNA double helix (1.2.1) and the nucleosome (1.2.2) structure are known to atomic precision, but already the detailed nucleosome conformation in the 30nm chromatin fiber is still debated
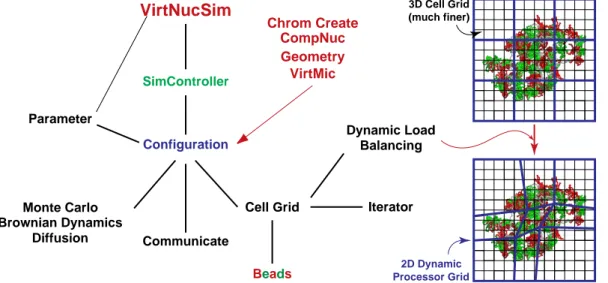
Fig. 1.1 Approaching the Three-Dimensional Organization of the Human Genome
To approach the three-dimensional organization of the human genome holisticly from different aspects covering its entire length and time scale, the structural-, scaling- and dynamic properties in the simulation of interphase chromosome and cell nuclei were analysed, long-range correlations in complete genomes were investigated, a method for the in vivo quantification of the chromatin distri- bution was developed and construct conversions in simultaneous co-transfections were discovered (thesis chapters are red and connected green). (Image: V. Hennings in Wolffe, 1993.)
2 Tobias A. Knoch Introduction
(1.2.3). The latter holds even more for the higher-order structures having born many a hypothesis: Whereas light microscopic studies by Rabl and Boveri proposed terri- torial chromosomes with a hierarchical, self-similar organization of chromatin fibers in the late 19th century (1.3.1), electron microscopy suggested thereafter a random interphase chromatin organization in the models of Comings and of Vogel &
Schroeder (1.3.2). To explain the high condensation degree of metaphase chromo- somes and their stainable ideogram bands, chromatin loops attached to a nuclear matrix scaffold were suggested in the Radial-Loop-Scaffold model by Paulson &
Laemmli (1.3.3). According to Pienta & Coffey these loops persisted in interphase forming stacked rosettes in metaphase (1.3.4). Microirradiation and fluorescence in situ hybridization (FISH) finally proved a territorial organization of chromosomes, of their arms, and of subchromosomal domains and led to the Inter-Chromosomal Domain (ICD) model hypothesizing an interchromosomal channel network (1.3.5).
For the intraterritorial chromatin folding, the chromonema fiber (CF) model by Bruce & Belmont postulated a helix hierarchy (1.3.6), whereas in the Random- Walk/Giant-Loop (RW/GL) model 1 to 5Mbp loops are attached to a non-protein backbone (1.3.7) and in the Multi-Loop-Subcompartment (MLS) model 60 to 120kbp loops form rosettes connected by similar linker (1.3.8).
The intention of this thesis was to approach the debated sequential and three- dimensional organization of the human genome integrating aspects from all nuclear scales (Fig. 1.1). Therefore, different RW/GL and MLS topologies of single chro- mosomes were simulated on the level of the 30nm chromatin fiber, to determine whether chromosome territories form, whether different morphologies appear, and whether these models can be distinguished experimentally (Chapter 2). The simula- tions were extended to whole nuclei containing all 46 chromosomes, to confirm the results of Chapter 2, to investigate the nuclear arrangement of chromosomes and the hypothesis of the ICD model (Chapter 3). Since from the above simulated chromatin fiber topologies to simulated confocal images of whole nuclei four closely con- nected compaction levels are bridged, their scaling behaviour was determined (Chapter 4). To explore the influence of the three-dimensional organization on the mobility of particles, their diffusion was simulated within nuclei, and their obstruc- tion and accessibility to nuclear loci compared to the ICD predictions (Chapter 5).
The coevolutive relation between the sequential and the three-dimensional genome organization was approached by analyzing the sequential correlation properties of completely sequenced Archaea, Bacteria and Eukarya genomes, including their multi-scaling, fine-structure and species specifity (Chapter 6). To overcome the lim- itations for the in vivo investigation of the morphology and dynamics of chromatin, a novel technique by labelling chromatin through expression of histone-autofluores- cent fusionproteins was established and the interphase morphology and the course of mitosis and apoptosis were investigated (Chapter 7). This now widely used stand- ard technique led to the discovery of construct conversions in simultaneous co-trans- fections, the clarification of their origin and appearance.
The First Three Compaction Levels of the Human Genome 3
1.2 The First Three Compaction Levels of the Human Genome
The first three compaction levels are the evolutionary oldest. The initial storage of the genetic information, the DNA double helix, is even common to all three regia, the Archaea, the Bacteria and the Eukarya. Already histones and nucleosomes are only common to a few Bacteria presumably to their coevolution with Eukarya where nucleosomes are a common feature. Whether the pure formation of nucleosomes is directly connected with the condensation into the 30nm chromatin fiber remains evolutionary unclear. Considering the huge length and times scales covered by the
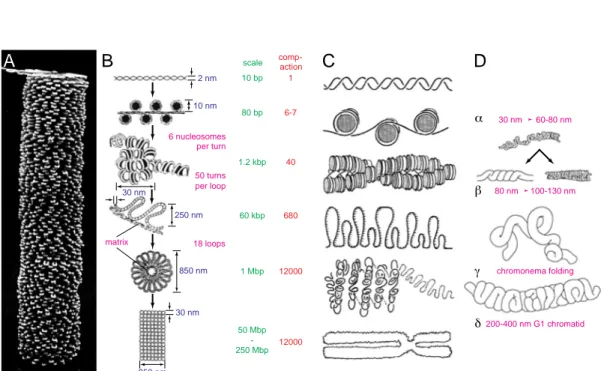
Fig. 1.2 Overview on the Size and Time Scaling of the Human Genome Organization
The scaling and the levels of organization range over 9 decades for base pairs, 12 decades for the vol- ume (≈4 length decades) and 14 decades for the time: At the initial stage base pairs are formed com- posing the DNA double helix (Voet & Voet, 1995) which winds around the histone core complex building the nucleosome (Fig. 1.4), which condense into the 30nm chromatin fiber (simulation image with courtesy of G. Wedemann, Division Biophysics of Macromolecules, German Cancer Research Center (DKFZ), Heidelberg, Germany). The DNA double helix forms also superhelices (scanning force microscopic plasmid image with courtesy of K. Rippe, Division Biophysics of Macromole- cules, German Cancer Research Center (DKFZ), current: Division Physics of Molecular Processes, Kirchhof Institute for Physics, University of Heidelberg, Germany). The next compaction step con- sists of chromatin loops (Fig. 1.5) possibly forming rosettes (Fig. 1.6), which make up interphase chromosome arms and territories (Fig. 1.12) and the metaphase ideogram bands (Fig. 1.9). 46 chro- mosomes compose the human nucleus and are decondensed in interphase (Fig. 1.13) and condensed as shown for separated metaphase plates (Fig. 7.10). This thesis involves all length and time scales.
10-10 102
[s]
10-8 10-6 10-4 10-2 100
10-9 103
[µm ]3
10-6 10-3 100
10
Time
100 103 106 109
DNA length [bp]
Volume
104 nucleus mitosis
chromosome band
interphase mitosis
chromosome
interphase mitosis
interphase chromatin
loop
base pair
B-DNA superhelix
nucleosome chromatin fiber
4 Tobias A. Knoch Introduction
whole genome, the genetic information is stored in the DNA double helix in the most direct manner compared to the higher compaction levels.
1.2.1 Deoxyribonucleicacid (DNA) Structure
Deoxyribonucleicacid (DNA) was isolated from pus cell nuclei and fish sperm by Miescher in 1869 shortly after he isolated chromatin in 1868. Although DNA was already suspected to be the carrier of the genetic information, this assumption seemed impossible regarding the variety of species and their complexity. This hypothesis remained unproven until transformation experiments on a strain of Pneu- moccocus bacteria by O. T. Avery, C. M. MacLeod and M. McCarty in 1944, except for the much earlier chemical characterization: DNA, the presumably longest fibrous macromolecule, is a polymer consisting of four nucleotides (Fig. 1.3A), consisting of a ß-D-2´-Deoxyribose a phosphat group and one of four heterocyclic bases, the purines Adenin (A) and Guanin (G), as well as the pyrimidines Thymin (T) and Cytosin (C). These monomers are coupled to an unbranched single strand through a phosphat-sugar backbone. Consequently, the sequence of nucleotides with different bases primarily code for the genetic information, in contrast to the Deox- yribose and the Phosphat group being of structural importance.
The three-dimensional structure of DNA was discovered by J. D. Watson, F. H.
C. Crick, L. C. Pauling and R. E. Franklin by X-ray diffraction in 1953: Two DNA single strands with antiparallel sense of direction, pair to a right handed double helix (Fig. 1.3A&B). Between Adenin and Thymin two and between Guanin and Cytosin three hydrogen bonds are formed. The bases are directed to the interior of the double helix and the sugar-phosphate backbone are directed to the exterior. The double helix forms only between complementary bases and complementary single strands.
This, together with the higher elasticity module, ~50nm persistence length, and higher structural stability, is of fundamental importance for transcription, replication and repair and in consequence the use and evolutionary stability of the genetic infor- mation. In organisms, the so called DNA double helix is covered by a hydrate hull, has a diameter of ~2.4nm, 10.4 base pairs per helical turn and 3.4nm of helical pitch. Due to the antiparallel sense of the single strand pairing, the glycosidic base binding to the Deoxyribose does not lay directly across, thus a minor and major groove forms whose deepness depend on the base pair tilts and turns against neigh- bouring bases and the helical diameter. Different base pair sequences lead not only to regions with different stability due to the hydrogen bonding, but also to curvature due to summation of different tilts and turns (Fig. 1.3C), besides the sequence motives for genes, their regulation as well as other patterns on various scales (1.3.3, Chapter 6, Lewin, 2000). Consequently, the sequence shapes the three-dimensional structure of the double helix, which is important for general protein binding, nucleo- some formation and positioning as well as other structural and regulatory functions.
The First Three Compaction Levels of the Human Genome 5
1.2.2 The Nucleosome
The existence of the nucleosome as the primary level of DNA compaction was first suggested by microccocal DNAase digestion experiments of nuclear chromatin iso- lations, leading to DNA fragments with a minimal size ~146bp. Therefore, the DNA must have been protected sterically from further digestion in contrast to pure iso- lated DNA (Clark & Felsenfeld, 1971). The existence of nucleosomes was con- firmed by electron microscopy manifesting a protein complex associated to the DNA like perls on a string (Kornberg, 1973; Olins & Olins, 1974). However, only recently the three-dimensional structure of the whole nucleosome was resolved in detail by X-ray diffraction on crystalized nucleosomes (Fig. 1.4, Luger et al., 1997).
In the cylindrical nucleosome with 5.5nm height and 11nm diameter, ~146bp of DNA are wound in 1.75 turns and around a protein octamer core consisting of two times the histones H2A, H2B, H3, and H4. Additionally, one histone H1 or H5 is involved in the entry and exit of the DNA to the nucleosome. Specie-depending, two nucleosomes are connected by a ~50 to 110bp linker, thus defining a repeat length of nucleosomes of 196 to 256bp on the DNA double helix. The histone protein sequences and structures belong to the best evolutionary conserved and consist of two smaller α-helices flanking a central one in the middle part. Spatially, two H2A-
Fig. 1.3 DNA Double Helix Structure and Protein Binding to DNA
In the DNA double helix the bases of a two antiparallel and complementary DNA single strands cou- pled between the bases Adenin and Thymin by two and between the bases Guanin and Cytosin by three hydrogen bonds shown for the palindromic sequence GGTATACC (A: structural description; B:
callot description; images: Voet & Voet, 1995). Due to the spatial arrangement of bases a minor and major grove form in the double helix. Since the relative position of bases relative to each other varies according to the DNA sequence, the double helix could also be curved being of regulatory impact or lead to improved binding for proteins which could also bent DNA for regulatory purposes and vice versa (C: Binding of the intron-encoded homing endonuclease I-PpoI to DNA; Flick et al., 1998).
A B C
minor
major groove
groove
6 Tobias A. Knoch Introduction
H2B heterodimers and one H3-H4 tetramer are clamped together with an antiparal- lel histone orientation and form the nucleosome core. The DNA double helix is attached by the polarity of the flanking α-helices and defined hydrogen bonds to the DNA phosphate backbone, by structural clamping of Arginins into the minor groove of the double helix, and a variety of non-polar interactions with the Deoxyriboses as well as further hydrogen and salt junctions. The binding probabilities and forces are not only directly connected to the three-dimensional structure of the DNA double helix, but also to the base pair sequence, thus specific nucleosomal binding sequences exist (Ambrose et al., 1990; Blank & Becker, 1996; Liu & Stein, 1997;
Lowary & Widom, 1998; Baily et al., 2000). The existence of binding sequences could also indicate a locally different nucleosomal repeat length (Fig. 1.5D).
Besides the nucleosomal core, ~28% of the histone amino acid sequence belong to the C- and N-terminal histone tails, which reach out of the core partly with bind- ing to the DNA. The major part of the tails are not connected to DNA and the exact spatial tail positions are unknown. Nevertheless, they are involved in the chromatin fiber formation and are a substrate for posttranslational modifications as acetylation, methylation, phosphorylation, ribosylation and ubiquitinilization and binding of proteins. These modifications are currently discussed as a second coding level called histon-code for the genetic information in addition to the base pair sequence.
Recently, the 42kDa heavy H2A derivate macroH2A (mH2A), was discovered (Pehrson et al., 1992; Vijay-Kumar et al., 1995; Pehrson et al., 1997; Constanzi &
Pehrson, 1998; Pehrson et al., 1998; Lee et al., 1998; Csankovszki et al., 1999; Mer- moud et al., 1999; Rasmussen et al., 1999; Rasmussen et al., 2000). mH2A which locates preferentially in the inactive X chromosome, consists of two major parts:
The N-terminal one has ~50% similarity to the usual H2A. The C-terminal one con- sists of a region with 57% similarity to H1 and a region common for DNA binding zink-finger proteins. This second part acts as C-terminal histone tail and might play a major role in the inactivation of the X chromosome.
1.2.3 The Chromatin Fiber
On the third level of DNA compaction, the chain of nucleosomes (1.2.2) is further compacted to the 30nm chromatin fiber under physiological conditions due to inter- actions of the histones and/or the total nucleosome (Fig. 1.5). The nucleosome arrangement within the 30nm chromatin fiber (Fig. 1.5C) as well as the local degree of compaction is still under debate (Woodcock et al., 1993; van Holde & Zlatanova, 1995; Woodcock & Horowitz, 1995; Ehrlich et al., 1997; Hammermann et al.
2000): In the solenoid model proposed by Finch & Klug (1976) the nucleosomes are confined to a solenoid with nucleosomes stretching to the exterior and the linker between the nucleosomes crossing the fiber interior. However, many in vitro, scan- ning force, and cryo-electron microscopic studies, favour a zig-zag arrangement of nucleosomes (Leuba et al., 1994; Horowitz et al., 1994). Nevertheless, under physi- ological conditions the average density of 6 nucleosomes per 11nm (e.g. ≈
The First Three Compaction Levels of the Human Genome 7
Fig. 1.4 Structure of the Nucleosome
The nucleosome is composed of two of each of the histones H2A(blue), H2B (green), H3 (yellow), H4 (red) around which the DNA double helix (white) is wound 1.75 times. The autofluorescent pro- teins (AFP) used in chapter 7 “Chromatin Alive” were attached to the C-terminus of the histones (C- terminus: small spheres; N-terminus: big spheres; both in left two columns only). Due to the move- ment of the histone tails their position could not be located in X-ray diffraction analysis. The position of the histone H1 is unknown and was therefore not included. (Atomic positions due to Protein Data Bank (PDB) entry 1EQZ, 06.04.2000, visualized with WebLeb Viewer-Lite, Molecular Simulations Inc., USA).
8 Tobias A. Knoch Introduction
105bp/nm) is common for both models (Wolffe, 1995). Besides in vitro and electron microscopic studies (Horowitz et al., 1994;Woodcock, 1994; Horowitz et al., 1997;
Woodcock & Horowitz, 1997; Woodcock & Horowitz, 1998; Bednar & Woodcock, 1999), neutron scattering experiments on intact nuclei of living cells revealed not only a fiber diameter of 30±5nm but also that it is a dominant feature in the cell nucleus (Baudy & Bram, 1978; Baudy & Bram, 1979; Ibel, 1982; Notbohm, 1986).
Recent cryo-electron microscopic studies reveal also density variations possibly combined with heterogeneous nucleosome positioning within the chromatin fiber (Fig. 1.7). Thus, also the 30nm chromatin fiber, the third level of DNA compaction, plays an important role in the storage and regulation of the genetic information.
Therefore, from the DNA, over the nucleosome to the chromatin compaction level, two chemical coding and three structural regulation schemes exist.
1.3 Hypotheses of the Higher-Order Chromatin Structure
In contrast to the DNA double helix (1.2.1) and the nucleosome core (1.2.2), the structure of which is known to atomic detail, all higher compaction levels require a
Fig. 1.5 Structure and Loops of the 30nm Chromatin Fiber
Electron microscopy of chromatin reveals an open perl on a string motive structure without the his- tone H1 (A; 10mM salt), which is condensed to the 30nm chromatin fiber if the histone H1 is present (B, C; both 10mM salt). The chromatin fiber is folded into loops, thus being the next stage in the higher organization of the human genome (D). Due to the partial decondensation of the 30nm chro- matin fiber because of the preparation, the uneven distribution of nucleosomes along the DNA sequence could be estimated. (images A, B, C from Voet & Voet, 1995; D from Reznik et al., 1990).
A B C
D
Hypotheses of the Higher-Order Chromatin Structure 9
more stochastic way of description due to increase of structural possibilities. The hypotheses for the higher-order chromatin organization range from highly random to very well defined, with a wide spectrum of combinations on different scales. The bigger the scale or the higher the organizational level, the more important the inter- play between randomness and order gets.
1.3.1 The Rabl and Boveri Interphase Model
In the 19th century the high condensation and density degree of metaphase chromo- somes were already assumed (Waldeyer, 1888), but the three-dimensional inter- phase organization of chromatin was highly speculative leading to a variety of hypotheses: e. g., the chromosomes should consist of chromatin spheres (Pfitzner, 1881) consisting of a kind of plasma with an unknown but nevertheless precisely defined structure (according to A. Weismann, for details and a general overview see Cremer, 1985). Based on light microscopic investigations on Samandra maculata and Proteus cells C. Rabl (1885) described that chromosomes kept their ana- and
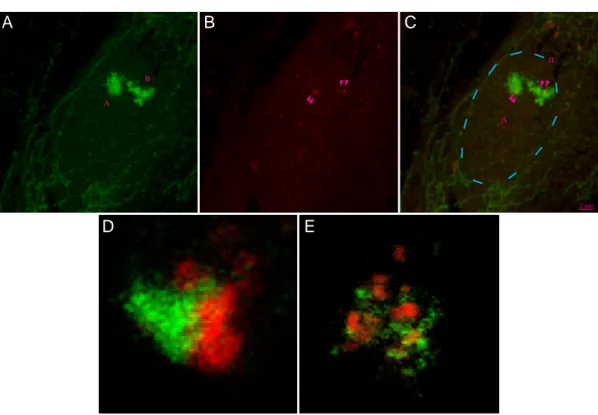
Fig. 1.6 Loop Structures in the Arabidopsis thaliana Genome visualized by FISH
A, Chromatin loop in a nucleus of a parenchyma cell of immature flowerbuds from Arabidopsis thal- iana fixed with ethanol/acetic acid (3:1) and subsequent staining of two BAC (bacterial artificial chromosome) regions T19B17 (length: ~106kbp; green) and T27D20 (length: ~80kbp; red) using FISH. The loop is only visible in one of the two homologous chromosomes. The BAC locate near the centromer (Cen) on the top arm (Nor: telomer) of chromosome 4 (C). The DNA was counterstained with DAPI (blue). B, Enlargement of the chromatin loop reveals its length of 1.5 to 2µm, thus the chromatin density ranges from 40 to 55kbp/µm which is relatively low for Arabidopsis chromatin (100 to 200kbp/µm; human: ~100kbp/µm).This low density could be due to the harsh fixation proce- dure which is known to change the nucleosome status (sour extraction of histones!). (images with courtesy of P. Fransz, Swammerdam Institute for Life Sciences, BioCentrum Amsterdam, Amster- dam, The Netherlands; see also Fransz et al., submitted).
Nor
Cen
T19B17 (106 kbp)
5 µm 0.5 µm
A B C
Arabidopsis thaliana Chr. 4
T27D20 (80 kbp)
10 Tobias A. Knoch Introduction
telophase arrangement also during interphase. Beyond, from primary nuclear fibers, secondary and ternary fibers should extend and form the chromatin network of inter- phase nuclei (Fig. 1.8A). The primary nuclear fibers themselves should extend from a so called pole field, located on one side of the cell nucleus and containing the cen- tromers, to the other anti-pole field located at the other side of the nucleus. T. Boveri (1909) extended this model by postulating that the chromosomes are organized in territories in interphase like in metaphase and that both conditions only differed in their degree of condensation.
1.3.2 The Interphase Models of Comings and of Vogel & Schroeder
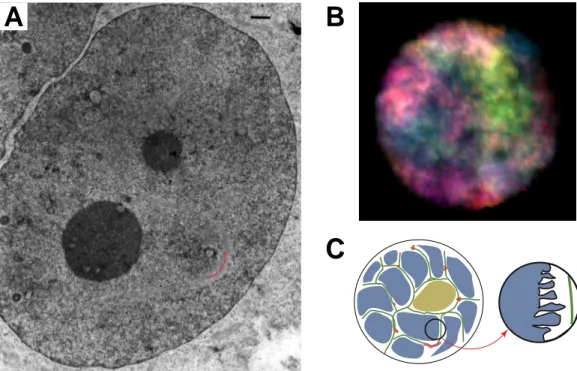
With the advent of electron microscopy and the possibility to investigate the three- dimensional organization of cell nuclei with high resolution (Wischnitzer, 1973), the model of Rabl & Boveri (1885, 1909) and their territory or compartimentalization hypothesis of the nucleus seemed to be outdated. According to the new observations the metaphase organization is totally decondensed (Fig. 1.13A), thus according to Comings (1968) the chromatin fiber could roam the nucleus freely despite some few attachment points at the nuclear matrix (a hypothetical nuclear protein network pos- tulated from existenceof the insoluble rest after biochemical extraction procedures of nuclei; Pienta & Coffey, 1974), the nucleolus and the nuclear membrane (Fig. 1.8B). This is in agreement with the localisation of so called euchromatin (less dense and more active chromatin) in the inner nuclear regions in contrast to the closer nuclear membrane localisation of so called heterochromatin. The condensa- tion degree thereby should be regulatedby the density of chromatin attachment sites.
In the relatively similar model of Vogel & Schroeder (1974) the density of attach- ment points depends on the number anddensity of the nuclear pores in the nuclear membrane. The chromatin fiber should stretch more or less linearly between these attachment points. Consequently, both models favour an unterritorialized and very random organization of chromosomes in interphase.
Fig. 1.7 Folding of the Chromatin Loops into Rosettes/Chromomeres in EM Images
Loops of the 30nm chromatin fiber form rosettes or also called chromomeres which are bound together by interacting granules at their bases (A-E). Depending on the preparation method the chro- matin fiber including the nucleosomes and thus histones are preserved (D, E). F, The nucleosome distribution within a chromatin loop in a chromomere depends for genes on the composition of introns (thin lines) and exons (thick lines), their length fitting multiples of the nuleosomal repeat length as shown in schematic models (αα: human preproglucagon gene, 6455bp; βαα βββ: mouse MHC class II H2A-Ia-beta haplotype-b gene, 5801bp; χχχχ: rat beta-actin gene, 2758bp; δδδδ: chicken ovalbumin gene, 5280; εεεε: rabbit Ig germline kappa isotype K1 allotype b4 gene, 4545bp; φφφφ: unknown; γγγγ: sea urchin histone complex, H1, H4, H2B, H3 and H4; from Reznik et al., 1990; see also Reznik et al., 1991). The rosettes/chromomers are connected by linker chromatin to form whole chromosomes (G- K, see also linker chromatin in A and D). Within the rosettes also transcription takes place shown by the visibility of lambrushes (J, K). (Images: A, B:Avramova et al., 1990; C: Salganik et al., 1990; D- F: fromReznik et al., 1990; G-K: Tsvetkov & Parvenov, 1990; see also Tsvetkov & Parvenov, 1995;
scale bars: A: 160nm; B: 160nm; C: 500nm; D:125nm; E: 250nm; G: 8.0µm; H: 3.0µm; I: 3.0µm;
J: 1.0µm; K: 1.0µm).
Hypotheses of the Higher-Order Chromatin Structure 11
A B
C D E
F
J K
I H
α β χ
δ ε φ γ
G
9 8 1
9
1
1 1
1
1 1 7
3 2 13
2 2
5 5
7
2 2
2 2
2 2
2 2
1 1 1
1 1 1 1 3
9 8
6
15 5
5
5
5
12 Tobias A. Knoch Introduction
1.3.3 Ideogram Banding and The Radial-Loop-Scaffold Metaphase Model Metaphase chromosomes being the biggest nuclear structures were first described by C. W. Nägli (1842) and W. Hofmeister (1848), and later named with the greek word for stainable bodies by Waldeyer (1888). The visualization of the cylindrical metaphase chromosomes with light microscopy reveal their high degree of conden- sation. A compaction factor of ~1000 is estimated taking into account the average length of a linearized chromosome of ~4.5cm and of a metaphase chromosome of
~4.3µm (Fig. 1.9A). The centromer where the two sister chromatids are attached in the metaphase plate before cell division and where the spindle fibers attach for their transport were already described.
The development of staining techniques led to the finding of the so called ideo- gram banding pattern classified as G-, Q-, R- and C-bands according to the used protocol (although the staining mechanism is still unknown; Fig. 1.9B, Fig. 1.10):
Giemsa or Quinakrin dark stained bands (G-/Q-bands) overlap with GC-rich chro- mosome regions containing up to 97% inactive genes (Goldman et al., 1984). In contrast, Giemsa light or reversely stained bands (R-bands) are characteristic for AT- rich regions containing genes active through most of the cell cycle (Comings, 1978;
Holmquist, 1992; Craig & Bickmore, 1993). Staining with Giemsa after a denatur- ing-renaturing preparation leads to a third type of bands (C-bands) mainly specific for in general AT-rich DNA regions and attributed to the so called constitutive hete- rochromatin containing repetitive and transcriptionally inactive DNA regions.
According to their content of active genes, R-bands are replicated before G-bands and these before C-bands during the S-phase (Camargo & Cervenka, 1982). In sum- mary, in the 24 different chromosomes of the human genome ~850 ideogram bands are present and split during the decondensation into interphase in ~2500 bands before they cannot be resolved anymore (Fig. 1.10; Francke, 1994).
Consequently, the chromatin fiber within metaphase chromosomes needs to be folded tightly and presumably into 30 to 120kbp sized loops. According to the Radial-Loop-Scaffold model derived from electron microscopic images of histone- depleted chromosomes, these loops are attached to a protein scaffold forming the axis of the chromosome (Fig. 1.9C; Paulson & Laemmli, 1977). The attachment was expected to be mediated by AT-rich scaffold-associated DNA regions possibly bound by Topoisomerase II or histone H1. The scaffold itself should consist of non- histone proteins, mostly Topoisomerase II (Earnshaw & Laemmli, 1983; Earnshaw
& Heck, 1985). Based on immunofluorescent labelling, a helical topology with opposite isomery between sister chromatids was proposed (de la Tour & Laemmli, 1988; Rattner & Lin, 1985). The Radial-Loop-Scaffold was extended by assuming that the scaffold is in some regions parallel to the chromatid axis and helical in oth- ers (Saitho & Laemmli, 1994). The formation of ideogram bands would then corre- spond to different organizations of the scaffold and presumably also different loop sizes. The hypothesis, however, held only for metaphase chromosomes, although it seemed reasonable that regions containing inactive genes remained in this conden-