Research Collection
Doctoral Thesis
Statistical Studies of Gastrointestinal Diseases
Author(s):
Lang, Brian Matthew Publication Date:
2020
Permanent Link:
https://doi.org/10.3929/ethz-b-000412680
Rights / License:
In Copyright - Non-Commercial Use Permitted
This page was generated automatically upon download from the ETH Zurich Research Collection. For more information please consult the Terms of use.
GASTROINTESTINAL DISEASES
Brian M. Lang
Diss ETH N
O26094
Diss. ETH N 26094
STATISTICAL STUDIES OF GASTROINTESTINAL DISEASES
A thesis submitted to attain the degree of DOCTOR OF SCIENCES of ETH ZURICH
(Dr. sc. ETH Zurich)
presented by BRIAN MATTHEW LANG M.Sc. Biostatistics, University of Vermont
born on 30.08.1989
citizen of the United States
accepted on the recommendation of
Prof. Dr. Niko Beerenwinkel PD Dr. med. Benjamin Misselwitz
Prof. Dr. Dagmar Iber Prof. Dr. Roger Kouyos
2020
Contents
Abstract 1
Kurzfassung 3
1 Introduction 5
2 SNPs Modulate Environmental Effects 17
3 Wellbeing in IBD 47
4 Colorectal Cancer Development 69
5 Discussion 103
Bibliography 109
Curriculum Vitae 117
Acknowledgements 118
Abstract
This dissertation comprises three statistical studies in the field of gastrointesti- nal diseases. Undertaken during the author’s tenure as a doctoral student in the Computational Biology Group of Dr. Niko Beerenwinkel at the Department of Biosystems Science and Engineering at ETH Zurich; the presented studies span multiple diseases and approaches. Epidemioligcal questions in the context of IBD risk and colorectal cancer development are investigated through the exten- sion of mathematical models and application of robust statistical methodology.
Outlining the public health relevance of the individual diseases, as well as intro- ducing the context in which the work has been carried out, Chapter 1 provides necessary motivation and background for the following chapters. A brief in- troduction into the clinical context of inflammatory bowel disease and patient wellbeing is then followed by a brief description of analysis methods utilized in the subsequent clinical research. Finally, Chapter 1 introduces the epidemiol- ogy and models historically used to investigate colorectal cancer. In Chapter 2, we make a first investigation into the interplay between smoking-related genetic variants and the effect of smoking on inflammatory bowel disease (IBD) sever- ity. While previous work has focused on the simple effects of environmental or genetic factors on IBD disease course, we expand this approach and discover evidence of a modulating effect between a genetic smoking-risk score and the association of smoking with the expected number of surgeries in Crohn’s disease patients. In Chapter 3, we characterize the self-reported wellbeing of the Swiss IBD cohort and investigate potential relationships between individual wellbe- ing and future disease complications. Chapter 4 presents an extension to the two-type branching process model and applies it to epidemiological data of col- orectal cancer (CRC) growths. Utilizing data sources pertaining to precancerous adenomas as well as malignancies, we produce a practically identifiable model which can recapitulate trends of prevalence and average growth size seen in CRC. After performing inference with this model, we provide new evidence for the rates which define adenoma-to-malignancy conversion. Chapter 5 provides us with a conclusion; synthesising the main takeaway of this thesis as well as offering a path forward for new research.
Kurzfassung
Diese Dissertation umfasst drei statistische Studien auf dem Gebiet der Gastro- intestinalen Erkrankungen. Der Autor war als Doktorand in der Gruppe Compu- tational Biology von Prof. Dr. Niko Beerenwinkel am Departement Biosystems Science and Engineering der ETH Zürich tätig. Die vorgestellten Studien umfas- sen mehrere Krankheiten und theoretische Methoden. Durch die Verwendung robuster statistischer Methoden und die Erweiterung mathematischer Modelle, werden epidemiologische Fragen im Zusammenhang mit dem IBD-Risiko und der Entwicklung von Darmkrebs untersucht.
Das Kapitel 1 beschreibt die Relevanz der einzelnen Krankheiten für die öffent- liche Gesundheit,stellt den Kontext vor, in dem die Arbeit durchgeführt wurde und liefert die notwendige Motivation und den Hintergrund für die folgenden Kapitel. Nach einer kurzen Einführung zu den klinischen Aspekten der entzünd- lichen Darmerkrankung und des Wohlbefindens des Patienten, folgt eine kurze Beschreibung der Analysemethoden, die in der anschließenden klinischen For- schung eingesetzt werden. Schließlich stellt Kapitel 1 die Epidemiologie und Modelle vor, die historisch zur Untersuchung von Darmkrebs verwendet wur- den. Im Kapitel 2 untersuchen wir erstmals das Zusammenspiel zwischen rauch- bedingten genetischen Varianten und den Auswirkungen des Rauchens auf die Schwere der entzündlichen Darmerkrankung (IBD). Während sich die bisheri- gen Arbeiten auf die einfachen Auswirkungen von Umwelt- oder genetischen Faktoren auf den Verlauf der IBD-Krankheit konzentriert haben, erweitern wir diesen Ansatz und finden Hinweise auf eine modulierende Wirkung zwischen ei- nem genetischen Raucher-Risiko-Score und dem Zusammenhang des Rauchens mit der erwarteten Anzahl von Operationen bei Morbus Crohn. Im Kapitel 3 cha- rakterisieren wir das selbstberichtete Wohlbefinden der Schweizer IBD-Kohorte und untersuchen mögliche Zusammenhänge zwischen dem individuellen Wohl- befinden und zukünftigen Krankheitskomplikationen. Kapitel 4 stellt eine Er- weiterung des “two-type branching process” Modells vor und wendet es auf epidemiologische Daten von Darmkrebs (CRC) an. Unter Verwendung von Da- tenquellen, die sowohl Präkanzerose als auch Malignome betreffen, erstellen wir ein praktisch identifizierbares Modell, das Trends der Prävalenz und der durchschnittlichen Wachstumsgröße im CRC zusammenfassen kann. Nachdem wir die Inferenz mit diesem Modell durchgeführt haben, können wir neue Be- weise für die Tendenz, die die Umwandlung von Adenom in Malignität definie- ren, liefern. Kapitel 5 liefert eine Schlussfolgerung, die die Zusammenfassung der wichtigsten Ergebnisse dieser Arbeit sowie Möglichkeiten zukünftiger For- schung vereint.
CHAPTER 1
INTRODUCTION
Inflammatory Bowel Disease
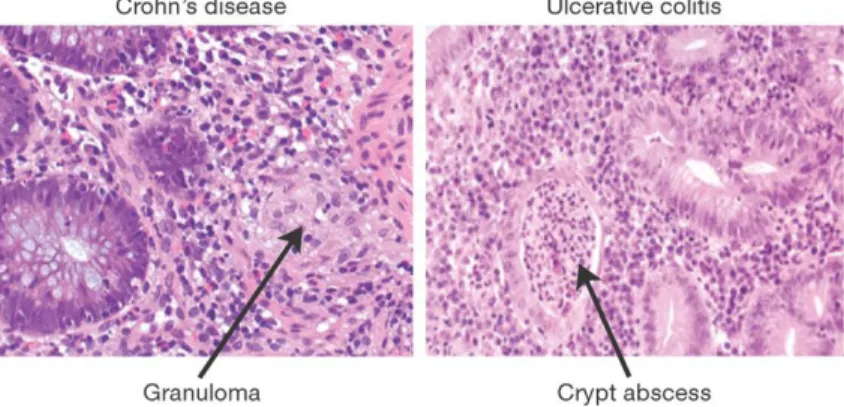
Chronic inflammation disorders which spontaneously present and affect the gas- trointestinal tract, ulcerative colitis (UC) and Crohn’s disease (CD) are the two main constituents of inflammatory bowel disease (IBD). These two forms, while sharing a single name and both being characterized by chronic bowel inflam- mation, feature distinct presentation and pathogenesis. While ulcerative colitis presents nearly exclusively in the colon and rectum, Crohn’s disease symptoms can be found anywhere along the gastrointestinal tract. Furthermore, the histol- ogy of the two diseases is often distinct (Xavier and Podolsky, 2007; Feakins, 2013; Torres et al., 2017; Ungaro et al., 2017). IBD is a disease of complex aetiology–developing from the interaction of genetics, environment, and intesti- nal microbiome.
Figure 1.1:Histology of Crohn’s Disease and ulcerative colitis.Biopsies of CD and UC active disease. In CD (left) we see many cell types but no cell death, with irregular patches of inflammation. In UC (right) we see consistent heavily damaged epithelial tissue and cell death. Figure was adapted from Xavier and Podolsky (2007) with permission fromNature Publishing Group
IBD is becoming increasingly prevalent (Kamm, 2017; Kaplan, 2015) with the
developed nations see a lower risk, but even here, rates of IBD diagnosis have been increasing rapidly. These trends have been commonly attributed to environ- mental factors, such as smoking, diets, pollution, and an increasingly sedentary workforce (Ng et al., 2017).
Typically diagnosed in individuals aged between 15 and 40 years, IBD predomi- Disease
course nantly affects young individuals (Stallmach et al., 2011). When Crohn’s disease is diagnosed, there is a strong difference between the symptoms of older and younger patients. While older patients are often admitted to the hospital due to anaemia and malnutrition, younger patients are more often diagnosed due to pre- sentation of extra intestinal manifestations of the disease (Freeman, 2005). In contrast to CD, ulcerative colitis tends to found consistently with rectal bleeding and diarrhoea, regardless of patient age (Riegler et al., 2000).
Disease severity, as qualified by the extent and location of inflammation, is used to educate treatment decisions. In UC this is more simple, and clinicians will define extent by the involved regions of the colon (Satsangi et al., 2006). CD, on the other hand, takes into account: age, location of the inflammation, and presence of complications such as stricturing (fibrosis) and penetration (fistulis- ing) (Bettenworth, 2016). More holistic severity grading of CD and UC can be found in the Crohn’s Disease Activity Index (CDAI) (Best et al., 1976) and the Truelove and Witts Severity Index (TWSI) (Truelove and Witts, 1955). These in- dices are predominantly used in clinical research to assess patient improvement and produce scores that can be tracked longitudinally.
While IBD is a life-long disease with no known cure, there are a growing collec- tion of therapies which can aid in disease management. The goal of management is to achieve and maintain disease remission, subsequently leading to improved quality of life (Wilhelm and Love, 2017). A more ambitious therapy endpoint is a change in disease course and a recovery of the muscosa (Dave and Lof- tus, 2012). The healing of the mucosa leads to a decreased risk of surgery and a decreased need for cortico-steroid treatments which each negatively impact patient quality of life. Anti-inflammatories (aminosalicylates), corticosteroids, immuno-suppressants, TNF blockers, and leucocyte inhibitors, are all used to manage Crohn’s disease and ulcerative colitis (Blonski et al., 2011).
In the case of severe disease which either: does not respond to therapy, degen- erates to perforation of the colon, or leads to fistulising disease, surgery is often needed (Hwang and Varma, 2008). In the case of UC, this is typically total ab- dominal colectomy with an end ileostomy; removing most of the bowel while avoiding the need for more involved procedures (Cohen et al., 2005). However, in the case of Crohn’s disease there are many more possible surgeries and up to 90% of Crohn’s patients eventually need a surgical intervention (Hwang and Varma, 2008). Due to the fact that Crohn’s disease exists across the entire en-
opting to resect the minimal amount of the bowel. Recurrence rates of up to 80% over 15 years lead to many patients having multiple surgical interventions (Bernell et al., 2000).
The genome of an organism is the code that defines the functioning of their Genetic Risk systems. In humans, this DNA code is comprised of more than three billion
nucleotides. Divided into codons of length three and redundantly transcribed from 64 possible combinations (43) to 20 amino acids (RNA) which are subse- quently translated into protein, alterations to the DNA have the potential to lead to altered RNA and generation of incomplete or unusable protein (Alberts et al., 2014). These alterations can come in several forms. In most cases, variation is inherited from one’s parents in the form of single nucleotide polymorphisms (SNPs) (Guthery et al., 2007). Variation can also be introduced due to muta- tion, and this will be discussed later in this thesis. There are yearly advances to the understanding and treatment of IBD (Xavier and Podolsky, 2007; Kim and Cheon, 2017) but the mechanisms and risk factors are still not fully understood.
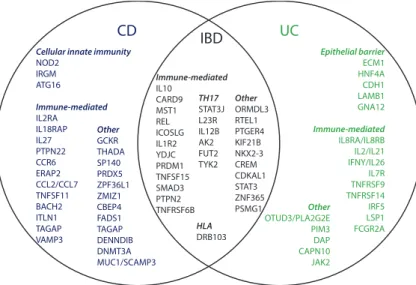
There is now an established hereditary component to the disease (Uniken Ven- ema et al., 2016; Parkes, 2012; Ek et al., 2014). Genome-wide association stud- ies have highlighted many single-nucleotide polymorphisms (SNPs) in the hu- man genome which seem to confer some risk or protection to IBD in general, or to either CD or UC specifically. It is in this context that 163 loci have been iden- tified as related to IBD development (Jostins et al., 2012). Many of these loci are immune-system related. More recently, 38 loci have been identified which are shared across ethnic groups and modulate the process of autophagy, epithelial barrier protection, and T-cell response (Liu et al., 2015).
Additional to genetic risk factors, there are many environmental or behavioral Environmental Risk
factors which also have been found to increase or decrease risk for IBD. In both disease groups, breastfeeding (Klement et al., 2004) and early contact with an- imals have protective effects for the child (Ananthakrishnan, 2015). Cigarette smoking is a well-known risk-factor for CD (Birrenbach and Böcker, 2004), but seems to have protective effects against UC progression (Beaugerie et al., 2001).
In particular, the quitting of smoking is actually a risk-factor for UC develop- ment and smoking while having UC is associated with a milder disease course (Beaugerie et al., 2001). While antibiotic drugs have only been established as as- sociated with CD risk (Ungaro et al., 2014), other types of drugs, such as aspirin, NSAIDs (Ananthakrishnan et al., 2012), and oral contraceptives (Cornish et al., 2008) have all been identified as risk-factors for both sub-types. It is becoming increasing clear that the microbiome plays a large role in IBD onset (Chaput et al., 2017; Biedermann et al., 2014)
The Swiss IBD cohort study was established in 2007 with the goal of follow- Swiss IBD cohort study ing IBD disease progression and investigate patient outcomes conditional on
treatment regimes (Pittet et al., 2009). After enrollment, followup is yearly
CD IBD UC
Cellular innate immunity NOD2
IRGM ATG16 Immune-mediated IL2RA IL18RAP IL27 PTPN22 CCR6 ERAP2 CCL2/CCL7 TNFSF11 BACH2 ITLN1 TAGAP VAMP3
Other GCKR THADA SP140 PRDX5 ZPF36L1 ZMIZ1 CBEP4 FADS1 TAGAP DENNDIB DNMT3A MUC1/SCAMP3
Immune-mediated IL10
CARD9 MST1 REL ICOSLG IL1R2 YDJC PRDM1 TNFSF15 SMAD3 PTPN2 TNFRSF6B
TH17 STAT3J L23R IL12B AK2 FUT2 TYK2
HLA DRB103
Other ORMDL3 RTEL1 PTGER4 KIF21B NKX2-3 CREM CDKAL1 STAT3 ZNF365 PSMG1
Epithelial barrier ECM1 HNF4A CDH1 LAMB1 GNA12 Immune-mediated IL8RA/IL8RB IL2/IL21 IFNY/IL26 IL7R TNFRSF9 TNFRSF14 IRF5 LSP1 FCGR2A Other
OTUD3/PLA2G2E PIM3 DAP CAPN10 JAK2
Figure 1.2:Inflammatory bowel disease (IBD) loci.Venn-diagram demonstrating the distribution of identified loci (gene name) across IBD sub-group. Loci are arranged according to pathway. Figure was adapted from Ek et al. (2014) with permission from theHellenic Society of Gastroenterology
and involves logging all changes to the patient’s disease situation (e.g., subse- quent surgeries, extra-intestinal manifestations, new prescriptions, endoscopic investigations) as well as recording patient response on a variety of disease and non-disease metrics. Both UC and CD have sub-type-specific scores which mea- sure instantaneous disease burden, Modified Truelove and Witts Severity Index (MTWAI) (Truelove and Witts, 1955) and Crohn’s disease activity index (CDAI) (Best et al., 1976), respectively.
A subsection of patients underwent panel sequencing for pre-selected single nu- cleotide polymorphisms (SNPs), chosen for their clinical interest. This data is particularly useful to assess the hereditary genetic contribution to certain disease phenomena as well as to better characterize the disease cohort.
At a single time-point, patients were sent a self-reporting questionnaire on the topic of pain in IBD, and so the SIBDCS also has cross-sectional data about patient reported pain (Zeitz et al., 2016). It is from this pain questionnaire that we obtain the self-reported wellbeing as measured by the Marburg scale (Basler, 1999), which will be discussed later.
Smoking in IBD
As seen in Chapter 2, smoking is a significant risk factor for IBD, particularly for Crohn’s disease. Upon burning, tobacco produces more than 7,000 toxic compounds (Csordas and Bernhard, 2013). While the impact of these toxins on the vascular and respiratory system have been well studied (Csordas and Bern- hard, 2013; Stämpfli and Anderson, 2009), the mechanisms by which smoking lead to worsened gastrointestinal functioning is still a major research topic.
Following up on previous, smoking-related, research within the Swiss IBD co- hort study (Biedermann et al., 2013, 2014, 2015), the work in this thesis (Lang et al., 2017) deepens investigation into the role smoking plays as a risk-factor in IBD.
Rarely addressed in clinical IBD research is the interplay between environmen- tal and genetic risk-factors. The SNP panel used to genotype the SIBDC in- cluded 16 SNPs which have been associated with smoking behavior. These SNPs include variants in the following genes: CYP2A6 (cotinine degregadation) (London et al., 1999), nAChRs (nicotinic acetylcholine receptors) (Staley, 2006), and BDNF (Val66Met enriched in ever-smokers) (Jamal et al., 2014). With this background, we hypothesised that smoking-related genes could modulate the impact of smoking on IBD outcomes. This is investigated in detail in Chapter 2.
Methodological Approaches
In the previous section we gave an overview of the biology underlying clinical IBD as well as a discussion into the measurement and relevance of wellbeing in various patient groups. In this next section we will discuss the statistical frameworks which are utilized throughout this thesis.
GWAS
Genome-wide association studies (GWAS) allow researchers to screen genetic variants for association with an outcome of interest. This has been particularly useful in the identification of the causal SNP for Mendelian diseases (Sellick, 2004; Thomas and Kejariwal, 2004). In diseases with complex etiology this is less useful (Thomas and Kejariwal, 2004), and it is often found that multi- ple genes contribute to a given phenotype (Botstein and Risch, 2003). In these population-level association studies there are some issues that one must be care- ful of (Wang et al., 2005).
Linkage Disequilibrium (LD) is a measure of association between two or more Linkage Dis- equilibrium loci on the genome. This association, looked at across the entire genome, records
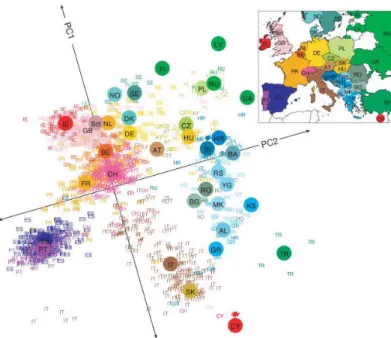
the history of human population mixing and geographic movement of peoples (Novembre et al., 2008). This is due to the way in which chromosomal crossover is unlikely to separate two loci which are in close proximity to one-another. LD
Figure 1.3:Population structure of Europe.Principle component analysis was per- formed on genetic data from 1,387 Europeans. Labels are country code of the patient’s nationality. Large colored points represent median values for each nation. Figure was adapted from Novembre et al. (2008) with permission fromNature Publishing Group
is defined as the divergence,DAB =pAB−pApB, of the observed frequency of a loci pairpAB, with the expected frequency given marginal allelic frequencies pApB. Non-zero values ofDABsuggest association between the two loci (Slatkin, 2008). Significant LD can indicate many things (e.g., natural selection, genetic drift, population bottlenecks) but we are primarily interested in the identification of LD so that we can minimize the number of tested hypotheses (Huang et al., 2006). The logic comes as follows: while we are interested in identification of associations between disease and genetic loci there is a possibility that multiple linked SNPs will give the same signal (Balding, 2006). To investigate these re- lationships in the most powerful way possible (increasing degrees of freedom), we choose "tag" SNPs to represent all SNPs in a particular group of loci with shared LD (Chapman et al., 2003).
The Hardy-Weinberg model assumes that allele and genotype frequencies will Hardy
Weinberg Equilibrium
remain constant given sexual reproduction, random mating, infinite population size, equal frequencies of males and females, and no migration into or out of the population (Li, 1967). For a given bi-allelic loci with allelesAanda with fre- quenciesp andq respectively, the expected genotype frequencies forAA,Aa,
anda aunder Hardy Weinberg Equilibrium (HWE) would bep ,2p q, andq respectively (Hardy, 1908). Departures from this expectation lead to questions of systematic genotyping error (Hosking et al., 2004; Fardo et al., 2009) or bi- ological causes (Xu et al., 2002). In loci which are not in HWE, it becomes difficult to attribute associations found between Hardy-Weinberg loci and phe- notype (Xu et al., 2002).
Structure in populations, such as sub-groups of similar age, gender divisions, Population Effects or geographic clusters, can lead to spurious findings in case-control studies (Li,
1969). Genetic structure stemming from geographic bottle-necking and migra- tion patterns (Cavalli-Sforza and Feldman, 2003) can be controlled for with the inclusion, as covariates, of the components obtained via principal component analysis of large-scale genetic data (Devlin and Roeder, 2004; Patterson et al., 2006).
Given a bi-allelic loci and a phenotype of interest, there are several potential Genetic model of association patterns of association: Full genotype (categorical classification with different
average effect for each genotype), dominant (a a vs. Aa+AA), recessive (a a +Aa vs. AA), and additive (a a <Aa <AA) (Lewis, 2002). Screening in a large-scale study for method of association increases substantially the number of tests performed, leading to multiple testing issues. Minelli et al. (2005) has addressed this issue for the field of meta-analysis, assessing genetic model and strength of association simultaneously.
Statistical Modeling
1.6 1.8 2.0
50 60 70 80 90
Weight (kg)
Height (m)
A
0.00 0.25 0.50 0.75 1.00
1.6 1.8 2.0
Height (m)
P(Sex = Male)
B
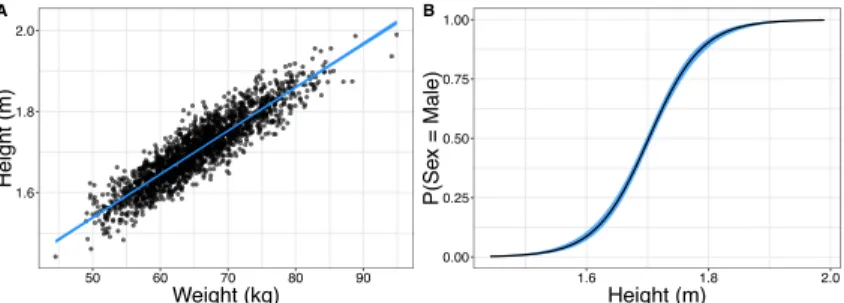
Figure 1.4:Illustration of Data Types and Relationships A.Simulated data for examples. (A) Continuous relationship modelled with a linear regression. (B) Height is used to predict the binary outcome "Sex = Male" with a logistic regression.
The univariate linear regression model, as illustrated in Fig. 1.4A with the rela- Continuous Outcomes tionship between height and weight, fits the modelyi=β0+β1xi+εiin which
we relate the individual observationi of dependent variableyito our indepen- dent variable xi with the slopeβ1, including an interceptβ0. Whereεi is the
relationship betweeny and xcan be computed through the calculation of the valuesβ0andβ1 which minimize the sum of squared differences across alln observations: ∑n
i=1(yˆi −yi)2(Montgomery et al., 2012; Dobson and Barnett, 2018).
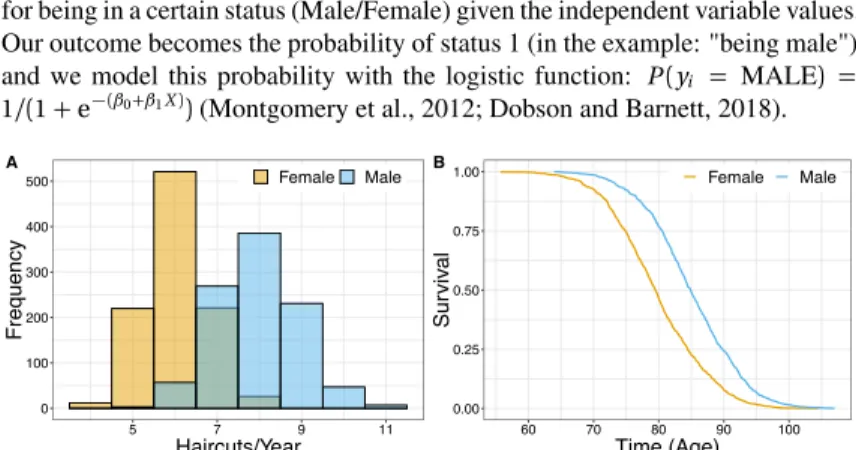
For the modeling of binary outcomes such as seen in Fig. 1.4B where we relate Binary
Outcomes the height of an individual with probability of being male we produce log-odds for being in a certain status (Male/Female) given the independent variable values.
Our outcome becomes the probability of status 1 (in the example: "being male") and we model this probability with the logistic function: P(yi = MALE) = 1/(1+e−(β0+β1X))(Montgomery et al., 2012; Dobson and Barnett, 2018).
0 100 200 300 400 500
5 7 9 11
Haircuts/Year
Frequency
Female Male A
0.00 0.25 0.50 0.75 1.00
60 70 80 90 100
Time (Age)
Survival
Female Male B
Figure 1.5:Illustration of Data Types and Relationships B.Simulated data for examples. (A) Number of haircuts in a year (count) is modeled as a negative binomial with sexes each having unique distribution means. (B) Mortality is modeled with a Cox Proportional Hazards model relating age at mortality to sex.
Count outcomes are distinct from continuous and binary outcomes because they Count
outcomes are bounded at zero and restricted to integers. There are several models which can be used to assess the relationship between count outcomes and independent variables, such as negative binomial regression and its special cases: geometric and Poisson regression. In the example shown in Fig. 1.5A we have a relation- ship between sex and number of yearly haircuts. For this example the data was simulated with a negative binomial distribution, which models the relationship log(yi) =β0+β1xi. Thus the coefficientβ1represents the expected log-increase in number of counts for a one-unit increase in X (Montgomery et al., 2012; Dob- son and Barnett, 2018).
When modeling time-to-event such as time-to-death as in Fig 1.5C, we can use Survival
Analysis the Cox proportional hazards model which relates the event rate (hazard) at time t conditioned on surviving until timet, λ(t), to covariates with the function:
λ(t | X) = λ(t)0e(β1X). In this way the coefficientβ1is modulating the like- lihood of new events occurring. In our example we show the probability of survival (being alive) at timet, which ise−∫0tλ(u)du(Hosmer et al., 2008).
0 100 200 300
0 2 4 6 8 10 12 14 16
Walking commute (minutes)
Frequency
0.28 0.29 0.30 0.31 0.32
6.9 7.0 7.1 7.2
Poisson Lambda
Binomial Probability
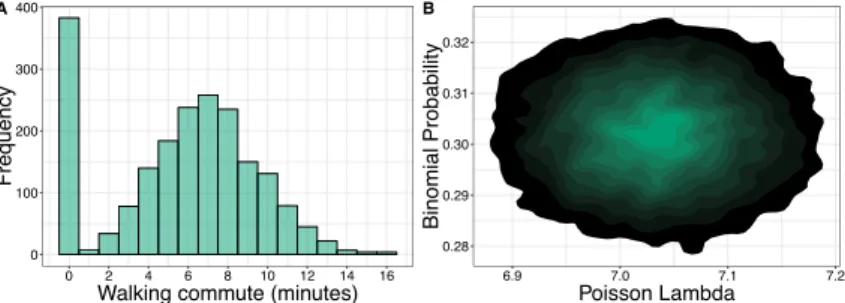
Figure 1.6:Illustration of Data Types and Relationships C.Simulated data for examples. (A) Duration of walking commute in minutes for simulated individuals.
Many individuals do not walk to work, and so have a duration of zero. (B) Likelihood- based MCMC samples for the model which generated the data in (A). True simulated model was a zero-inflated Poisson model with binomial probability of zero set to .3 and Poisson parameterλset to 7.
When modeling count data it is often the case that one has many more zeros Zero Inflation than can be explained. Such data is illustrated in Fig 1.6A which shows the
distribution of walking-commute duration for our simulated data. Since many individuals do not walk to work the values follow a distribution that is reminis- cent of mixture of a binomial and a discrete count distribution, in this case a Poisson. To model such data we use zero-inflated models which are mixture models that allow one to model both the inflated occurrence of zeros in addition to a common distribution of discrete counts.
In each of the previous methods, I present a data source and how one can model Parameter inference data of a particular type. Whether the data is continuous, dichotomous, integer,
or a rate; once we have the data and a model with parameters, we still need to a method to find the parameters which allow the model to best fit the data.
In the case of simple and multivariable linear regression, we have a convenient closed form solution. Given an×p matrix of observed predictorsXwith el- ementsxi j, withi being a single observation out ofntotal observations andj being a given variable out ofp total variables; and an×1column vector of ob- served outcomesY with elementsyi, we can estimate the relationship between them in the form of ap ×1column vectorβˆwith elementsβˆj corresponding to a given variablejby the linear equationβˆ=(
X⊤X)−1
X⊤Y. This vector of parametersβ, minimize sum of the squared differences,ˆ ∑n
i=1(yi−yˆi)2, be- tween the predicted valuesyˆiand observed valuesyi, and is known as the least squares estimator.
In most other cases, we turn to numerical optimization methods to maximize the likelihood or partial likelihood of the model. This approach assumes that each observation can be taken as independent and identically distributed as the others,
with a given set of parameters. Once this has been done for each observation, one multiplies the probabilities together to gain the likelihood of the data, given the model and parameters. The goal is to find the parameters of the model which produce the maximum value of likelihood.
As a motivating example, we have the walking commute data which summa- rizes the amount of time that a particular person took for their commute to work by foot. As before, we assume a zero-inflated Poisson distribution and letπ correspond to the binomial probability of excess zero andλcorrespond to the Poisson count rate. The probability of an observationyibeing 0 given param- etersθ = {π,λ}is then Pr(yi = 0 | θ) = π+ (1−π)e−λ and otherwise Pr(yi =y |θ) = (1−π)λyey!−λ when the observation is greater than zero. With the assumption that observationsY ={0, 1, 4}are independent and identically distributed, the likelihood of the observations given the parameters,L(Y |θ), is the product of individual probabilities for each observation given the parame- ters:Pr(Y |θ) =∏3
i=1Pr(yi|θ) =π+(1−π)e−λ×(1−π)λ1e1!−λ×(1−π)λ4e4!−λ. In this case, the maximum likelihood estimator is the set of parametersθwhich maximize the probabilityPr(
Y |θ)
, which can be determined via numerical optimization methods.
In contrast to maximum likelihood methods are Bayesian methods which at- tempt to ascertain the posterior distribution of the parameters given the data, Pr(θ |Y), which is related to the previous likelihood equation with the Bayes formulaPr(θ | Y) = Pr(YPr(Y|θ)) Pr(θ). Sampling methods such Markov chain Monte Carlo methods are used to assess the posterior parameter distribution in order to gain a more complete understanding of the parameter combinations that can best explain the data (Fig. 1.6B).
Colorectal Cancer
In 2018 colorectal cancer incidence was estimated as the 3rdhighest amongst all cancers, with nearly 1.8 million new cases and 800 thousand deaths (Bray et al., 2018). Colorectal cancer (CRC) is a cancer occurring in the the colon or rectum of the large intestine. These tumors generally develop over long periods of time, starting from mutations which occur during division of the stem cells which lie in crypts of the colon and are responsible for replenishing the epithelial layer of cells in the colon. This mutational step has been found to often involve the chromosomal instability (CIN) pathway (Lin et al., 2003), and in particular the inactivation of theAPCgene (two mutational hits) in theWntsignalling path- way. Individuals who inherit an incompleteAPCgene (one hit) are significantly predisposed to developing CRC (Galiatsatos and Foulkes, 2006). Other genetic pathways associated with CIN in colorectal cancer occurrence are theRASpath- way, which promotes new mutations and can lead to tumor progression (Malum-
is often found to be disabled in developed cases of CRC (Baker et al., 1990;
Boutin et al., 2017). Other pathways to CRC initiation are microsatelite insta- bility (MSI) (Thomas et al., 1996), CpG island methylator phenotype (CIMP) (Shen et al., 2007), and inflammation (Terzi´c et al., 2010; Lasry et al., 2016).
After the environment has been prepared, through any one of the aforementioned Natural History pathways, the observable development of CRC begins. Starting with the emer-
gence of a precursor adenoma, colorectal cancer develops slowly over a time frame of 10-15 years (Winawer, 1999; Kuntz et al., 2011; Prakash et al., 2017).
While developing from adenoma to carcinoma, there is a window of opportunity Screening in which the adenoma will be of sufficient size that endoscopic methods can
detect it, but it has still to transition into a malignant state; this period is referred to as the "dwell time". While there is little experimental evidence for dwell time, expert opinion and computational models have placed it between 10 and 20 years (Kuntz et al., 2011; Prakash et al., 2017; Rex et al., 2017). This timing is quite important, because it educates when endoscopic interventions should take place in order to reduce cancer incidence and mortality (Zauber et al., 2008;
Knudsen et al., 2016; Schoen et al., 2012; Manser et al., 2012). However, since the detection of an adenoma will necessarily lead to its removal, it is difficult to conduct clinical trials to ascertain the likelihood and speed with which an adenoma progresses to carcinoma. In this instance, computational modeling can provide us with estimates (Kuntz et al., 2011; Prakash et al., 2017).
Modeling Approaches
The modeling of cancer development includes a large and diverse number of approaches. While some take a high-level approach, looking specifically at the public health level of the disease with models of population dynamics, others go much further into detail–examining the molecular systems which lead to the diseased state (Csordas and Bernhard, 2013). In the field of systems biology, systems of differential equations which define the functioning of biological sig- naling or metabolic networks can be used alongside experimental data to predict system response to various perturbations (Oliveira et al., 2015; Chubukov et al., 2013; Benzinger and Khammash, 2018).
In evolutionary dynamics, researchers use models which describe changes in reproducing populations. These models have been particularly well-applied to population genetics, in which evolutionary games are carried out in reproduc- ing populations with variations in fitness (Marjoram and Tavaré, 2006; Moran, 1962; Wright, 1931). In cancer specifically, evolutionary models have been used to examine waiting times to malignancy (Beerenwinkel et al., 2007), model de- velopment of drug resistance (Michor et al., 2005), as well as looking at numbers of passenger and driver mutations (Bozic et al., 2010), response to combination
lignant conversion (Curtius et al., 2017), and tumor metastasis (Sewalt et al., 2016).
In this thesis we examine the progression dynamics of cancer development and will introduce this approach here. While other approaches are interested in the actual nmumber of steps to cancer phenotype, progression has been particu- larly focused on estimating the number of steps to cancer incidence. Starting in the 1950s with Armitage and Doll (Armitage and Doll, 1954) and their de- termination that cancer is the product of six rate-limiting steps, the study of high-level, epidemiological, data has a rich history (Armitage and Doll, 1957;
Kendall, 1960; Moolgavkar and Venzon, 1979; Knudson, 2001; Moolgavkar and Knudson, 1981; Moolgavkar and Luebeck, 1990). More recently, incidence data has been used to investigate the progression of colorectal cancer assuming multi- ple rate-limiting steps and the possibility for exponential growth (Dewanji et al., 2011; Luebeck and Moolgavkar, 2002; Meza et al., 2010, 2008). In order to gain new insights into the developmental speed of colorectal cancer, Chapter 4 presents an extension to these models and applies it to epidemiological data from the Clinical Outcomes and Results Initiative (CORI) (Lieberman et al., 2008) and Surveillance Epidemiology and End Results (SEER) cancer registry (Surveillance Epidemiology End Results, www.seer.cancer.gov, SEER Program, 2017).
Aims of this thesis
The work in this thesis was undertaken with several specific goals in mind. Gas- trointestinal diseases such as IBD and Colorectal carcinoma are serious and life altering, we therefore sought to provide contributions of clinical relevance while also remaining very interested in the application and development of methods.
With access to a substantial cohort study regarding IBD, we sought to develop statistical models which could uncover and explain disease outcomes in patients with Crohn’s disease and ulcerative colitis. First, the relationship between smok- ing and disease progression was of particular interest due to the presence of con- tradictory findings in the literature and the opportunity to query the possibility that the genome of a patient may modulate this relationship. Next, after noting that patient who smoke often have more negative outlook than those who do not, we sought to examine whether positive or negative patient outlook is informa- tive when predicting future patient outcomes. With a change of subject matter, from IBD to colorectal cancer, we were interested in examining the censored process which underlies the success of carcinoma screening programs. Working to gain insight into the dynamics of adenoma-to-carcinoma transition, we sought to construct a new model for the average progression of colorectal cancer devel- opment.
CHAPTER 2
SNPS MODULATE
ENVIRONMENTAL
EFFECTS
Genetic polymorphisms associated with smoking behaviour predict the risk of surgery in patients with Crohn ’ s disease
B. M. Lang1,2 | L. Biedermann3 | W. T. van Haaften3,4 | C. de Valliere3 | M. Schuurmans5 | S. Begre6 | J. Zeitz3 | M. Scharl3 | M. Turina7 | T. Greuter3 | P. Schreiner3 | H. Heinrich3 | T. Kuntzen3 | S. R. Vavricka8 | G. Rogler3 |
N. Beerenwinkel1,2 | B. Misselwitz3 | on behalf of the Swiss IBD Cohort Study Groupa
1Department of Biosystems Science and Engineering, ETH Zurich, Basel, Switzerland
2Swiss Institute of Bioinformatics (SIB), Lausanne, Switzerland
3Division of Gastroenterology, University Hospital Zurich (USZ) and Zurich University, Zurich, Switzerland
4Department of Gastroenterology and Hepatology, University Medical Center Groningen, Groningen, The Netherlands
5Division of Pneumology, University Hospital Zurich (USZ) and Zurich University, Zurich, Switzerland
6Hohenegg Hospital, Meilen, Switzerland
7Division of Visceral Surgery, University Hospital Zurich (USZ), Zurich, Switzerland
8Division of Gastroenterology, Triemli Hospital Zurich, Z€urich, Switzerland Correspondence
Prof. Niko Beerenwinkel, Department of Biosystems Science and Engineering, ETH Zurich, Basel, Switzerland.
Email: niko.beerenwinkel@bsse.ethz.ch and
Dr. med. Benjamin Misselwitz, Division of Gastroenterology, University Hospital Zurich (USZ) and Zurich University, Zurich, Switzerland.
Email: benjamin.misselwitz@usz.ch
Funding information
Swiss Cancer League, Grant/Award Number:
KFS-2977-08-2012; Helmut Horton Foundation; Schweizerischer Nationalfonds zur F€orderung der Wissenschaftlichen Forschung, Grant/Award Number: 32473B- 156525, 3347CO-108792
Summary
Background:Smoking is a strong environmental factor leading to adverse outcomes in Crohn’s disease, but a more benign course in ulcerative colitis. Several single nucleo- tide polymorphisms (SNPs) are associated with smoking quantity and behaviour.
Aim:To assess whether smoking-associated SNPs interact with smoking to influ- ence the clinical course of inflammatory bowel diseases.
Methods:Genetic and prospectively obtained clinical data from 1434 Swiss inflam- matory bowel disease cohort patients (821 Crohn’s disease and 613 ulcerative coli- tis) were analysed. Six SNPs associated with smoking quantity and behaviour (rs588765, rs1051730, rs1329650, rs4105144, rs6474412 and rs3733829) were combined to form a risk score (range: 0-12) by adding the number of risk alleles.
We calculated multivariate models for smoking, risk of surgery, fistula, Crohn’s dis- ease location and ulcerative colitis disease extent.
Results:In Crohn’s disease patients who smoke, the number of surgeries was asso- ciated with the genetic risk score. This translates to a predicted 3.5-fold (95% confi- dence interval: 2.4- to 5.7-fold,P<.0001) higher number of surgical procedures in smokers with 12 risk alleles than individuals with the lowest risk. Patients with a risk score>7 had a significantly shorter time to first intestinal surgery. The genetic risk score did not predict surgery in ulcerative colitis or occurrence of fistulae in Crohn’s disease. SNP rs6265 was associated with ileal disease in Crohn’s disease (P<.05) and proctitis in ulcerative colitis (P<.05).
Conclusions:SNPs associated with smoking quantity is associated with an increased risk for surgery in Crohn’s disease patients who smoke. Our data provide an exam- ple of genetics interacting with the environment to influence the disease course of inflammatory bowel disease.
Niko Beerenwinkel and Benjamin Misselwitz contributed equally to this work.
aSee Appendix 1.
The Handling Editor for this article was Professor Ailsa Hart, and it was accepted for publication after full peer-review.
| |
DOI: 10.1111/apt.14378
Aliment Pharmacol Ther.2018;47:55–66. wileyonlinelibrary.com/journal/apt ©2017 John Wiley & Sons Ltd | 55
1 | I N T R O D U C T I O N
The clinical courses of inflammatory bowel diseases (IBD) differ widely, with some individuals having only mild symptoms, without significant morbidity and others suffering from severe life-threaten- ing conditions, necessitating intense management including surgery.
Identification of reliable predictors for IBD severity is an unmet clini- cal need and an ongoing challenge in gastroenterology.
Environmental influences can trigger and shape gut inflammation, and effects of smoking,1diet,2physical activity,3exposure to high altitudes4 and drugs5 on IBD disease course have been demon- strated. In addition, there is compelling evidence that genetic factors contribute to gut inflammation, and concordance of IBD phenotypes within families has been noted.6To date, 240 individual genetic loci have been associated with an increased IBD risk.7However, in a sys- tematic analysis, most genetic polymorphisms did not independently predict IBD disease course.8
Understanding the course of IBD likely requires the integration of genetic and environmental influences. Some environmental effects will be limited to subgroups of patients with certain genetic back- grounds and vice versa; genetic associations might be overlooked if relevant environmental factors are not considered. The complexity of assessing gene-environment interactions for IBD pathogenesis is challenging and to the best of our knowledge, no examples have been reported.9
Effects of smoking on IBD are strong and well characterised and therefore, gene-environment interactions might be easier detectable for smoking than for any other environmental risk factor. The effect of smoking in Crohn’s disease (CD) and ulcerative colitis (UC) is dif- ferential.10In Crohn’s disease, smoking generally aggravates the dis- ease course,11-13conferring higher need for immunosuppression,14 higher risk of intestinal resection,15increased recurrence rates14,16 despite efficient medical treatment15and reduced quality of life.17In contrast, smoking seems to protect from subsequent development of UC.18The risk of UC in former smokers is higher compared to patients who never smoked,19,20and a less severe disease course is observed upon resumption of smoking.19,20 Twin studies have demonstrated that in siblings with a similar genetic risk for IBD but discordant smoking status, Crohn’s disease developed in the smoker and ulcerative colitis in the nonsmoker.21The reasons for this have not been clarified.
Nicotine dependency has a strong hereditary compound22and genetics determine several independent aspects of smoking beha- viour. The strongest genetic effects have been observed for smoking quantity.23-25 Genome-wide association studies have discovered high-risk single nucleotide polymorphisms (SNPs) close to nicotinic acetylcholine receptor (nAChR) subunits. Additional risk areas were observed for CYP2A6, associated with nicotine degradation.23-25 Individual SNPs associated with smoking quantity have been com- bined to a genetic risk score that predicts smoking quantity.26It is important to emphasise that SNPs associated with smoking quantity do not necessarily convey a risk of ever-smoking. Ever-smoking
status is an independent phenotype associated with separate SNPs including a valine-to-methionine substitution in the brain-derived neurotrophic factor gene.23
Smoking is a complex behaviour. Genetic signals for smoking quantity contribute to the number of cigarettes per day.23-25How- ever, the genetic effects go beyond cigarettes per day, and SNPs correlate with patient cotinine as well as carbon monoxide levels in expiratory air even after correction for cigarettes per day.27There- fore, genetics may predict“smoking topography”including length and depth of inhalation and number of puffs per cigarette, the com- bination of which will ultimately determine the total exposure towards nicotine and other toxins.
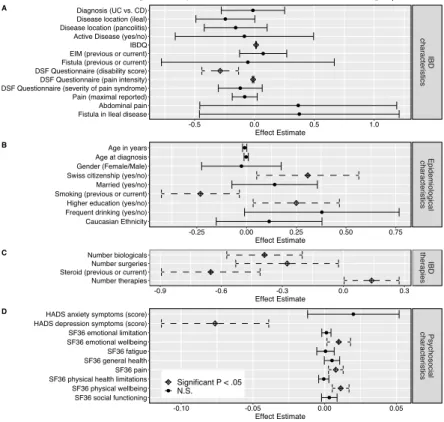
To test whether smoking-associated SNPs mediate the association between smoking and IBD phenotype, we used epidemiological, clini- cal and genetic data from the Swiss inflammatory bowel disease cohort study (SIBDCS). We used this genetic information to predict 5 outcomes: (1) risk of smoking, (2) risk of surgery, (3) fistulising disease in Crohn’s disease, (4) disease location in Crohn’s disease and (5) extent of disease in UC. The primary aim of this study was to test the hypothesis that a genetic risk score comprised of smoking behaviour- associated SNPs can predict a severe disease course indicated by a high rate of intestinal surgery in Crohn’s disease patients who smoke.
2 | M E T H O D S 2.1 | Patients
The SIBDCS is a longitudinal and prospective cohort of IBD patients.
For inclusion, diagnosis of IBD needs to be established for at least 4 months. Data regarding disease course, treatment history and socio-demographic characteristics are prospectively collected.
Among>3000 SIBDC patients, genotypic data for 2071 patients were available. About 422 patients were excluded due to incomplete smoking information at inclusion, 85 due to missing relevant SNPs and 130 for missing socio-demographic information, leaving 1434 patients (821 CD, 613 UC) for further analysis.
2.2 | Ethical considerations
The IBD cohort study has been approved by the ethics committees of Zurich country (EK-1316). All patients signed an informed consent and confirmed their participation in the cohort study at the time of enrolment and gave informed consent for data collection and analy- sis for research purposes. The current sub-study has been evaluated and approved by the scientific board of SIBDC.
2.3 | DNA genotyping and SNP selection Genotyping of SIBDCS patients was performed on patient samples using MALDI-TOFF mass spectrometry-based SNP genotyping.28All SNPs that influence cigarette consumption or nicotine addiction with genome-wide significance from 3 genome-wide association studies
and an independent meta-analysis were selected.23-25,29SNPs were tested pairwise for linkage disequilibrium to determine to what extent the genotype of neighbouring SNPs are correlated. To limit redundancy, in a conservative approach, proxy SNPs were selected from linkage disequilibrium blocks with R2values>0.1. For proxy SNPs, we preferred SNPs with a better quality of supporting litera- ture, as well as a larger minor allele frequency in our cohort (Figure S1 and DataS1: Table S1). Hardy-Weinberg equilibrium was assessed but not expected for our study cohort, which constitutes a nonrandom sample from the Swiss population.
To control for any potential population structure in our SNPs, we performed principle component analysis on our SNPs (post link- age disequilibrium-filtering) and considered the first 3 components as covariates30(Figure S2).
2.4 | Genetic risk score and additional SNPs To conservatively combine genetic information, we followed a vali- dated approach.26We combined all 6 SNPs associated with smoking quantity (rs588765, rs1329650, rs1051730, rs6474412, rs4105144 and rs3733829) to a smoking quantity-associated genetic risk score (genetic risk score) by adding the number of risk alleles. In secondary analyses, a simplified genetic risk score consisting of 2 SNPs (sum- marising the risk alleles of rs588765 or rs1329650) was also consid- ered. Two additional SNPs, rs6265, associated with ever-smoking and rs3025343, associated with smoking cessation, were separately included in multivariate models. In certain analyses, we chose to divide patients according to the median of genetic risk score: A low genetic risk score refers to a genetic risk score<8 and a high genetic risk score to a genetic risk score of≥8 risk alleles.
2.5 | IBD disease characteristics, socio-demographic and psychological measures
For all patients, we retrieved epidemiological information and IBD dis- ease characteristics. The groups of UC and indeterminate colitis patients were fused and analysed as a single entity (referred to as UC henceforward). For the surgery outcome in Crohn’s disease patients, we included all intra-abdominal surgical procedures including stoma surgery. Perianal surgery or fistula surgery were not considered. For UC patients, we calculated rates of colectomy or ileostomy. We did not consider the number of individual surgical procedures in UC patients. Time to first intestinal surgery is determined by the differ- ence between surgery date and patient diagnosis date.
Following recent work from SIBDCS,1ethnicity (Caucasian or other), educational level (higher education/university or other), nationality (Swiss or other), marital status (married or unmarried at enrolment), level of physical activity (at least once a weak or less), smoking status at diagnosis (yes or no, as assessed by the physician at the time point of IBD diagnosis), ever-smoking status (yes or no, if the patient has evidence of smoking reported for any follow-up), smoking cessation (positive ever-smoking status and nonsmoker sta- tus at last follow-up) and alcohol consumption (rarely: rarely or
never/frequent: once a day or more) were also considered. Current age of patient was assessed from last follow-up. Birth and diagnosis year are both scaled as years since 1920 for convenience in analysis.
Disease duration is assessed as the difference between the date of last check-up and the diagnosis date. Patients filled out 3 question- naires on the topic of mental health: The Hospital Anxiety And Depression Scale (HADS), which assesses patient anxiety and depression; the Type-D Scale (DS14), measuring negative affectivity and social inhibition; and the Coping Inventory For Stressful Situa- tions (CISS), which assesses patients on the basis of emotional, task and avoidance-oriented coping (Table 1).
2.6 | Statistical analysis
The 2 alleles of a given SNP were considered to act in a log-additive manner (ie each risk alleles would have an additive effect); rs6265 was assumed to act co-dominant (ie each genetic variant is allowed its own effect). We selected these genetic models as they best explained the variation in smoking using the Akaike information criterion (AIC), which is a measure for the goodness-of-fit of a given model with a preference for models with a lower number of parameters.
For the multivariate analysis, we built a separate model for each outcome of interest: Smoking status at enrolment, surgery in UC, ileal involvement in Crohn’s disease, fistulising disease in Crohn’s disease and extent of disease in UC were modelled with a logistic regression model; a negative binomial model was used for prediction of number of surgeries in Crohn’s disease. For Crohn’s disease surgery, we sum- marised all intestinal surgical procedures excluding fistula surgery. For UC surgery, colectomy, proctocolectomy and ileostomy were consid- ered. For analysis of time to surgery, we focused on Crohn’s disease patients and considered all patients. The outcome of interest was time to the first intestinal surgical procedure after diagnosis with IBD. For comparison of survival curves, a Cox proportional hazards model was used. Bonferroni correctedP-values were computed for each model and presented in the supplementary tables.P-values were corrected on the basis of model size (number of terms in model).
For all models, we started with an identical set of covariates including disease characteristics, demographic features and SNPs (compare DataS1: Tables S2-S7). Psychological covariates, marital status and education were only used for prediction of smoking at diagnosis. In our models, SNPs and smoking, SNPs and disease dura- tion, and age and year of IBD diagnosis, second-order interactions (for instance assessing if effects of SNPs are different in smokers and nonsmokers) were also considered. The presented models are the result of backward step-wise variable selection on the basis of model fit and the prioritisation simpler models.
To assess internal validity of our model for intestinal surgery in Crohn’s disease patients, we generated 500 bootstrap samples from our Crohn’s disease patient cohort and fit our final intestinal surgery model on each of these samples. We derived empirical confidence intervals for the distribution of our estimated model coefficients as a post hoc robustness analysis.31
All analyses were performed inRversion 3.3.0 (2016-05-03).32
3 | R E S U L T S
3.1 | Study population and genetic information For our analysis, data from 1434 individuals (821 CD, 613 UC) were available. Our cohort comprises a mixed patient population of IBD patients with mild to severe disease (Table 1). Seventeen smoking behaviour-associated SNPs across 8 genes were considered; after exclusion of SNPs in strong linkage disequilibrium (ie strong geno- typic correlation), 8 SNPs across 7 genes remained for further analy- sis (Figure S1, Data S1: Table S1).
3.2 | Risk of smoking in IBD patients
A total of 594 patients in our cohort (42%) were smokers at time of diagnosis. In a model including both Crohn’s disease and UC patients, we noted significantly lower smoking rates in UC patients, old age or very young age at diagnosis, patients born more recently, patients who were married, Caucasian patients, those with higher levels of physical activity, better education and low alcohol con- sumption (Figure S3, Data S1).
T A B L E 1 Epidemiological, clinical and genetic characteristics of IBD patients
Crohn’s disease (CD) Ulcerative colitis (UC)
n=821 n=613
Basic epidemiological and socio-demographic characteristics Age at diagnosis; median
[IQR]
26.07 [20.02, 36.20] 30.45 [22.78, 39.79]
Age at end of follow-up;
median [IQR]
45.30 [33.43, 57.75] 46.02 [35.79, 55.36]
Disease duration; median [IQR]
13.31 [7.66, 23.60] 11.13 [7.07, 18.51]
Diagnosis year; median [IQR]
2000 [1991, 2006] 2003 [1995, 2007]
Sex: female (%) 431 (52.5) 285 (46.5)
Smoker at diagnosis; n (%) 440 (53.6) 154 (25.1) Ever smoker; n (%) 517 (63.0) 220 (35.9) Alcohol: rarely or never;
n (%)
470 (57.2) 324 (52.9)
Alcohol: frequent (≥once a day); n (%)
67 (8.2) 30 (4.9)
Married; n (%) 349 (42.5) 322 (52.5)
Swiss citizenship; n (%) 663 (80.8) 488 (79.6)
Caucasian; n (%) 655 (79.8) 501 (81.7)
Higher education; n (%) 208 (25.3) 188 (30.7) High physical activity;
n (%)
458 (55.8) 397 (64.8)
Crohn’s disease characteristics and treatment history Ileal involvement; n (%) 555 (67.6) — Fistula; n (%) 293 (35.7)
>1 Extra-intestinal manifestations; n (%)
515 (62.7)
Biologicals; n (%) 490 (59.7) CD: 0 surgical
procedures; n (%)
386 (47.0)
CD: 1 surgical procedures; n (%)
164 (20.0)
CD: 2 surgical procedures; n (%)
111 (13.5)
CD: 3 surgical procedures; n (%)
67 (8.2)
CD: 4 surgical procedures; n (%)
37 (4.5)
CD: 5 surgical procedures; n (%)
31 (3.8)
CD: 6 surgical procedures; n (%)
12 (1.5)
CD: 7 surgical procedures; n (%)
8 (1.0)
CD: 8 surgical procedures; n (%)
1 (0.1)
CD:≥9 surgical procedures; n (%)
4 (0.5)
(Continues)
T A B L E 1 (Continued)
Crohn’s disease (CD) Ulcerative colitis (UC)
n=821 n=613
Ulcerative colitis disease characteristics and treatment history
Extensive disease; n (%) — 445 (72.6)
>1 Extra-intestinal manifestations; n (%)
315 (51.4)
Biologicals; n (%) 224 (36.5)
Ulcerative colitis surgery;
n (%)
66 (10.8)
Personality traits
HADs depression; n (%) 69 (8.4) 34 (5.5) HADs anxiety; n (%) 142 (17.3) 81 (13.2) Coping aversion-oriented;
median [IQR]
15.00 [11.00, 20.00] 15.00 [11.00, 19.00]
Coping task-oriented;
median [IQR]
13.00 [10.00, 18.00] 13.00 [9.00, 18.00]
Coping emotional- oriented; median [IQR]
21.00 [17.00, 24.00] 21.00 [18.00, 24.00]
Type-D; n (%) 323 (39.3) 244 (39.8)
Type-D introverted; n (%) 196 (23.9) 153 (25.0) Type-D excitable; n (%) 84 (10.2) 45 (7.3) Genetic risk sum; median
[IQR]
7.00 [6.00, 8.00] 7.00 [6.00, 8.00]
High genetic risk score=[8, 12]; n (%)
344 (41.9) 238 (38.8)
2 SNP genetic risk score;
median [IQR]
3.00 [2.00, 3.00] 3.00 [2.00, 3.00]
IQR, interquartile range; CD, Crohn’s disease; UC, Ulcerative colitis; HADS, hospital anxiety and depression scale; SNP, single nucleotide polymorphism.