Wielders et al.: Automated leukocyte differential counters 471 J. Clin. Chem. Clin. Biochem.
Vol. 24,1986, pp. 471 -480
© 1986 Walter de Gruyter & Co.
Berlin · New York
A Comparison of the Screening Ability
of Two Automated Leukocyte Differential Counters
By /. P. M. Wielders
University Hospital Maastricht, Maastricht, The Netherlands, M. H. Beunis
United Delft Hospitals, Delft, The Netherlands and
J. W. J. van Wer seh
De Wever Hospital, Heerlen, The Netherlands
(Received August 23, 1985/January 8, 1986)
Summary: The ability to screen out abnormal leukocyte differential counts by the H 6000™ and the Hematrak 590™ has been evaluated, using the visual 100 cell differential äs a reference. Optimization of the discrimination levels for both Instruments by the use of linear regression procedures and "Receiver Operating Characteristics (ROC) curves" and its impact on their performance characteristics is discussed.
The overall sensitivity for 314 outpatient / 188 inpatient samples was 0.84 / 0.94 for the H 6000 and 0.84 / 0.88 for the Hematrak, respectively. The overall specificities for out-/inpatient samples were found to be 0.61 / 0.44 and 0.47 / 0.30 for the H 6000 and the Hematrak, respectively. Both Instruments had very similar screening abilities for the detection of abnormal leukocyte differential counts. However, the H 6000 flags correlated better with the Visual findings than the Hematräk flags äs demonstrated by the parameter- sensitivity and predictive value calculations and by the ROC curves.
Vergleich der Leistungsfähigkeit zweier automatischer Differentialblutbild-Zählgeräte
Zusammenfassung: Die Möglichkeit, mit dem H 6000™ und dem Hematrak 590™ von der Norm abwei- chende Differentialblutbilder zu erkennen, wurde ausgewertet. Das durch visuelle Auszählung von 100 Leukocyten ermittelte Differentialblutbild diente als Bezug. Die Optimierung der Unterscheidungsschwelle für beide Geräte durch Anwendung linearer Regressionsverfahren und Receiver Operator Characteristics (ROC)-Kurven sowie ihr Beitrag zur Leistungscharakteristik der Geräte wird diskutiert.
Die gesamte Empfindlichkeit für 314 Proben ambulanter und 188 Proben stationärer Patienten betrug 0,84 bzw. 0,94 für den H 6000™ bzw. 0*84 und 0,88 für den Hematrak 590™. Die Gesamtspezifitäten betrugen jeweils 0,61 und 0,44 für den H 6000™ bzw. 0>47 und 0,30 für den Hematrak 590™. Beide Instrumente sind für den Nachweis von der Norm abweichender Differentialblutbilder fast übereinstimmend gleich geeignet.
Die Ergebnisse des H 6000™ korrelieren besser mit den visuell ermittelten Blutbildern als die Ergebnisse des Hematrak 590™, wie durch Berechnung von Kenngrößen-Empfindlichkeit und Predictive Value sowie mit Receiver Operator öharacteristics (ROC)-Kurven gezeigt wird.
J. Clin. Chem. Clin. Biodhem. / Vol. 24,1986 / No, 7
472 Wielders et al.: Automated leukocyte differential counters
Introduction
The automation of the leukocyte differential and erythrocyte morphology is gaining more and more interest in order to cope with a growing demand. In addition, automation has the advantages of omitting the operator Variation, with an increased throughput of samples at an increased precision (l, 2, 3). Auto- mated blood cell differentiation is either based on flow cytochemical/cytometrical techniques (4, 5) or on the morphological method of pattern recognition (6, 7). Recently, plain cytometry was introduced for simplified leukocyte differentiation (8), based upon particle volume classification.
Several authors have tested the performance of leuko- cyte differential automatons, either with respect to the visual differential count or with respect to similar or other types of Instruments (l, 3, 4, 7 — 11). At present, the two major and newest representatives of the flow cytochemical and the pattern recognition approach are the H 6000 and the Hematrak 590, respectively. We compared the analytical performance and the ability of these two Instruments to screen out abnormal differential counts. Each apparatus was in füll Operation in similar hospitals and operated by its own experienced technicians. Errors due to non- acquaintance with or human bias towards a familiär Instrument, which are to be expected during a short testing period with a borrowed new automaton, are avoided by our experimental design.
Materials and Methods
The H 6000™ Automated Blood Cell Analyzer was obtained from Technicon Instruments Corp., Tarrytown, New York. The H 6000 is used at the Department of Haematology of the De Wever Hospital. The Hematrak™ Automated Differential System (Model 590) was obtained from Geometrie Data Corp., Philadelphia, Pennsylvania. The Hematrak is used at the De- partment of Haematology of the United Delft Hospitals. Both Instruments were operated in accordance with the manufac- turer's instructions and both were under regulär Service from their manufacturers. Over a period of one month 314 blood samples from outpatients and 188 blood samples from in- patients in EDTA-K2 containing tubes, were collected at the department of Haematology of the De Wever Hospital. Each sample was analysed by the H 6000 and two spin-smears were prepared by means of an Uni-Smear Spinner Coleman-90 (Perkin-Elmer Corp., Norwalk, USA) within three hours after venipunction.
After drying of the blood films, one slide was coloured by the May-Grünwald-Giemsa method and the 100 cell differential count was performed by an experienced senior technician. The other slide was fixed by methanol, send to the department of Haematology of the United Delft Hospitals and coloured by the Wright stain. This slide was processed by the Hematrak 590 using a 100 leukocyte count. The methanol treatment did not influence the slide quality or the Wright staining process.
Results
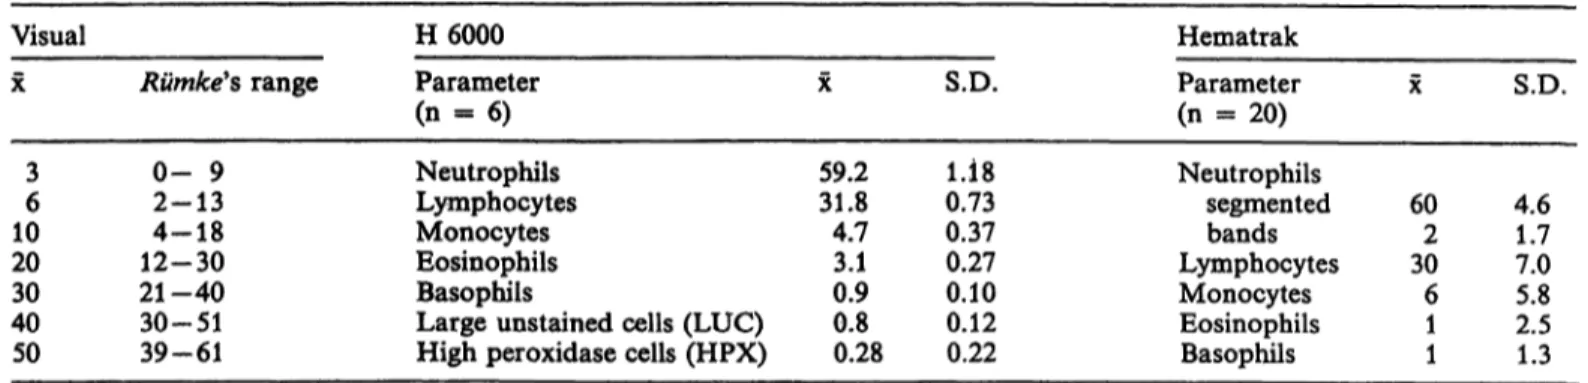
The inter-assay precision of the three methods is shown in table 1. The precision of the Instruments were calculated from multiple independent analyses of blood samples from a healthy person. Rümke (12) has derived 95% confidence intervals at several levels of the percentual differential count. These data are considered to estimate the maximal attainable preci- sion of the visual method. Rümke's calculations are based on statistical sampling theory. In practice the 95% confidence intervals fouüd for 100 cell counting by technologists may be even larger (l, 2, 7) due to technologist and slide variance contributions.
The visual differentiation, performed by the same senior technician, was considered äs a reference for the comparison of the accuracy of both Instruments.
Data triplets (H 6000, Hematrak and visual) were selected at random for neutrophils, lymphocytes, eo- sinophils and monocytes in such way that an even distribution over the class intervals of the ränge en- countered was guaranteed. The functional relation^
ships between the Hematrak or H 6000 arid the Visual differential count were calculated by orthogonal re- gression analysis.
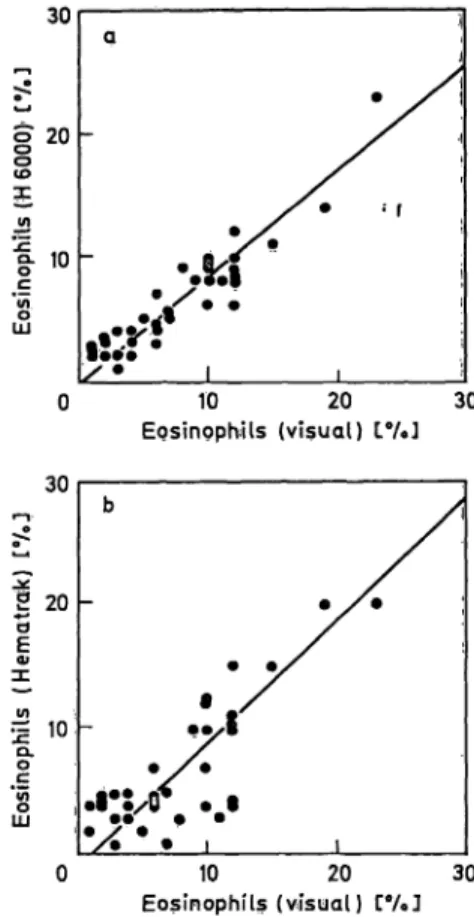
The correlation coefficients between the Instruments' results and the visual differential count are given in table 2. The mean of the differences for the results of the three methods were compared in a paired t- test. The corresponding figures are given in figures l to 4. The ränge of percentages for basophils and bands was too small for regression analysis.
Neutrophilic leukocytosis is by far the most fre- quently occufring abtiormality in the differential count (2). Lymphocytosis, eosinophilia, monocytosis and elevated counts of immature cells are encoun- tered less frequently. The usual percentual count im- plies elevated counts for lymphocytes in a case of neutrophilic leukopenia and vice versa, because of the mutual dependence of the percentual numbers.
This is an important disadvantage of the percentual count, so that it is advantageous to use absolute cell counts. Meanwhile, for our purpose the mere use of the upper values of the reference ranges was ad- equate. The reference ranges employed in the De Wever Hospital for the results of the visual count and for the H 6000 and those of the United Delft Hospitals for the Hematrak 590 were derived from unpublished studies of populations of healthy indivi- duals (blood donors). Their upper values, which will be called upper discrimination levels, are presented in table 3 äs well äs some specific parameters only applicable to either the H 6000 *or the Hematrak 590.
J. Clin. Chem. Clin. Biochem. / Vol. 24,1986 / No. 7
Wielders et al.: Automated leukocyte differential counters 473 Tab. l. Inter-assay precision of the methods used (percentual count).
Visual
X
36 1020 4030 50
R mke's r nge
0- 92-13 12-304-18 21-40 30-51 39-61
H 6000 Parameter (n = 6) Neutrophils Lymphocytes Monocytes Eosinophils Basophils
Large unstained cells (LUC) High peroxidase cells (HPX)
X
59.231.8 4.73.1 0.90.8 0.28
S.D.
0.731.18 0.370.27 0.100.12 0.22
Hematrak Parameter (n - 20) Neutrophils
segmented bands Lymphocytes Monocytes Eosinophils Basophils
X
602 306 11
S.D.
4.61.7 7.05.8 2.51.3
Tab. 2. Accuracy relative to visual differential count.
The mean of the differences (x —y), its significance in a paired t-test, the coefficients (a and b) of the orthogonal regression equation y = a + bx (y = H 6000 or Hematrak 590, χ = visual differentiation) and the correlation coefficients r are given.
Parameter
«) p > 0.05
H 6000 Hematrak
Neutrophils Lymphocytes Monocytes Eosinophils
4339 4236
<x=y)
-2.86**) 2.45*) 3.79**) 1.37m)
a 8.510.83 -0.23 -0.37
b 0.890.90 0.670.87
r 0.970.96 0.810.93
<i=y)
0.05ns) 2.90*) 1.52*) 1.22ns)
a 4.043.50 -1.151.10
b 0.920.81 0.760.99
r 0.940.90 0.640.80
*) 0.01 < p < 0.05 *) p < 0.01
100
80
60 χ
W O.
20
100
- 80 σ l 60
40
l"
20• *
20 40 60 80 100 Segments (visugl) [%]
20 40 60 '80 100 .Segments {visual) Γ°/·3
100
L. 80 o
§
» 60
l«
O.E 20
»100
o
£ 80
O
σ
| 60
| 40 υo
| 20
*# •S
f".
20 40 60 80 100 Lymphocytes (visual) t%]-O* '
0 20 40 60 80 100 Lymphocytes (visuat) Γβ/β]
Fig. 1. H 6000 neutrophils (percentual) count (a) and Hema- Fig. 2. H 6000 lymphocytes (percentual) count (a) and Hema- trak Segments (percentuail) count (b) versus the visual trak lymphocytes (percentual) count (b) versus the vis- segments count. ual lymphocytes (percentual) count.
J. Clin. Chem. Clin. Biochem. / Vol. 24,1986 / No. 7
474 Widders et al.r Automated leukocyte differential counters 30
i
2 010
30
20
(DX
10
« r
10 20 Monocytes (visual) tV.J
30 10 20 30
Eosinophils (visual) ΙβΜ 30
σ 20
"δ E
« 10
?Γο cο Σ
30
J> 20 d ω
ίο
10 20
Monocytes (visual) 30 10 20
Eosinophils (visual)
30
Fig. 3. Η 6000 monocytes (percentual) count (a) and Hematrak Fig. 4. H 6000 eosinophils (percentual) count (a) and Hema- monocytes (percentual) count (b) versus the visual mono- trak eosinophils (percentual) count (b) versus the visual cytes (percentual) count. eosinophils (percentual) count.
Tab. 3. Comparison of upper criterion levels for percentual differential counts.
Parameter
Segmented neutrophils Band neutrophils Lymphocytes Monocytes Eosinophils Basophils
Large unstained cells (LUC) High peroxidase cells (HPX) Atypical lymphocytes Immature granulocytes Blast
Erythroblast Unclassified
Visual
"De Wever"
hospital 705 5012 25
—— 00 00
—
H 6000 Employed in the hospital 70*) 50—
85 22 2.2
——
——
—
Derived from linear regression 71*) 468
—4
— .—
——
——
—
Derived fromROG curves
72*)~ 466
2.5**) _
—_
—_ _
——
Hematrak Employed in the hospital 666 5314 52
—— 42 00 2
* Derived from linear regression 68_ 4410
—4
——
^_
—=__
—
Derived fromROC 48 40**)— 10
curves
1.5**)
——
— __
__ ·
—
*) Total neutrophils.
**) By Interpolation.
We are aware of the relative imperfection of the employed Instruments' upper discrimination levels.
Both Instruments' discrimination levels were cali- brated against the upper discrimination level of the visual differential count.
In our first type of calibration, the Instruments' upper discrimination levels were calculated on the basis of the regression functions in table 2. In fact this has the effect of tuning both instruments' discrimination levels to the reference method rfiscrimination level.
J. Glitt. Chem. Clin. Biochem. / Vol. 24,1986 / No. 7
Widders et al.: Automated leukocyte differential counters 475 The result is shown in table 3 for the parameters,
neutrophils and their degree of segmentation, lym- phocytes, monocytes and eosinophils. Our second type of calibration was based on the use of Receiver Operating Characteristics (ROC) curves (13,14). For the parameters, neutrophils, lymphocytes, monocytes and eosinophils, ROC curves were calculated for a group of 100 inpatients. These curves are presented in figure 5; similar curves were obtained for outpatients.
In order to detect 95% of the abnormal samples the use of a criterion level with a sensitivity of 0.95 is demanded. Examination of figure 5 makes clear that the selection of the 0.95 sensitivity point corresponds with a rather low specificity. In practice one might want to decrease the number of false positives by the use of a lower sensitivity and higher specificity. Table 3 contains the upper discrimination levels corre- sponding with or being closest to a sensitivity of 0.90,
calculated from the ROC curves. These data were unsatisfactory for the eosinophils. In addition, for the Hematrak a non-realistic figure was obtained from the ROC curve for the upper criterion level for segmented neutrophils (see 'Discussion'). Therefore we used the upper criterion levels derived from the linear regression graphs for statistical analysis of the instruinent's performances.
A leukocyte differential count was considered to be abnormal, if any of the differential's percentages was higher than the upper discrimination level of the method used. The fraction of the visually abnormal differential counts, correctly 'flagged' abnormal by the H 6000 or Hematrak 590 was called the Instru- ments' overall sensitivity. The fraction of the visually normal differential counts, correctly not flagged by the H 6000 or Hematrak 590, was called the overall specificity of the Instrument involved.
0.5 Specificity 1.0 Γ^·
S'wO.5
7
i.o 0.5
Specificity
Specificity0.5 1.0
1.0 0.5
Specificity Fig. 5. ROC curves pf the H 6000 and the Hematrak for
neutrophils and semgments (a), A - A neutrophils H 6000
·—· segments Hematrak
·—· neutrophils Hematrak lymphocytes (b),
A - A H 6000
·—· Hematrak
monocytes (c) A - A H 6000
· — o Hematrak and eosinophils (d)
A - A H 6000
· —· Hematrak.
J. Clin. Chem. Clin; Biochem, / Vol. 24,1986 / No. 7
476 Wielders et al: Automated leukocyte differential counters Table 4 presents the overall sensitivity and specificity
data äs well äs sensitivities for individual parameters of the leukocyte differential report. The sensitivities for individual parameters were also calculated on the basis of exceeding the upper discrimination levels.
For the overall sensitivity calculations any leukocyte flag or an erythroblast flag was accepted. However, for the parameter sensitivity the abnormal samples were classified according to their prominent increased cell type and only those flags corresponding to this particular cell type were considered to be correct, äs indicated in the table. The suffix cal. in table 4 indi- cates the use of the calibrated (linear regression pro- cedure) upper discrimination levels for neutrophils, lymphocytes, monocytes and eosinophils. The suffix old indicates the use of the regulär inhouse upper discrimination levels for all kinds of cells.
The 'calibrated' overall specificities of the H 6000 and Hematrak 590 were 0.61 and 0.47 for the outpatients samples, respectively. For the inpatient group 0.44 and 0.30 were found, respectively.
The 'calibrated' overall sensitivities of the H 6000 and the Hematrak 590 were 0.84 and 0.84 for the outpatient samples, respectively. For the inpatient group an overall sensitivity of 0.94 and 0.88 was found for the H 6000 and Hematrak 590, respectively.
Except for a stat leukocyte differential count request, one does not Start with the visual differential count, but the Job is done by the automaton first. If any of the Instruments' criterion levels is exceeded, the slide has to be reviewed visually. We were therefore inter- ested in the predictive values of the criteria applied.
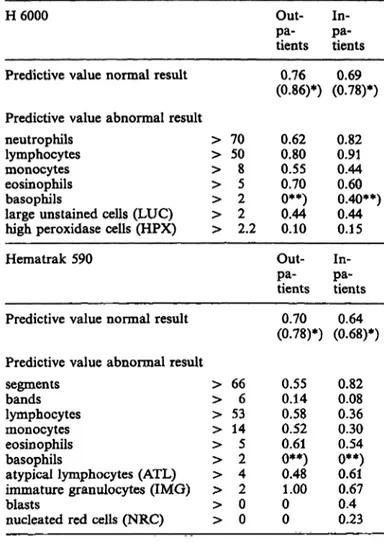
The probability that the subsequent visual differential count would reveal the same or a closely related abnormality (see tab. 4), e. g. an increased high perox- idase cell (HPX) count announcing an increased num- ber of immature neutrophils, will be called the Pre- dictive Value of an Abnormal Result (PVAR). The Predictive Values of an Abnormal Result of the indivi- dual parameters are given in table 5. The probability that a visual differential count will be normal, pro- vided the H 6000 or the Hematrak 590 do not flag any leukocyte parameter, will be called the Predictive Value of a Normal Result (PVNR). The Predictive Values of a Normal Result for the H 6000 and the Hematrak are 0.78 en 0.68 for the inpatients and 0.86 en 0.78 for the outpatients, respectively (tab. 5).
The upper criterion levels of Immature Neutrophile Granulocytes (IMG) and the closely related high peroxidase cell count (15) were summarized in table 3. A simple comparison of the response of the automatons to a group of 20 outpatients samples with
l l l l
<L
&
ol
UCG
l
•Qrak 590
B-o·
O S
«5
(5-s
EU
Leukoc
m soin oo ö ö
O 00cn oo ö ö
S Sö ö
E &
ON CS
** ^o o
O T-1
t** oo
so oo ö ö
No Flag All paramall spe all
oo so so rn ö ö ö ö
Ol OO ·* *-»
oo c-. \ -a·
ö ö ö ö
^
o o c ^ r n S o O »o © Ö Ö Ö Ö ^ ^ ' Ö Ö
Oi CO OO lf)
oo oo ^ so ö o o o
h;
• <
OQ nJ 2
t !
ON t**· ON *o <^ oo Ö Ö Ö Q - r 4 Ö ^ O
so ©^5
t> ON *- ON oo ON u^
Ö Ö Ö 0 1 1 1 1
t ^ o o r > o o o o o o oot^soso p o o o
Ö Ö Ö O • r - i ^ ' r - i Ö
l l l l ö ö ö ö
Neutr-HPX Lymph-LUC Mono -LUC Eosinophils
«T-ION^C^ r-c^soso
O O O J O C O T - I SO-r-l'CSTl·
co ^-< co co
Ä> => "g
cific sensitiv
J. Clin. Chem. Clin. Bioehem. / Vol. 24,1986 / No. 7
Wielders et al.r Automated leukocyte differential counters 477 Tab. 5. Predictive values of normal and abnormal results.
H 6000
Predictive value normal result Predictive value abnormal result neutrophils
lymphocytes monocytes eosinophils basophils
large unstained cells (LUC) high peroxidase cells (HPX) Hematrak 590
Predictive value normal result
> 70
> 50
> 8
> 5
> 2
> 2
> 2.2 Out-pa- tients (0.86)*)0.76
0.620.80 0.550.70 0**)0.44 0.10 Out-pa- tients (0.78)*)0.70
In-pa- tients (0.78)*)0.69
0.820.91 0.440.60 0.40**) 0.440.15 pa-In- tients (0.68)*)0.64 Predictive value abnormal result
Segments > 66 0.55 0.82 bands > 6 0.14 0.08 lymphocytes > 53 0.58 0.36 monocytes > 14 0.52 0.30 eosinophils > 5 0.61 0.54 basophils > 2 0**) 0**) atypical lymphocytes (ATL) > 4 0.48 0.61 immature granulocytes (IMG) > 2 1.00 0.67 blasts > 0 0 0.4 nucleated red cells (NRC) > 0 0 0.23
*) data based on recalibrated discrimination levels between brackets.
**) unreliable.
more than two immature neutrophile granulocytes in visual differential counting, is shown in table 6. The Hematrak only notified largely increased numbers of immature neutrophile granulocytes.
Table 7 summärizes those samples with remarkable discrepancies between the differentials obtained by the three methods. Most puzzling are the Hematrak flags 'increased monöcytes' for blasts or for immature granulocytes. Basophils were hardly detected by the Hematrak. Erythroblasts were frequently falsely posi- tive but sometimes also largely underestimated.
In our total number of 502 inpatient and outpatient samples, the Hematrak flagged 29 times erythroblasts (Nucleated Red Cells); 25 flags turned out to be falsely positive. Young monocytes were taken for atypical lymphocytes (ATL) by the Hematrak, äs well äs megakaryocyte nucleus fragments (tab. 7).
The reliability of leukocyte classification by the He- matrak has been studied by Urmston et al. (9).
Discussion
Although subject to a relative large statistical error the visual leukocyte differential is still the method of reference for haematologists. Therefore we defined the specificity and sensitivity of both Instruments relative to the visual differentiation, taking the latter äs the *true value'. In this set-up the number of samples erroneously classified abnormal by the visual method will cohtribute equally to a decrease of the calculated specificity of both Instruments. Any error in visual counting and in classification will have a similar positive or negative effect on the performance data of both Instruments.
Concerning precision (tab. 1), the statistical error of the Hematrak and the visual method are larger than the H 6000 error, especially for small numbers of cells: bands, monocytes, eosinophils and basophils.
This was expected from the number of cells counted by the H 6000 and the Hematrak, i. e. 10000 and 100, respectively. The coefficients of Variation calculated from table l cörrespond closely to the results of Vives Corrons et al. (3) and Izzo et al. (16) for the H 6000.
For the Hematrak our results were worse than those of Urmston et al. (9) or Dutcher et al. (7) for inter- assay coefficients of Variation.
The coefficients of correlation (tab. 2) between visual and instrumental results were slightly higher than Rosvotfs results (1) for the Hematrak. For the H 6000 our results were comparable to the data published by Izzo et al. (16).
Tab. 6. Response to immature neutrophile granulocytes (IMG) in outpatient samples.
Visual differential 17 samples 1-3 IMG
3 samples 11 < IMG < 18
Hematrak differential 13 samples
2 samples 2 samples 3 samples
0IMG1IMG 2 IMG
2 < IMG < 6
H 6000 differential 4 samples
4 samples 9 samples 3 samples
HPX*) < 1.8 1.8 <> HPX < 2.2 HPX > 2.2 3.8 < HPX < 14.3
*) HPX = 'high peroxidase cells.
J. Clin. Chem. Clin. Biochern. / Vol. 24,1986 / No. 7
478 Wielders et al.: Automated leukocyte differential counters Tab. 7. Discrepancies between flagged parameters for the different methods. Within reference ranges are given in brackets.
Visual differential H 6000 differential Hematrak differential
— 3 metamyelo-, 8 myelo- and 2 promyelocytes
— 7 metamyelo-, 5 myelocytes, 15 nucleated red cells per 100 leukocytes
— 6 metamyelo-, 10 myelo-, l promyelocyte(s), 3 basophils
— 17 monocytes, l plasmacytic lymphocyte, 18 bands
— 19 metamyelo-, 6 myelocytes, l blast, l nucleated red cell per 100 leukocytes, 10 megakaryocyte nucleus fragments per 100 leukocytes (4 monocytes)
— 2 metamyelo-, 2 myelocytes, l plasmacytic lymphocyte, 98 nucleated red cells per 100 leukocytes
— 34 monocytes (partly immature) 24 metamyelo-, 3 myelocytes, 2 blasts
(5 monocytes) 3 megakaryocyte nucleus fragments per 100 leukocytes
24 lymphocytes, 50 atypical lymphocytes (2 monocytes)
3.1 LUC*), 5.0 HPX**) 3.1 LUC, 3.9 HPX 14.3 HPX, 5.8 basophils
4.0 HPX, 2.2 LUC, 14.3 monocytes 3.5 LUC, 12.7 HPX,
(6.3 monocytes)
4.6 LUC, 6.5 HPX
27.3 monocytes, 8.4 LUC 10.6 HPX, 2.9 LUC
(6.7 monocytes) 50.2 lymphocytes, 10.6
LUC (3.9 monocytes)
3 immature granulocytes (l atypical lymphocyte)
5 atypical lymphocytes (2 immature granulocytes), 4 nucleated red cells 5 immature granulocytes (l basophil) 34 monocytes, 14 bands
11 atypical lymphocytes, 23 monocytes,
(2 immature granulocytes) 6 atypical lymphocytes, 7 immature
granulocytes, 15 nucleated red cells 19 monocytes, 11 atypical lymphocytes
(young monoblasts after review) 21 monocytes (5 after review), 2
immature granulocytes (15 after review)
(36 lymphocytes) 15 monocytes, 15 atypical lymphocytes
*) LUC = large unstained cells.
**) HPX = high peroxidase cells.
A moderate specificity for the outpatients and an even lower specificity for the inpatients both for the H 6000 and the Hematrak were found (tab. 4). In general, the sensitivity for a small number of atypical cells is better for Instruments, especially if a large number of cells is evaluated (10,17,18). The decrease in specificity upon recalibration of the 'main para- meters' of the differential was expected. The 'main Parameters', neutrophils, lymphocytes, monocytes and eosinophils delivered by far the majority of ab- normal differentials äs can be seen from the table.
Usually, optimization of sensitivity leads to a loss of specificity and a decreased Predictive Value of an Abnormal Result and vice versa. For some patient samples, both Instruments reported an abnormal re- sult, while the visual count was normal. As pointed out before, the visual count might have been in error and in this case the sensitivity of both Instruments might be underestimated, but then the data from both Instruments would be misjudged equally.
The overall sensitivity of the H 6000 is only slightly higher than that of the Hematrak. This implies that both Instruments are almost equally well suited for screening abnormal leukocyte differentials, if any flag urges to a visual differential count of the sample. The
Parameter sensitivities of the H 6000 were higher than those of the Hematrak both before and after calibra- tion of the main parameter upper discrimination levels. This was hardly expected since the Hematrak Operation principle is much closer to the classical visual method than the cytochemistry/cytometry used by the H 6000. Thus, although both Instruments have a similar ability to recognise an abnormal leukocyte differential, the H 6000 flags have a higher correlation than the Hematrak flags with the visually found de- viation.
The predictive values presented in table 5 give an impression of the usefullness of a particular fläg for the subsequent visual differential and the reliability of the 4no flag at all' report. In other words, the predictive values are an estimation of the efficieiicy of the instrument's use äs a screening device. The Predictive Value of a Normal Result data of the H 6000 both before and after recalibration are better than those of the Hematrak. the parameter Predict- ive Value of an Abnormal Result datajhardly changed when recalibrated discrimination levels were used, except for the monocyte Predictive Value of an Ab- normal Result of the Hematrak, which decreased from 0.52/0.30 to 0.25/0.20 for.out-/-inpatients, re-
spectively. v ?
J. Clin. Chem. Clin. Biqchem. / Vol. 24,1986 / No. 7
Wielders et al: Automated leukocyte differential counters 479
The use of rather low values for the H 6000 high peroxidase cell count and large unstained cell count Parameters leads to a high parameter sensitivity but on the other side to a low specificity, äs can be seen from the Predictive Value of an Abnormal Result data in table 5.
The unrealistic low Predictive Value of an Abnormal Result for bands seen by the Hematrak are attributed to the occurrence of badly fixed spin slides and acci- dental problems in the Wright staining procedure.
For a number of samples part of the segmented neutrophils had broadened nuclei and appeared äs bands. Visual reexamination of these particular sam- ples revealed this problem. Difficulties in Hematrak discrimination between band and segmented neutro- phils with 2 or 3 lobes or with toxic granulation have been reported by Urmston et al. (9). This group suggests the joining of bands and Segments into a Hematrak 'neutrophils' group in preference to sepa- rate reporting. Rosvoll et al. (1) suggest a similar approach because of human bias in discriminating Segments and bands.
The comparison of two different Instruments, each with its own reference values, must lead unexception- ally to a discussion of the usefullness of the specificity and sensitivity data. For, however it may be, speci- ficity and sensitivity are dependent on the variability of the diagnostic criterion level that separates the normal and abnormal results (13).
ROC curves present a special way of selecting appro- priate instrumental upper discrimination levels. By gradually changing a diagnostic criterion level from high to low (e. g. for the H 6000, total neutrophil percentage from 85 to 62) the sensitivity of a method (or Instrument or human observer) increases from a very small number up to 1.00. Meanwhile the speci- ficity decreases from 1.00 to a small number. ROC curves present the changing specificity and sensitivity numbers upon varying the diagnostic criterion level over a wide ränge (13,14).
Upper discrimination levels based on the 0.90 sensi- tivity points of both Instruments' ROC curves were calculated (tab. 3). However, unsatisfactorily low levels corresponding to a low specificity were ob- tained for the eosinophils, due to the large scatter in these low percentages. As can be seen in table 3, the upper discrimination levels for neutrophils, lym- phocytes and monocytes would be very useful, except for the segment level calculated for the Hematrak.
This number became inferior because of the large scatter in the number of bands encountered and the confusion with segments. We did not therefore use the set of upper discrimination levels from the ROC curves äs a whole.
ROC curves visualise the detectability of abnormality.
The best method is that, in which the curve most closely approaches the ideal Situation of specificity 1.0 and sensitivity 1.0. From figure 5 the detectability for neutrophils, lymphocytes, eosinophils and mono- cytes was found to be better for the H 6000 in compa- rison with the Hematrak. In fact, these ROC curves represent a more general and visual expression of the correlation between an instrumental method and the visual method, äs far äs an individual leukocyte cell type is concerned. For the comparison with the H 6000 neutrophil curve (fig. 5 a), both the Hematrak Segments curve äs well äs the Hematrak neutrophils curve (segments plus bands plus immature granulocy- tes) were calculated. This was done for both theoret- ical and practical reasons, i. e. the problem of the appearance of segments äs bands. The detection of a particular cell ist dependent on the number of cells examined and the incidence and the recognition accu- racy (7 — III); an increase in the number of cells counted would improve the Hematrak characteristics.
Morphological examination whether computerised or visual will probably never be able to deal with the numbers of cells counted by flow cytometry/cytoche- mistry.
The detection of immature granulocytes by the He- matrak was unsatisfactory. This is shown in tables 6 and 7. A small number of immature granulocytes in the visual count (1 — 3 percent) was generally not detected at all (13 out of 17) or the Hematrak count was within the Hematrak's reference ränge (4 out of 17). The H 6000 classified 9 out of 17 samples cor- rectly abnormal by the high peroxidase cell count parameter and 4 out of 17 samples were near the borderline. Highly increased numbers of immature granulocytes in the visual count did not always corre- spond with a Hematrak immature granulocyte count exceeding the upper discrimination level (see tab. 7).
The H 6000 response by the high peroxidase cell count parameter was always adequate for these cases.
Due to the small number of samples in this study with a slightly elevated basophil count, the sensitivity data for basophils are hardly reliable for both Instru- ments. As can be seen from table 5, a basophil flag from the H 6000 has a higher predictive value than a similar flag from the Hematrak. This is probably due to the larger number of leukocytes counted by the H 6000, also underscoring or erroneously scoring of basophils by the Hematrak has been described (9,11).
The monocyte flag of the Hematrak corresponded only in 52% and 30% of cases (outpatients and inpatients, respectively) with an increased monocyte count in the visual differential (tab. 5). Lymphocytes,
J. Clin. Chem. Clin. Biochem. / Vol. 24,1986 / No. 7
480 Wielders et al.: Automated leukocyte differential counters
atypical lymphocytes, immature granulocytes or me- gakaryocytic nucleus fragments could be counted äs monocytes by the Hematrak. This is illustrated by an inspection of table 7. As a consequence, a high percentage of monocytes from the Hematrak is al- ways suspect and should be checked visually. It should be kept in mind that a technologist's review of an abnormal slide is easily done by the Hematrak operator, because part of the Hematrak operating procedures is reviewing suspect or unclassified cells, which are automatically presented by the Instrument.
For the H 6000, which performs a haematological analytical Programme exceeding the leukocyte dif- ferential, it is advisable to prepare stained slides of all blood samples analysed, which are then visually examined if abnormality is detected by the instru- ment.
The Hematrak flag nucleated red cells (NRC) is usu- ally a false alarm, due to stain precipitates on the slides. Howeyer, occasionally lymphocytes were no- minated nucleated red cells. The Predictive Value of
an Abnormal Result of the nucleated red cells flag for the total of in- and outpatients (50 samples flagged) was only 0.04. Of the nucleated red cells flagged samples 55% were visually abnormal, which only proves that false nucleated red cells flags have a higher incidence in pathological samples.
In coticlusion, both Instruments have very similar screening abilities for detecting abnormal leukocyte differential counts, but the H 6000 overall specificity is somewhat higher thati the Hematrak overall speci- ficity. In addition the H 6000 results for the individual leukocyte cell types are more reliable than those of the Hematrak.
Acknowledgement
The use of ROC curves was suggested by C. P. Degenaar, clinical chemist. The technicäl assistähce of Mrs. M.^J. Rosier and Mrs. /. Rothengatter is gratefully acknowledged. Secretarial aspects were handled by Mrs. Th. Ernes-Vandenbooren.
References
1. Rosvoll, R. V., Mengason, A. R, Smith, L., Patel, H. J., Maynard, J. & Connor, R (1979) Am. J. Clin. Pathol. 71, 695-703.
2. England, J. M. (1979) Clin. Lab. Haemat. /, 263-273.
3. Vives Corrons, J. L., Jou, J. M., Insa, M. J. & Aguilar i Bascompte, J. L. (1983) In: Innovative technology in auto- mated haematology for improved patientcare (Reicher, V. &
Barclay, J. E., eds.). Garges-les-Gonesse (France): Techn- icon International Division, pp. 19 — 32.
4. Mansberg, H. R, Saunders, A. M. & Groner, W. (1974) J.
Histochem. Cytochem. 22, 711-724.
5. ROSS, D. W. & Bardwell, A. (1980) Blood Cells 6,455-470.
6. Preston, K. (1980) Analytical and Quantitative Cytology 2, 1-14.
7. Dutcher, T. R, Benzel, J. E., Egan, J. J., Hart, D. J. &
Christopher, E. A. (1974) Am. J. Clin. Pathol. 62, 525-529, 530-536, 537-544.
8. Nelson, L., Charache, S., Keyser, E. & Metzger, R (1985) Am. J. Clin. Pathol. 83, 547-554.
9. Urmston, A., Hyde, K., Gowenlock, A. H. & Maclver, J. F. (1980) Clin. Lab. Haemat. 2, 199-214.
10. Rock, W. A., Miale, J. B. & Johnson, W. D. (1984) Am.
J. Clin. Pathol. 81, 233-236.
11. Bain, B. J., Neill, P. J., Scott, D., Scott, T. J. & Innis, M.
D. (1980) Pathology 12, 83-100, 101-109.
12. Rümke, C. L. (1960) Triangle 4, 154-158.
13. Turner, D. A. (1978) J. Nucl. Med. 19, 213-220.
14. Robertson, E. A. & Zweig, M. H. (1981) Clin. Chem. 27, 1569-1574. , ;>
15. Saunders, A. M. (1976) Technicon International Collo^
quium "Automation in Haematology" Paris 1976, pp.
120-134.
16. Izzo, C., Pasqualini, A. & Ferrari, A. M. (1982) Evaluation of the Technicon H 6000 System in a private läbof atory.
Technicon International Colloquium 'Innovate technology in automated Haematology for improved patient care'.
Oxford 1982, pp. 5-13.
17. ROSS, D. W. (1984) Am. J. Clin. Pathol. 82, 508 (Letter to the Editor).
18. Easton, F. R. C. P. (1984) Am. J. Clin. Pathol. 82, 507 (Letter to the Editor).
Dr. J. R M. Wieners
Department of Clinical Chemistry Üniversity Hospital Maastricht P.O. Box 1918
NL-6201 BX Maastricht
J. Clin. Chem. Clin. Biochem, / Vol. 24,1986 / No. 7