Investigation of the Stratospheric
Inorganic Bromine Budget for 1996-2000:
Balloon-Borne Measurements and Model Comparisons
Dissertation von
Richard Fitzenberger
Heidelberg, September 2000
zur
Erlangung der Doktorwürde
der
Naturwissenschaftlich Mathematischen
Gesamtfakultät
der
Ruprecht Karls Universität
Heidelberg
vorgelegtvon
Dipl.-Phys. Richard Fitzenberger
aus Friedberg(Hessen)
Tagder mündlichen Prüfung: 8.November2000
Bromine Budget for 1996-2000: Balloon-Borne
Measurements and Model Comparisons
Gutachter: Prof. Dr. UlrichPlatt
Prof. Dr. Konrad Mauersberger
submitted tothe
Combined Faculties for the Natural Sciences and for Mathematics
of the
Rupertus Carola University of
Heidelberg, Germany
for the degreeof
Doctor of Natural Sciences
Investigation of the Stratospheric Inorganic Bromine Budget for 1996-2000:
Balloon-Borne Measurements and Model Comparisons
presented by
Diplom-Physicist: Richard Fitzenberger
born in: Friedberg(Hessen)
Heidelberg, 8.November2000
Referees: Prof. Dr. UlrichPlatt
Prof. Dr. KonradMauersberger
AnorganischeBromverbindungenspieleneinebedeutendeRolleinkatalytischenOzonabbauzyklenderStratosphäre.Im
Rahmen dieserDoktorarbeit wurdenballongetragene DOAS (Dierentielle Optische AbsorptionsSpektroskopie)BrO
VertikalprolmessungenmittelsdirektenSonnenlichtsmitbishernichterreichterGenauigkeit(12%)durchgeführt.Die
spektroskopischenMessungenfandenwährendachterfolgreicherFlügemitdergemeinsamendeutsch-französischenNutz-
lastLPMA/DOASuntersehrverschiedenengeophysikalischenBedingungenindenJahren1996-2000statt. Dabeiergaben
sich völlig neue Einblicke indie Chemie und das Budgetdes stratosphärischen Broms. Dieneuartigen Erkenntnisse
umfassen(1)einegenaueundvollständigeErfassungdesstratosphärischenBromgehaltesderletztenvierJahre,(2)ein
verbessertesVerständnisderChemiedesstratosphärischenanorganischenBroms,und(3)denerstmaligenNachweisund
dieMessungvonHöhenprolenderBrOKonzentrationinderfreienTroposphäre. MitHilfederBrOMessungenkonnte
derstratosphärischeGehaltananorganischemBromzu Br in
y
=(21.53)pptin5.6 Jahre alterLuftfür1999 bestimmt
werden. Hingegen zeigt die erstmalige gleichzeitige Bestimmung des stratosphärischen Bromgehaltes aus Messungen
organischerBromverbindungennurBr org
y
=(18.41.8)ppt.DieÜbereinstimmungdesGesamtbrommischungsverhältnis-
sesistbefriedigend,jedochdeutetdaskonsistentgröÿereBr in
y
daraufhin,daÿvermutlichanorganischesBrom(3.13.5
ppt)ausder TroposphäreindieStratosphäreeingetragen wird. DieseVermutungwirddurchdenBefund (3)undden
kürzlicherfolgten Nachweisvonim AerosolderoberenTroposphäregebundenem, anorganischemBromvonetwa1ppt
qualitativgestützt.
AlsweitererTeilderArbeitwurdeeinAlgorithmuszurAuswertungdervomBallonausgemessenenSonnenspektrenfür
denNachweisvonChlordioxid(OCl O)neuentwickelt. OCl OkonnteinallenarktischenWinterügenauchbeigeringer
Chloraktivierungdetektiertwerden. ÜberraschenderweisewurdeOCl OauchwährendeinesBallonugesüberSpanienim
Herbst1996nachgewiesen(5-10pptin20-30kmHöhebeieinemSonnenzenitwinkelvon88-93 o
). ZurInterpretationder
erhöhtenOCl OWertewurdenErgebnissedes3-DCTMModellsSLIMCATunddesdafüreigensentwickeltenLagrange
BoxmodellsLABMOSmitdenMessungenverglichen. Dabeistelltesichheraus,daÿsichdiearktischenOCl OMessungen
imWintergutverstehenlassen,währenddieinmittlerenBreitengemessenenOCl OKonzentrationendeutlichhöhersind
alsmitderbisherigenTheoriederstratosphärischenChemieerklärtwerdenkann.
Summary
Inorganicbromineplaysanimportantroleincatalyticozonedepletioninthestratosphereathighandmid-latitudes. This
studyreports anddiscussesindetailstratosphericDOAS(DierentialOptical AbsorptionSpectroscopy)BrO vertical
prolemeasurementswithdirectsunlight,that wereconductedaboardthe french-germanLPMA/DOAS(Laboratoire
dePhysiqueMoléculaire etApplication)balloongondolaatmid andhigh northernlatitudes duringthe years1996 to
2000. Theunprecedentedhigh accuracy(12%) of the BrO measurements togetherwith 3-D CTM and Lagrangian
photochemicalmodellingprovidednewinsightsintothebudgetandchemistryofatmosphericbromine.Theseinclude(1)
athoroughinvestigationofthepresentandrecentbudgetofstratosphericbromine,(2)animprovedunderstandingofthe
chemistryofstratosphericbromine,and(3)therstmeasurementsoffreetroposphericBrOconcentrationproles. The
totalinorganicbromine(in5.6yearoldairin1999)determinedfromBrOmeasurements(Br in
y
=(21.53)ppt)wastested
forthersttimeagainstthetotalstratosphericbromineinferredfromtheorganicbrominemethod(Br org
y
=(18.41.8)
ppt). Theagreementoftotalbrominefoundwithbothmethodsisgood,however,theconsistentlylargerBr in
y
suggests
an inux(3.13.5 ppt) of inorganic bromine from the troposphere. This conclusion is supportedby nding(3) and
qualitativelyby therecentdetectionofinorganicbromineata1pptlevelintheuppertroposphericaerosol. Thusthis
thesiscouldestablishamorecompletebudgetofstratosphericbromine.
Also,anewDOASretrievalalgorithmwasdevelopedforthedetectionofchlorinedioxide(OCl O)intheballoon-borne
directsunspectra. Inall Arcticwinter ightsOCl Ocould bedetected-evenat lowchlorine activation. Surprisingly,
OCl Ocould alsobemeasuredinsignicant amounts(5-10pptat20-30 kmandasolar zenithangle(SZA) of88-93 o
)
duringa fall1996 mid-latitudeballoonight. TheOCl O measurementswereintercomparedwithresults from a3-D
CTM (SLIMCAT)and a Lagrangian trajectory boxmodel(LABMOS),which was implemented for thispurpose as a
partofthisstudy. WhiletheOCl Odetectedathighlatitudesduringwintercorrespondswelltothemodelpredictions,
1 Introduction 1
2 Halogen species and their importance in atmospheric chemistry 5
2.1 StratosphericOzone . . . 5
2.2 TroposphericOzone . . . 7
2.3 Stratosphericgas phasechemistry relatedto ozone . . . 9
2.3.1 Chapman Chemistry . . . 9
2.3.2 Catalytic Cycles . . . 10
2.3.3 Nitrogenchemistryin thestratosphere . . . 11
2.3.4 Halogen chemistry inthestratosphere . . . 13
2.4 Heterogeneous chemistryon PSCs leadingto theOzone Hole . . . 17
2.4.1 Heterogeneous chemistryon sulphateaerosols . . . 22
2.5 Fundamental Stratospheric Dynamics. . . 24
2.6 Theatmospheric halogenbudget . . . 27
3 MeasurementTechnique: DirectSunlight BalloonBorne DOAS(DierentialOpti- cal Absorption Spectroscopy) 33 3.1 Solar RadiationandtheSolar Spectrum . . . 33
3.1.1 Interaction of light withmatter . . . 33
3.1.2 Lambert-Beer's Law - OpticalAbsorption Spectroscopy . . . 35
3.2 Dierential OpticalAbsorption Spectroscopy(DOAS) . . . 37
3.3 TheDOAS doublespectrographfor balloon-bornemeasurements . . . 38
3.3.1 Noisesourcesof the measurements . . . 42
3.4 TheLPMA/DOAS balloonpayload . . . 43
3.4.1 The behaviour of the DOAS spectrograph during the balloon ights and its impacton the BrO evaluation . . . 46
3.4.2 TheBrO DOAS evaluation . . . 50
3.4.3 TheOClO DOAS evaluation . . . 55
3.5 Determination of the SCDosetintheFraunhofer reference- LangleyPlot . . . 55
3.6 Summary oftheerror sourcesof thebromineoxide SCD measurements . . . 58
3.7 Prole Retrieval. . . 58
3.7.1 Raytracing . . . 59
3.7.2 AMFmatrix inversion . . . 59
3.7.3 Errors of theinversion technique . . . 61
3.7.4 Dierential Onion Peelingtechnique . . . 61
3.8 Modelling ofSCDs . . . 62
4 Results and Discussion of the LPMA/DOAS balloon ights 65
4.1 Thesunset ight at León on November23,1996 . . . 65
4.1.1 BrO prole and SCD modelcomparison . . . 72
4.1.2 OClO proleand SCDmodelcomparison . . . 75
4.2 The sunsetight at Kiruna onFebruary 14,1997 . . . 80
4.2.1 BrO prole and SCD modelcomparison . . . 81
4.2.2 OClO prolemodel comparison. . . 87
4.2.3 O 3 prole modelcomparison. . . 93
4.2.4 NO 2 prole modelcomparison . . . 94
4.2.5 Summary ofthe model comparison . . . 95
4.3 The sunriseight at Gapon June 20,1997 . . . 95
4.3.1 BrO prole and SCD modelcomparison . . . 97
4.4 The sunsetight at León on March 19,1998 . . . 100
4.4.1 BrO prole and VCDcomparison withGOME . . . 105
4.5 The sunsetand sunriseight atKiruna onAugust 19/20,1998 . . . 109
4.5.1 BrO prole and SCD modelcomparison for the sunset . . . 112
4.5.2 BrO SCD model comparisonfor thesunrise . . . 121
4.6 The sunsetight at Kiruna onFebruary 10,1999 . . . 121
4.6.1 BrO prole and SCD modelcomparison . . . 124
4.6.2 OClO proleand SCDmodelcomparison . . . 133
4.7 The sunriseight at Gapon June 25,1999 . . . 137
4.8 The sunsetight at Kiruna onFebruary 18,2000 . . . 141
4.8.1 BrO prole and SCD modelcomparison . . . 144
4.8.2 OClO proleand SCDmodelcomparison . . . 149
4.9 Summary ofBrO measurementsduring theeight LPMA/DOAS balloonights . . . . 155
4.9.1 BrO prole measurements . . . 155
4.9.2 BrO VCD comparisonswithsatellite and ground-basedinstruments . . . 156
5 The rst measurement of a BrO prole in the free troposphere 159 5.1 Methodology and Measurements . . . 160
5.2 Discussion ofthefreetroposphericBrO measurements . . . 163
6 Comparison of the inorganic and organic bromine budget for the Arctic lower stratosphere in winter 1998/1999 167 6.1 Methodology of thecomparison . . . 168
6.2 Discussion ofthe comparison . . . 169
6.3 A recent history oftotal organic and inorganicstratospheric bromine . . . 173
7 Lagrangian case studies for the interpretation of enhanced OClO measurementsat mid and high latitudes 175 7.1 The Lagrangian trajectory boxmodelLABMOS. . . 175
7.2 Case study ofthe in-vortex ight at KirunaonFebruary10,1999 . . . 177
7.3 Case study ofthe out-of-vortexight at León on November 23, 1996 . . . 187
8 Conclusions and Outlook 197 A Appendix i A.1 Meteorological Denitions . . . i
A.2 Potential Temperature . . . i
A.3 Ertlspotential vorticity . . . i
v CONTENTS
B Chemical Reaction Rate Constants iii
B.1 Bimolecular Gas PhaseReactions . . . iii
B.2 Trimolecular Gas PhaseReactions . . . v
B.3 Photochemical reactions . . . vii
B.4 Heterogeneous reactions . . . viii
B.5 Concentration change because of changing volume alongthetrajectory . . . ix
Bibliography xi
C Danksagung xxi
Introduction
Thechemicalcompositionanddynamicsof theatmosphere arevital forhuman,animal, andplant life
onEarth. Onaglobal scale,thesystematmosphere-biosphere-oceanisinanequilibriumsteady-state,
where small short-term variations of the climate and the chemical composition of the dierent
compartmentsaresmoothedbythe relativelylongtransportprocessesandthereforegenerallyofsmall
amplitude.
Sincethebeginningofindustrialisationmankindhasreleasedlargeamountsofgasesintotheatmo-
sphereandinuencedtherebythe naturalcyclesofmaterial transportbetweenthedierentreservoirs.
Oneofthemost importantexamplesofthisinuencewasthediscovery oftheAntarcticozoneholeby
Farmanetal. [1985],wherenowadaysatsomealtitudelevelsupto100%ofthestratosphericozonecan
bedepleted withinafew weekssimultaneously reducing thetotal column ofozonebymore than70%.
This observation was not expected and provoked a lot of concern among scientists and politicians,
because the stratospheric ozone layer is protecting life on Earth against harmful UV radiation 1
.
Research on this phenomenon led to the installation of a series of international political agreements
onthebanofozonedepletingspeciesliketheCFCs,halonsandhalogenatedhydrocarbons[WMO1998].
Concern that some halogenated hydrocarbons may destroy ozone in the upper atmosphere was
rst raised inthe 1970s [Molina and Rowland 1974; Stolarski and Cicerone 1974] predicting a global
ozone reduction of 10-20% during the next 50-100 years. Acknowledging the realisation that these
man-madechemicals arethreateningtheozonelayer,the Vienna Conventionfor theProtection ofthe
Ozone layerwasadopted by28 countries in1985. This committedsignatories to a general obligation
to take appropriateactionsto protecttheozonelayerandto co-operate onresearch. Shortlyafterthe
Vienna meeting, the ozone holeovertheAntarctic wasdiscovered, reinforcing the pressureto control
potential ozonedepleting substances. In 1987,the Montreal Protocolon Substancesthat Depletethe
Ozone Layer was agreed and has since been ratied by over 160 countries. Initially, the Protocol
imposed clear limits on the future production of CFCs and halons only and committed Parties to
cutting down production by50% bythe year2000. There were several amendments to the Montreal
Protocol (London, 1990; Copenhagen, 1992; Montreal, 1997) thus strengthening the control of ozone
depleting substances. The phase-out of substances already regulated was accelerated, and other
chemicals found to causeozone depletionwere included, i.e. carbon tetrachloride, methylchloroform,
HCFCs andmethyl bromide(CH
3 Br).
Because of the long lifetime of CFCs and halons ('organic' F, Cl and Br) in the atmosphere,
these species can reach the stratosphere where they are photolysed by sunlight (or attacked by
1
UV-A:320 400nm(biologicallyrelativelyuncritical),UV-B:290 320nm(biologicallycritical),UV-C:290nm
(biologicallyextremely critical). Thebasicbiological moleculeDNAismost sensitive toUV-Cradiation meaningthat
chemical radicals like OH or O), thereby setting free active 2
chlorine and bromine, which reacts
nearly instantaneously with ozone. While the political actions taken world-wide do already show a
decrease ofthechlorineloading of thelower atmosphere [WMO1998], thebromine containing halons
are still increasing. As bromine and chlorine chemistry inthe stratosphere are coupled together, the
impact of bromineon the ozone budgetis largest, where chlorineis activated- like intheArctic and
Antarctic winter. There have been a series of intensive measurement eld campaigns during the last
10 yearsalsostudyingthe Arcticozonelayerandthe occurrenceof anArcticozonehole(e.g. EASOE,
SESAME,THESEO, THESEO2000-EuroSolve) 3
,whichwasobserved during3-5oftheArcticwinters
inthe1990s [Goutailetal. 2000].
Althoughtheabundance ofactive bromine isabout 200 times lessthan theone ofactive chlorine,
the eciency of the bromine related catalytic cycles can be as high as the eciency of the chlorine
cycles. This is due to the lower stability of the bromine reservoir species in comparison with the
chlorine reservoir species. During daytime inorganic stratospheric bromine is mainly present in
the form of BrO, so that the balloon-borne DOAS 4
measurement of BrO is an ecient method
to investigate the inorganic bromine budget of the stratosphere. Using model studies to predict
the behaviour of the measured species during the time of the measurements allows to derive the
total amount of inorganic bromine [Fitzenberger et al. 2000; Fitzenberger et al. 2000; Harder
et al. 2000; Pfeilsticker et al. 2000]. Thus the eight LPMA/DOAS 5
balloon ights conducted
between 1996 and 2000 provide the unique possibility to measure total inorganic bromine (Br in
y )
directlyandcompareittotheincreaseoforganicprecursorsinthetroposphereandlower stratosphere.
There aredierent methods to measureBrO inthestratosphere. Thein-situ chemical conversion
resonance-uorescence instruments measure BrO indirectly within a certain air sample, while the
remote sensing DOAS instruments (Zenith Scattered Light (ZSL) [Platt et al. 1997], directsunlight
DOAS from ground, satellite or balloon platform [Ferlemann et al. 2000]) directly measure the
absorptionbandsintheUVpartinthesunlightassociatedtoBrO. Thein-situresonance-uorescence
technique performs well only in the stratosphere, while under certain conditions direct sunlight and
scattered light DOAS can be sensitive to the troposphere and lower stratosphere [Friess et al. 1999;
Fitzenberger et al. 2000; Fitzenberger et al. 2000]. The remotesensing instruments using zenith-sky
or other scattered sunlight apply the same absorption technique as balloon-borne direct sunlight
DOAS, but suer from a more complicated radiative transport in the atmosphere, which has to be
well known to retrieve the vertical distribution of the measured species. Therefore balloon-borne
DOASwithdirectsunlight allows to measureaccuratelytheprolesofchemical speciesandbySCD 6
comparison it isalsopossible tocheckits photochemical variation.
The chemical speciesOClO is an indicator for chlorineactivation as it is believed to be predom-
inantly produced by the reaction of ClO and BrO in the stratosphere. During the measurements
presentedinthis thesisitcouldbe detectedintheArcticwinter aswell asatmid-latitudesinautumn
under undisturbed conditions. Nevertheless, it was only possible to predict the activation seen in
the Arctic by the models used in this thesis - the 3-D Chemical Transport Model(CTM) SLIMCAT
[Chippereld1999], which iswellestablishedinthe scienticcommunity,and aLagrangianboxmodel
2
Theshort-livedchlorinespecies,whichreactveryfast,arecalledactivechlorine(Cl Ox=Cl O+Cl+2Cl2O2). For
brominethesamecharacterizationisused(BrO
x
=Br+BrO).
3
EASOE:EuropeanArcticStratosphericOzoneExperiment,SESAME:SecondEuropeanStratosphericArcticand
Mid-latitudeExperiment,THESEO:THirdEuropeanStratosphericExperimentonOzone, THESEO2000-EuroSolve:
asTHESEObutwithintheUSledSOLVE(SAGEIIIOzoneLossandValidationExperiment)campaign
4
DOAS:DierentialOptical AbsorptionSpectroscopy
5
The LPMA/DOAS balloon payload is a French-German collaboration between LPMA/Paris (Laboratoire de
PhysiqueMoléculaireetApplication)andtheIUP/Heidelberg(InstitutfürUmweltphysik).
6
3
onisentropic trajectories (LABMOS)especiallyimplementedasapartofthisthesis. Themid-latitude
measurements cannotbe explained with the standard gas phaseand heterogeneous chemistry usedin
bothmodels.
Chapter 2 gives an overviewabout thechemistry of thestratosphere and especiallyhighlight the
importanceofhalogensintheatmosphere. Chapter3proceedswithadescriptionofthedirectsunlight
balloon-borne DOAS measurement technique which was used to retrieve the concentrations of the
chemical speciesof interest inthis thesis. Thenan overviewof the results of the eight LPMA/DOAS
balloon ights conducted sofar is presented inchapter 4. Chapter5 covers the additional results of
rstfreetroposphericBrOprolemeasurementswhichwerestimulatedbythecombination ofdierent
measurementplatforms(balloon,satellite,andground-based). Inchapter6,therstcomparisonofthe
total inorganic bromine method withthe standard organic bromine method isshown. Then, chapter
7 outlines two case studiesmade to understand theobservation of enhancedOClO amounts. Finally
thethesisconcludes withanoutlookinchapter8.
Halogen species and their importance in
atmospheric chemistry
Stratospheric ozonedepletion throughcatalytic chemistry involving man-made chlorouorocarbons is
an area of focus in the study of geophysics and one of the global environmental issues of the twen-
tieth and twenty-rst century. It has been shown by several theoretical and experimental studies
that catalytic cycles involving oxygen, hydrogen, nitrogen and last but not least halogens can aect
fundamentally the abundance ofozoneinthe stratosphere, aswell asinthe troposphere.
2.1 Stratospheric Ozone
Although it was already proposed in 1974 that stratospheric ozone could be depleted in chemical
reactions involvingthedegradationproductsofchlorouorocarbons(CFCs), itwasnotuntil1985 that
unequivocalevidenceofozonelosswasreportedinthescienticliterature. Inthatyear,scientistsfrom
theBritishAntarctic Survey [Farman et al. 1985] described thepolar ozonedepletion, now knownas
theozonehole, inwhichduringsixweeksinthespring thetotal ozonecolumn decreasesbymorethan
half. It was subsequently shown that in thelower stratosphere almost all the ozone is removed from
a layer at altitudes between about 13 and 20 km. Theseobservations attracted great public interest,
and aroused considerable scientic debate. At that time, photochemical theory had predicted ozone
loss in the upper stratosphere by catalytic cycles involving the chlorine monoxide radical(ClO) and
oxygenatoms. AstheAntarcticozonelossoccursinthelower stratosphere, itcannotbeexplained by
thatmechanism.
The unique role of ozone in absorbing certain wavelengths of incoming solar ultraviolet light was
recognized in the latter part of the nineteenth century byCornu [1879] and Hartley [1880]. Interest
in ozonestems from the fact thatsuch absorption of solar radiation is important indetermining not
onlythethermalstructureofthe stratospherebutalsotheecologicalframeworkforlifeon theEarth's
surface. Decreased ozone results inincreased ultraviolet transmission, which can aect thehealth of
humans, animals,and plants.
Observations of the total integrated column ozone based on ultraviolet absorption began in the
rst few decades of the twentieth century [Fabry and Buisson 1913; Dobson 1968]. Systematic
measurements of this type have revealed that the total abundances over many regions of the globe
have decreased markedly since about 1980, asis illustrated inthe data presented in Figure 2.1 - the
total integratedozonecolumn is given generallyinDobson 1
units (DU).
Downward trends are evident in the time series of spatially or time-averaged spring column ozone
1
Dobsonunit(DU)isthecommonunitforexpressingthetotalvertical columncontentofozoneintheatmosphere.
1cmcolumn ofozoneat standard conditions (1013mbar,273.15 K)correspondsto 1000 DU.Thetypicaltotal ozone
observations shown in Figure 1. Ozone varies from year to year at all locations, but the behaviour
seen inrecent decades inAntarctic spring liesvery far outsideofthehistorical variability.
1920 1930 1940 1950 1960 1970 1980 1990 2000 150
200 250 300 350 400 450
1920 1930 1940 1950 1960 1970 1980 1990 2000
150 200 250 300 350 400
Arctic 63-90 0 N, March Average 450
Northern Mid-Latitudes March, Arosa Halley, Antarctica, October Average
Tot al Ozone [ D U ]
Year
Figure2.1: Observationsoftotalozoneatvariouslocations anditstrends. TheArcticdatafromsatelliteobservations
[Newmanetal. 1997] displaytheMarchaveragetotalozone,whiletheAntarcticdatafromHalley[Farman
etal. 1985] showthe Octoberaverage total ozone. Thedata fromArosa are 3yr. runningmeansof the
Marchmeasurements[Staehelinetal. 1998]. Adaptedfrom[Solomon1999].
Asthechlorouorocarbonshaveverylongatmosphericresidencetimes,theywillcontinuetodeplete
ozoneevenafteraphase-out. Figure2.2showsthekeyprocessescontrollingchlorouorocarbonlifetimes
in the Earth's atmosphere. These species are not signicantly soluble in water; nor do they react
with ocean or soil surfaces or with any chemical speciespresent in the troposphere. Their chemical
destruction dependsuponthe ultraviolet light foundinthestratosphere. Thisradiationbreaksupthe
chlorouorocarbon molecules, yieldingClatoms thatcan goon todestroyozoneincatalyticcycles as
they move throughthe stratosphere.
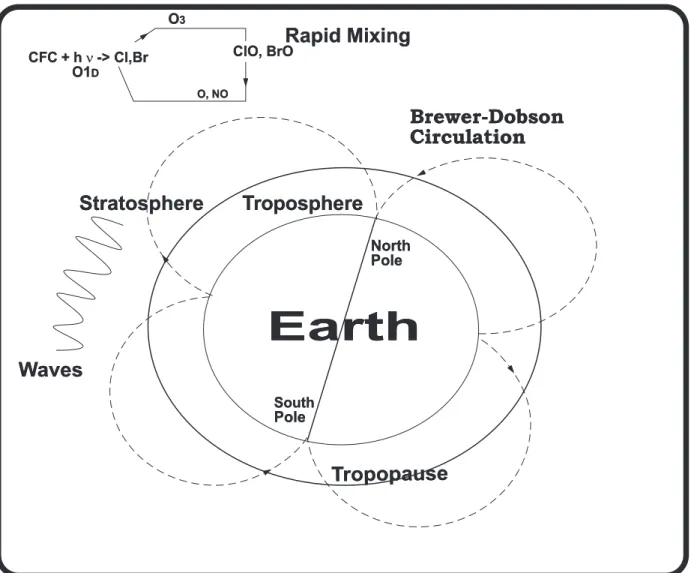
Dobson [1930] inferred the existence of a large-scale stratospheric circulation cell characterized
by rising motion in the tropics and descending motion at mid and high latitudes on the basis of his
observations ofthelatitudegradientsinozone. Brewer[1949]reachedasimilarconclusion basedupon
anelegantanalysisofearlywatervapourmeasurements. Recentstudieshaveusedobservationsofvery
long-lived gaseswithknowntropospherictrendssuchasCO
2
[SchmidtandKhedim1991]toshowthat
thetimescale for the overturningof this Brewer-Dobson circulationcell is 5 years. About 90%ofthe
total atmosphericmassresides inthetroposphere, and 10%resides inthestratosphere.
TheBrewer-DobsoncirculationillustratesonlythekeynetprocessesthattransportCFCsandother
gases in a zonally averaged owpattern. Waves mix trace gases when they break down, particularly
7 2.2. TROPOSPHERIC OZONE
Figure2.2: Schematicdiagram showing the breakdownofCFCs and catalyticdestruction ofozone inthemiddle and
upperstratosphere. Asthe stratospherecontainsonly10%of themassofthe totalatmosphere,the atmo-
spheremustturnovermanytimestodestroyalloftheCFCspresent,resultinginlongatmosphericresidence
timesofthesegases. Adaptedfrom[Solomon1999].
2.2 Tropospheric Ozone
In thebeginning of the 20thcentury all ozone inthe troposphere wasbelieved to be of stratospheric
origin,becausetheshort-wavesolar radiationrequired(240nm)fortheprimaryproductionofO
3
by photolysisof the oxygenmolecule is alreadyabsorbedinthe stratosphere.
However, inthe mid1940s, it became clear thattroposphericozone productioncould also take place.
It was shown that plant damage can be produced by ozone ( in the Los Angeles(USA) area heavy
damage hadrepeatedly occurred to vegetable crops). Haagen-Smit etal. [1952] proposedintheearly
1950sthatozonecouldbeformedasaresultofphotochemicalreactionsinvolvingnitrogenspeciesand
reactive non-methane hydrocarbons, NMHC, present in automobile exhaust (like ethylene, butane,
etc.). Sometimes the NMHC are also called NMOC, non-methane organic compounds. The overall
reactionidentiedto produce O
3
wasasfollows
NMOC+NO
x
+h !O
3
+other pollutants (2.1)
NO
x
represents nitricoxide(NO) plus nitrogen dioxide (NO
2
);NO,however, generallyforms the
greatest fractionofdirectlyemitted NO .
Since hydrocarbonsand NO
x
are major constituentsof the exhaustfromuncontrolled motor vehicles
and LosAngeleshasyear-round intensesunlight,appropriate meteorologicalandgeographical charac-
teristics,it isclear whyphotochemical airpollution wasrstidentied there.
The following are the principal reactions leading to ozone production and destruction in the tropo-
sphere.
NO
2
h
! NO+O(
3
P) 420nm J(NO
2 )
O(
3
P)+O
2 M
! O
3
k
1
=1:510
14 cm 3
mol ecul esec
NO+O
3
! NO
2 +O
2 k
2
=1:810 12
cm 3
mol ecul esec
(2.2)
WhenthereisaphotostationarystateestablishedbetweentheNO
x andO
x
species,wecancalculate
theO
3
concentration
[O
3 ]=
J(NO
2
)[NO
2 ]
k
2
[NO]
() [NO]
[NO
2 ]
=
J(NO
2 )
[O
3 ]k
2
(2.3)
The ratio of NO to NO
2
is also called Leighton ratio. During the night dierent other reactions
become important involving NO
3
,which is photolysed during theday(the photolysis rates aregiven
for solar zenith angle(SZA) ofO o
).
NO
2 +O
3
! NO
3 +O
2 k
3
=1:210 13
cm 3
mol ecul esec
NO
3
h(580nm635nm)
! NO+O
2
J
1 (NO
3
)=0:022s 1
NO
3
h(635nm)
! NO
2
+O J
2 (NO
3
)=0:18s 1
NO
3
+NO ! 2NO
2 k
4
=2:610
11 cm 3
mol ecul esec
NO
3 +NO
2
M
! N
2 O
5 k
5
=2:510 11
cm 3
mol ecul esec
NO
3
+R H ! HNO
3
+R RH=hydrocarbons
(2.4)
Themain sinkofNO
x
isnitric acid(HNO
3 ).
NO
2
+OH ! HNO
3
k
6
=1:110 11
cm 3
mol ecul esec
NO
3
+R H ! R+HNO
3
NO
3
+R CHO ! R CO+HNO
3
(2.5)
Photochemicalozoneproductioninpollutedurbanareascanbeexplainedbythefollowingreaction
schemes - the O(
1
D)to O(
3
P)transition isforbidden,sothatO (
1D) reactswithother species
O
3
h(315nm)
! O(
1
D)+O
2
O
3
h(315nm1100nm)
! O(
3
P)+O
2
O(
1
D)
M
! O(
3
P) k
7
=210
11 cm 3
mol ecul esec
O(
1
D)+H
2
O ! 2OH k
8
=2:210
11 cm 3
mol ecul esec
CO+OH
O
2
! CO
2 +HO
2
HO
2
+NO ! OH+NO
2 k
9
=8:610 12
cm 3
mol ecul esec
R H+OH ! R+H
2 O
R+O
2
! R O
2
R O
2
+NO ! R O+NO
2
! R ONO
2
(2.6)
The newly generated R O =R `CHO radicals react with O
2
producing HO
2
,which itself is again
producing aOH radical, closing thiscatalytic O
3
production cycle.
9 2.3. STRATOSPHERIC GAS PHASE CHEMISTRY RELATED TO OZONE
relatively small. Under such conditions the ozone production is dominated by oxidation of CO and
CH
4
insteadof NMHC[Crutzen 1974].
CO+OH ! CO
2 +H
H+O
2
M
! HO
2
CH
4
+OH ! CH
3 +H
2 O
CH
3 +O
2 M
! CH
3 O
2
HO
2
+NO ! OH+NO
2
HO
2 +O
3
! OH+2O
2
CH
3 O
2
+NO ! CH
3
O+NO
2
CH
3 O+O
2
! HO
2
+HCHO
(2.7)
The ozoneconcentration can thenbe estimatedto
[O
3 ]=
k
HO
2 +NO
k
HO
2 +O
3
[NO]4300[NO] (2.8)
ForbackgroundO
3
valuesoftypically40ppb,thiscorrespondstoathresholdof10 pptNO forthe
productionofozone. Thefastozonedepletion(withinafewdays)inthepolarregionsobservedduring
spring cannot be explained by a decrease in NO, but is related to the appearance of tropospheric
boundarylayer BrO [Hausmannand Platt 1994].
The photochemical production of OH is possible via photolysis of ozone ( 310nm), so that O
3
is largely inuencing the oxidation capacity of the atmosphere. The fundamental importance of the
oxidationbythe hydroxylradicalis the conversionofnon-soluble compoundsinto highlysolubleones
which areremoved from theatmosphere veryeciently bywet deposition.
2.3 Stratospheric gas phase chemistry related to ozone
2.3.1 Chapman Chemistry
A photochemical theory for formation and destruction of ozone based on an oxygen-only chemical
schemewasrstproposedbyChapman [1930]. Chapmannotedthatozoneand atomicoxygenrapidly
interchange with each other, while the sum of the two is linked to much slower chemical processes.
This work laid the foundation for the understanding of odd oxygen chemistry, which allows a clear
distinction tobe drawn between netandgross production and lossof ozoneover a chosen timescale.
O
2 h
! 2O 242nm (2.9)
O+O
2 M
! O
3
(2.10)
O
3 h
! O(
1
D)+O
2
320nm (2.11)
O(
1
D) M
! O(
3
P) (2.12)
O
3 h
! O(
3
P)+O
2
1100nm (2.13)
O+O M
! O
2
(2.14)
O(
3
P)+O
3
! 2O
2
(2.15)
Ozonephotolysisbelow50kmrepresentsagrossbutnotnetlossprocessovertimescalesoftheorder
ofminutes, sincenearlyallof theatomicoxygenthusproduced reformsozoneinjust afewsecondsor
less. Ozone andatomicoxygentherebycyclevery rapidlybetweenone another inthe stratosphere. A
a netlossof the sumof the two overextended timescales. Henceit isconceptually useful to consider
atomic oxygen togetherwith ozoneasan odd oxygen familydistinct fromthemuch longer-lived form
of even oxygen, O
2 .
2.3.2 Catalytic Cycles
After Chapman's groundbreaking theory, it became clear that stratospheric ozone was chemically
destroyed not solely by reaction with atomic oxygen, but also by hydrogen[Bates and Nicolet 1950]
and nitrogenoxide chemistry[Crutzen 1970]. Each ofthese speciesmayalsobeconsidered intermsof
their ownodd hydrogen andodd nitrogenfamilies, themembersof which can interchange chemically
withoneanother. Hydrogenandnitrogenoxidescandestroyoddoxygeninacatalyticfashionwherein
theinitiatingactivespecies(e.g. OH, NO)areregenerated, sothateven smallamountsofthese gases
can inuence themuchgreaterozone abundances.
O+OH ! O
2
+H OddHydrogenCatalytic Cycles (2.16)
H+O
2 M
! HO
2
(2.17)
O+HO
2
! O
2
+OH (2.18)
Net Cycle 1:O+O M
! O
2
(2.19)
OH+O
3
! HO
2 +O
2
(2.20)
HO
2 +O
3
! OH+2O
2
(2.21)
Net Cycle 2: 2O
3
! 3O
2
(2.22)
NO+O
3
! NO
2 +O
2
OddNitrogenCatalytic Cycle (2.23)
O+NO
2
! NO+O
2
(2.24)
Net Cycle 3:O+O
3
! 2O
2
(2.25)
Cl+O
3
! ClO+O
2
OddChlorine Catalytic Cycles (2.26)
ClO+O ! Cl+O
2
(2.27)
Net Cycle 4:O+O
3
! 2O
2
(2.28)
Cl+O
3
! ClO+O
2
(2.29)
Cl+O
3
! ClO+O
2
(2.30)
ClO+ClO M
! Cl
2 O
2
(2.31)
Cl
2 O
2 h
! Cl+ClO
2
(2.32)
ClO
2 M
! Cl+O
2
(2.33)
Net Cycle 5: 2O ! 3O (2.34)
11 2.3. STRATOSPHERIC GAS PHASE CHEMISTRY RELATED TO OZONE
Cl+O
3
! ClO+O
2
Odd Cl-Br Catalytic Cycle (2.35)
Br+O
3
! BrO+O
2
(2.36)
BrO+ClO ! Br+ClO
2
(2.37)
ClO
2 M
! Cl+O
2
(2.38)
Net Cycle 6: 2O
3
! 3O
2
(2.39)
The following reactions illustrate how one family of gases can couple to another (such as the
formationofClONO
2
throughreactionofClO withNO
2
;ClONO
2
isthus amember ofboththeodd
chlorine and odd nitrogen families) and how relatively long-lived reservoirs (HCl;ClONO
2
;HNO
3 )
form, whichcan strongly inuence theabundances ofthe ozone-destroying gases.
ClO+NO ! Cl+NO
2
Couplingand Reservoir Reactions (2.40)
Cl+CH
4
! HCl+CH
3
(2.41)
HO
2
+ClO ! HOCl+O
2
(2.42)
ClO+NO
2 M
! ClONO
2
(2.43)
OH+NO
2 M
! HNO
3
(2.44)
HCl+ClONO
2
! Cl
2
+HNO
3
KeyHeterogeneous Reactions (2.45)
N
2 O
5 +H
2
O ! 2HNO
3
(2.46)
H
2
O+ClONO
2
! HOCl+HNO
3
(2.47)
HCl+HOCl ! H
2
O+Cl
2
(2.48)
BrONO
2 +H
2
O ! HNO
3
+HOBr (2.49)
HCl+BrONO
2
! HNO
3
+BrCl (2.50)
HCl+HOBr ! H
2
O+BrCl (2.51)
The natural abundances of odd hydrogen can also be aected through human modications of
sources gases such as H
2
O and CH
4
, while natural odd nitrogen can be perturbed through direct
emissions ofhigh-ying aircraft, bynuclear explosions, or by changes inits primarysource gas, N
2 O.
Stolarski and Cicerone [1974] pointedout theimportance ofchlorine engaging inacatalytic cycle
resultinginozonedestructionandMolinaandRowland[1974]identiedman-madechlorouorocarbons
asthemajorsource ofozone-destroyingstratospheric chlorine. Wofsy etal. [1975],Yungetal. [1980],
Tungetal. [1986] andMcElroyetal. [1986] showedthatbromocarbonscouldalsocontributetoozone
depletion,especiallythroughthecoupling ofbromineandchlorinechemistry. Figure2.3andFigure2.4
showtherelative importance ofthedierent ozonedestructioncycleswithrespectto theheight inthe
stratosphere. Ascanbeseen inthegures,thebrominecycle- whichis ofspecial interestwithin this
thesis - plays a non-negligible role in the lower stratosphere, where most of the stratospheric ozone
resides.
2.3.3 Nitrogen chemistry in the stratosphere
The daytime evolution of NO
2
is determined by the reactions with NO;NO
3
and N
2 O
5
. During the
night NO is converted via the reactionwithO
3
to NO
2
,which itselfcan react againwithO
3
to form
NO ,whose photolysisduring thedayis veryfast (lifetime=3 sec).
Figure2.3: Modelled vertical distribution of the ozone
depletionpotentialofdierentcatalyticcycles
-timeintegration of24h-for38 Æ
NinMarch
[GarciaandSolomon1994]
Figure2.4: Modelled vertical distribution of the ozone
depletionpotentialofbromineversuschlorine
-timeintegrationof24h-for38 Æ
NinMarch
[GarciaandSolomon1994]
NO+O
3
! NO
2 +O
2
(2.52)
NO
2 +O
3
! NO
3 +O
2
(2.53)
The next step is theformation of N
2 O
5
by reaction of NO
2
with NO
3 . N
2 O
5
is a reservoir gas,
which isrelativelystableinthestratosphere, especiallywhenthe temperatures arelowasinthepolar
stratosphere, when thermaldecayis nomore eective.
NO
2 +NO
3 M
$ N
2 O
5
(2.54)
NO
2 h
! NO+O J
NO
2
=1:410 2
sec 1
(2.55)
NO
3 h
! NO
2
+O or NO+O
2 J
NO3
=0:36sec 1
(2.56)
N
2 O
5 h
! NO
2 +NO
3 J
N
2 O
5
=310 5
sec 1
(2.57)
InthesunlitstratosphereNO
2 ,NO
3 andN
2 O
5
arephotolysed,butthephotolysisofN
2 O
5
proceeds
some orders of magnitude more slowly than the one of NO
2
. That is why the measured NO
2 slant
column densities (SCDs) are smaller in the morning than in the evening for the same solar zenith
angle (SZA), because in the morning NO
2
is rst photolysed very fast, while it is increasing slowly
duringtheday- asN
2 O
5
isphotolysed slowlyduringtheday-andveryfastintheeveningwhenNO
2
photolysis decreases withSZA.
These reactions are responsible both for the seasonal variation of the NO
2
slant column (maximum
in the summer and minimum in the winter) and for the latitudinal NO
2
gradient (Noxon-Cli) in
the winter hemisphere with reduced NO
2
columns towards the pole [Noxon 1979]. This reduction
of NO
2
in thedark polar stratosphere is strongest during mid winter in the polar vortex, where the
temperaturesbecomelowest, andiscalleddenoxication. Thegradient iseven reinforcedthroughthe
reduced airmass exchange along the border ofthepolarvortex.
Besides N
2 O
5
, HNO
3
is another important reservoir of the inorganic nitrogen family (NO
y
). It is
formed in the gas phase by thereaction of OH with NO
2
and heterogeneously by the hydrolysis of
N O on PSCs or sulphateaerosols.
13 2.3. STRATOSPHERIC GAS PHASE CHEMISTRY RELATED TO OZONE
NO
2 +OH
M
! HNO
3
(2.58)
N
2 O
5 het;H
2 O
! 2HNO
3
(2.59)
The main sinkofHNO
3
isthe photolysis (resultinginNO
2
and OH)and thereactionwithOH.
HNO
3
+OH !NO
3 +H
2
O (2.60)
Both the formation of HNO
3
and its destruction arerelatively slow, sothat itdoesnot inuence
theNO
2
daytimeevolution. But theformer reactionsare veryimportant for the renoxication ofthe
polarstratosphere inspring, whentheNO
x
concentrations areincreasing again andreactive chlorine
isbound againinits reservoirs.
2.3.4 Halogen chemistry in the stratosphere
Halogens belong to the seventh main group of the periodic table of chemical elements. These are
uorine(F), chlorine(Cl), bromine(Br), iodine(I) and astatine(At).
2
Fluorine hasonly the oxidation
number-1, while theotherhalogens have primarily the number -1and +7. Thevalences+5, +3 and
+1aremore and moreunstable.
These elements are all non-metals, but the metallic character becomes more and more intense going
from F to At. Hydroxides are only known to exist for Cl, Br and I. Asin the 6th main group, the
acidity decreases from Cl to I. While HClO
4
is the strongest acid, H
5 IO
6
isonly weakly acid. The
aqueoussolutions of the halogens are acidsand their acidity increases strongly from HF(medium) to
HI(very strong).
In the stratosphere chemical partitioning processes play a major role in ozone destruction that is
dramatically illustrated by the contrasts between F, Cl and Br gas phase chemistry. Briey, the
halogen atomsreleased inthestratospherefrom chlorocarbon,bromocarbon,and uorocarbonsource
gases can form acids (through abstraction of a hydrogen atom) and nitrates (through reaction with
NO
2
). In thecaseof uorine, the acidHF isquickly formedand sotightly bound thatessentially all
uorine released from uorine source gases in the stratosphere is irreversibly and rapidly neutralized
asHF [RowlandandMolina 1975]. Theamount ofatomicuorine andFO availabletoparticipatein
ozone-destroyingcatalytic cycles(or,inchemicalterms, thecatalyticchainlength)ishenceextremely
short,and uorine hasanegligibleimpact onozone [Lary1998].
Chlorine forms both HCl and ClONO
2
reservoirs. These gases canbe reconverted to chlorineatoms
bygasphasechemistry(i.e., byreactionwithOHandphotolysis,respectively). Theamount ofCland
ClO available to participate inozone-destroying catalytic chemistry therefore is critically dependent
on the partitioning of chlorine between these active chlorine radicals and the non-ozone-destroying
reservoirs HCl andClONO
2 .
Bromine is less tightly bound than chlorine, so that relatively little of the bromine released from
bromocarbons is tied up in HBr and BrONO
2
, rendering this atom quite eective for ozone loss
[Wofsy et al. 1975; Yung et al. 1980; Lary 1996; Lary et al. 1996], especially in combination with
chlorine [Tung et al. 1986; McElroy et al. 1986]. Although there are signicant human sources of
bromine, the contemporary abundances of total stratospheric bromine are about 200 times smaller
than thoseof chlorine[Schauer etal. 1998;Wamsley 1998; Harder etal. 2000].
Iodinemay also participate inozone-destroying catalytic cycles with bromine and chlorine [Solomon
etal. 1994] butits stratosphericabundanceis believedto bemuchsmallerthan thoseof bromineand
chlorine[Pundt etal. 1998], and its primary sourcesarebelieved to benatural rather than largely or
partlyman-made asinthecaseof uorine,chlorine, andbromine.
2
Stratospheric Chlorine Chemistry
While many natural processes produce chlorine at ground level (including for example, sea salt and
volcanic emissions HCl), these compounds are eciently removed in precipitation (rain and snow)
owing to high solubility. The removal of HCl emitted by volcanoes is extremely ecient, rendering
even the most explosive volcanic plumes ineective at providing signicant inputs of chlorine to the
stratosphere.
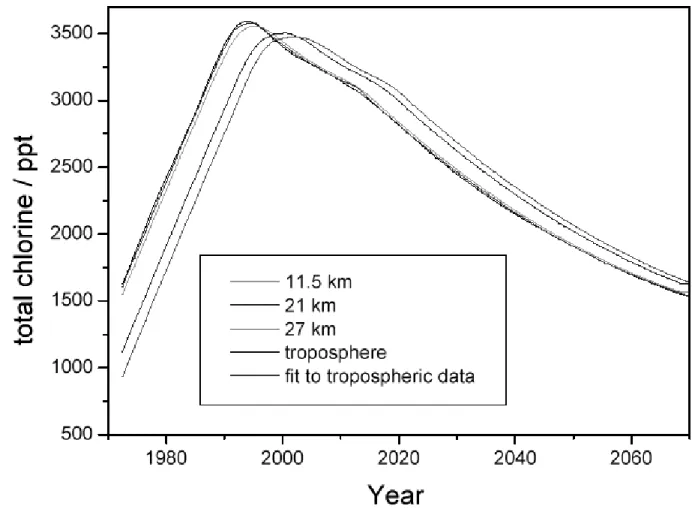
Incontrast,airborneobservationsofthesuiteofchlorouorocarbonsatthe baseofthetropicalstrato-
sphere [Schauer et al. 1998] show that the total chlorine content in air entering the lowermost
stratosphere due to chlorouorocarbons in1992 wasabout 3.0 ppb,compared with only 0.1-0.2 ppb
from concurrent measurements of HCl and 0.5-0.6 ppb from CH
3
Cl, which isthe sole stratospheric
chlorocarbon that has signicant natural sources. Observations have conrmed that the temporal
trends inglobal surface levelabundances ofchlorouorocarbons areconsistent withtheknown indus-
trial emissions [Montzka etal. 1996], both in termsof thebuildup of thesegases inpast decades and
thesloweraccumulationinthe 1990sfollowing reductions inglobal use(see Figure2.14).
CHLORINE SPECIES (March 15 - Local Noon - 40 N)
10 4 10 5 10 6 10 7 10 8 10 9
Number Density (molecules/cm 3 ) 10
20 30 40 50
Altitude (km)
10 18 10 17
Total Density
Cl ClO
ClONO
2 HCl
HF
Figure2.5: Typicalnumberdensitiesforchlorinespeciesformid-latitudesandspringlocalnoon. Adaptedfrom[DeMore
etal. 1997].
Thetypical chlorine partitioning is shownin Figure 2.5. Inthe uppermost stratosphere above 45
km,nearlyall ofthechlorinereleased fromsource moleculessuchasCFCs (Cl
y
) issequestered inthe
HCl reservoir, owing largely to the ecacy of the reaction of Cl+CH at warm temperatures and
15 2.3. STRATOSPHERIC GAS PHASE CHEMISTRY RELATED TO OZONE
highCl=ClO ratiosthere. Recentstudies[Lipsonetal. 1997]suggestthatasmall yieldofHClinthe
reactionof ClO withOH alsoaects theHCl=ClO partitioning inthisregion.
Stratospheric Bromine Chemistry
The other important halogen ozone-destruction catalytic cycle is the bromine cycle involving the
bromineoxide radicalBrO. Herean overviewabout the brominegasphaseand heterogeneous chem-
istry accordingto Lary[1996], Lary etal. [1996] isbegiven.
Brominedoesnothavesuchaphotochemicallystablereservoiraschlorine. Themost important reser-
voirspeciesareHBrandBrONO
2
withphotochemicallifetimes,whichare100timesshorterthanthe
lifetimesofHClandClONO
2
,respectively. Incomparisonwithchlorinetheratioofreactivebromine
(BrO
x
)isbyfarlargerthaninthe caseofchlorine,sothattheozonedepletionpotentialofbromineis
comparable to thatone of chlorine, although the BrO concentration is 10-200times smallerthan the
one ofClO [McKinneyetal. 1997; Harder etal. 1998].
The impact of bromine ismost eective during high chlorine activation like for example in thepolar
vortex. There,the combined cycleof BrO and ClO can eectively destroyozone
ClO+BrO ! BrCl+O
2
( 7%) (2.61)
! Br+ClOO ( 38%) (2.62)
! Br+OClO ( 55%) (2.63)
The branching ratios of this reaction are given for T =210 K. Both the generation of BrCl and
ClOO lead to a coupled catalytic bromine-chlorine ozone-destruction cycle [McElroy et al. 1986],
because of the fast photolysis of BrCl and the impact-induced decay of ClOO to Cl and molecular
oxygen.
Thethird pathwayis theonly knownproduction channelof OClO in the lowerstratosphere, because
thereactionof ClO and NO
3
[Toumi 1994]can be neglectedthere.
Themain sinkof OClO isthe fast photolysis
OClO h
!ClO+O (2.64)
which prevents the buildup of noteworthy amounts of OClO during the day. The formation of
OClO isnotdepletingO
3
-becauseoftheformationofoneO
3
moleculeafterthephotolysis- butitis
an indicatorfor chlorineactivation,aswell asforozone depletion[Solomonetal. 1987;Sanders etal.
1989;Sessler etal. 1995].
BrO has a short lifetime ( 1 sec) during the day. Still between 40-70% of the total inorganic
bromine (Br
y
) can be in the form of BrO, because atomic bromine (Br) does react very fast with
O
3
. Themost important sinksof BrO arethe photolysisand thereactions withNO,ClO and NO
2 .
During the sunset the BrO concentrations decrease very fast, as the reservoir species become more
and moreabundant.
BrONO
2
isformed bythe reactionofBrO and NO
2
BrO+NO
2 M
!BrONO
2
(2.65)
It is under non-denoxication conditions (out of the polar vortex) the most important bromine
reservoirspeciesand hasaphotolytic lifetimeofa fewminutes
BrONO
2 h
!Br+NO
3
(2.66)
Another important heterogeneous loss reaction of BrONO
2
is the BrONO
2
hydrolysis on PSC
(polar stratospheric clouds) and sulphuric acid aerosol surfaces - the latter are subject of another
NO 2 3
HBr
BrCl
HCl
ClO hv, O(3P)
hv, O(3P) HO 2
HCHO
OH
O(3P) hv, O(3P), OH
hv, O(3P) NO, O
gases Source
HOBr OH
BrONO 2
2
hv
H O
HO 2 BrO
Br
Figure2.6: Stratosphericbrominechemistry[Lary1996;Laryetal. 1996]
BrONO
2
aerosol ;H
2 0
! HOBr+HNO
3
(2.67)
HOBr can alsobe formedbythereactionof BrO and HO
2
BrO+HO
2
!HOBr+O
2
(2.68)
Because of this reaction and the lower photolytic stability of HOBr;(J
HOBr
= 1:6J
BrONO2 )
in comparison with BrONO
2
(lifetime =500 sec) HOBr can form up to 30% of the total inorganic
bromine (Br
y
) during daytime and can be the most important bromine reservoir during the night
taking into account the increased importance of BrONO
2
hydrolysis on sulphuric acid background
aerosols.
BrCl is the productof thereaction of BrO and ClO and has thelargest photolysis frequency ofthe
bromine reservoirs (lifetime=30sec, at 67 o
N, noon). In general, the ratio BrCl=Br
y
is very small,
but itcan increasenoticeablybecause ofheterogeneous brominereactions,especiallyduring thepolar
night.
HBrisformed bythereactionofatomicBr with theperoxyradical HO
2
andformaldehyde,HCHO
Br+HO
2
! HBr+O
2
(2.69)
Br+HCHO ! HBr+HCO (2.70)
However, as measuredHBr mixing ratios of 1-2ppt [Noltet al. 1997] are much larger than that
calculated bymodels, there aresuggestionsthat there isa HBr channel inthereaction of BrO with
HO
2
or the reaction of BrO with OH - a 1-2% yield of HBr in the latter reaction would reconcile
measurements andmodel[Chippereld etal. 1997].
17 2.4. HETEROGENEOUS CHEMISTRY ON PSCS LEADING TO THE
OZONEHOLEHBr+OH !Br+H
2
O (2.71)
sothatHBrhasthelongestlifetimeofallinorganicbrominespeciesinthestratosphere(1h 1day).
Following this reaction scheme, it is possible to explain the annual evolution of the BrO SCD. In
summer the higher NO
2
concentrations lead to a larger BrONO
2
formation, which means less BrO
in accordance with observations and models [Richter et al. 1999; Fish and Jones 1995; Danilin and
McConnell 1995].
0 2 4 6 8 10 12 14 16 18 20
Total Ozone Diff [DU]
Figure2.7: GlobalchangeinDobsonunitsoftotal O3 columnas afunctionof totalbrominefor March13, 1995. The
rstmodelrunincluded10pptBr
y
andthesecond20ppt.KindlyprovidedbySinnhuberandChippereld
[2000].
Because of the dierent catalytic reaction cycles, where stratospheric bromine is involved, the
impact ofan increase of bromineis not the same throughout theworld. To investigate theimpact of
bromine on stratospheric ozone Sinnhuber and Chippereld [2000] conducted two 1-year long model
runs for the years 1994/1995 with the 3-D CTM model SLIMCAT [Chippereld 1999] - one with 10
ppttotal inorganicbromine(Br
y
)andonewith 20pptBr
y
. ThedierenceinDobsonunits(DU) and
percent change is shown in Figure 2.7 and 2.8. It can be observed that the inuence of increasing
bromine levels in the stratosphere is the largest in the polar stratosphere. This is mainly due to
the coupling of bromine and chlorine chemistry in the chlorine activated polar stratosphere. As the
two gures show case model results for March 13, 1995, the largest eect can be seen in the Arctic
winter polar stratosphere, while the equivalent gures for October 1995 show the enhanced eect in
theAntarcticpolarstratosphere.
2.4 Heterogeneous chemistry on PSCs leading to the Ozone Hole
It was known long before the advent of the Ozone Hole that there exist Polar Stratospheric Clouds
(PSCs) in polar regions. The name of the PSCs was coined by [McCormick et al. 1982], who rst
0.0 0.5 1.0 1.5 2.0 2.5 3.0 3.5 4.0 4.5 5.0 5.5 6.0 6.5 7.0
Total Ozone Diff [%]
Figure2.8: Globalchangein%of totalO
3
columnas afunctionoftotalbromine forMarch13, 1995. Therstmodel
runincluded10pptBry andthesecond20ppt. KindlyprovidedbySinnhuberandChippereld[2000].
datashowedthattheAntarcticcloudswerepresentfromJuneto Septemberthattheywereassociated
withcold temperatures below200 K,and thatthey occurred between 12 and25 km.
Solomonetal. [1986]suggestedthatHClandClONO
2
mightreactonthesurfacesofPSCs,perturbing
gas phase chlorine partitioning ina manner that could greatly accelerate ozoneloss in theAntarctic
lower stratosphere.
HCl+ClONO
2
het;PSC
! Cl
2
+HNO
3
(2.72)
H
2
O+ClONO
2
het;PSC
! HOCl+HNO
3
(2.73)
The Cl
2
formed wouldphotolyze rapidly in sunlit air and form ClO. Theyalso pointed out that
thisand relatedheterogeneous reactionswouldsuppressthe concentrationofNO
2
byformingHNO
3 ,
sothatthereleasedClO couldnotreadilyreform the ClONO
2
reservoir. Thusitwasrecognizedthat
rapidozonelossvia chlorinechemistrywouldrequire(1)theheterogeneous activationof chlorinefrom
boththeHClandClONO
2
reservoirsand(2)the suppressionofNO
2
,anessentialelement inkeeping
thechlorineactive.
Molina and Molina [1987] showed that very rapid ozone depletion can occur through a previously
unrecognized catalytic cycleinvolving formation and photolysis of a ClO dimer, Cl
2 O
2
. Following a
periodof someuncertaintyregardingthekineticsandphotochemistryofthe dimer,laboratorystudies
conrmed its importance [Sanders et al. 1989]. This process is now well recognized as the primary
catalytic process responsible for about 75% of the ozone removal in the Ozone Hole. McElroy et al.
[1986] emphasized the role of bromine chemistry in ozone hole formation (in particular, its coupling
to chlorinethroughthe reactionbetween ClO and BrO);thiscycleisnowknownto contributeabout
20% totheannualformation oftheAntarctic Ozone Hole[Andersonet al. 1989].
In early studies after the detection of the Antarctic Ozone Hole it was generally assumed that the
19 2.4. HETEROGENEOUS CHEMISTRY ON PSCS LEADING TO THE
OZONEHOLEarefrequentlyoptically thickandbrilliant incolour. Such cloudsformwhen temperaturesdrop below
thefrostpointandarenowreferredtoastype2PSCs. However,moresensitivesatellitemeasurements
suggested that optically thinner PSCs were also present at warmer temperatures [McCormick et al.
1982].
Toon etal. [1986] and Crutzen and Arnold [1986] pointedout thatthe PSC particlesmight be com-
posednotonlyofwatericebutalsoofsolidnitricacidtrihydrate(NAT).LaboratorystudiesbyHanson
and Mauersberger [1988] showed that the NAT crystal is stable a few degrees above the frost point
(T
ice
)understratosphericconditions. Bothstudiesnotedthatsuchcompositioncouldaecttheimpact
on ozone in two ways: (1) by reducing the amount of nitrogen oxide that could be present (i.e., not
onlybyformingnitricacidbut alsobyremoving itfromthegasphase)and (2)byraisingthetemper-
ature at whichclouds could form, since thermodynamic analyses suggestedthat NATcould condense
at temperatures well above the frost point. These clouds became to be knownastype 1 PSCs.
In addition, Toon et al. [1986] suggested that sedimentation of large particles could result in deni-
trication of the stratosphere. The removal of nitric acid not only from the gas phase but from the
stratospherealtogetherwouldhaveapotentialtofurtherreduceNO
2
concentrationsandhenceenhance
ClO=ClONO
2
ratiosand attendant chlorine-catalysed ozone loss. McElroy etal. [1986] also consid-
eredthepossibilityof nitricacid-water particles,suggesting thatnitricacidmonohydrate(NAM)was
likelyto form,buttheseparticlesarenotbelieved tobestableunderstratosphericconditions [Carslaw
etal. 1999].
Measurements of the vertical prole of aerosols with LIDAR 3
demonstrate that PSCs sometimes
consist of solid, depolarizing (non-spherical, type Ia PSCs) particles, or additionally liquid, non-
depolarizing (spherical, type Ib PSCs). Figure 2.9 shows potential formation mechanisms of NAT
PSCs. For decreasing temperatures thesulphuric acid content of sulphateaerosols is also decreasing,
leading to ternary solutions of HNO
3
=H
2 SO
4
=H
2
O withmeasured H
2
O=HNO
3
ratios between 4:1
and 10:1. Nitric acid hydrates (NAH) could nucleate heterogeneously on water ice crystals below
the ice frost point, leading to the release of NAH particles upon subsequent ice evaporation (shown
as scenario 1). The nucleation of nitric acid hydrate particles might also occur in non-equilibrium
HNO
3
=H
2 SO
4
=H
2
Odropletsinmountainwaves,withouticeformation-scenario2. Tabazadehet al.
[1995] andTabazadehetal. [1996] suggestedthatnucleation ofsolidHNO
3
=H
2
O phasesmightoccur
in air parcels that have spent suciently long time below the nitric acid trihydrate (NAT) equilib-
rium temperature. Theypostulated the existenceof a new phase with a higher H
2
O to HNO
3 ratio
than either NAT or HNO
3 H
2 SO
4 H
2
O droplets, so called type 1c PSCs (scenario 3). Zhang
et al. [1996] have suggested (scenario 4) that nitric acid hydrates may form on frozen sulphuric acid
aerosols (sulphuric acid tetrahydrate (SAT)) after their surfaces have become activated by an initial
deposition of NAT. The supersaturation required for NAT nucleation on preactivated SAT particles
correspondstoabout2-3KcoolingbelowtheNATequilibriumtemperature. KoopandCarslaw[1996]
have shownthatSATparticlescan deliquesce to formHNO
3 H
2 SO
4 H
2
O dropletsupon cooling
to temperatures a few K above the ice frost point (typically 3-4 K below the NAT equilibrium tem-
perature). They suggested thatthis mechanism might lead to the heterogeneous nucleation of NAT.
Theformation pathwayscan besummarized asfollows:
SSA!
T#
STS!
T#
ICE!
T"
NAT !
T"
SAT: (2.74)
In theArctic type II PSCs are often induced on thelee side of mountains [Carslaw etal. 1998].
Whenairisstreamingacrossmountains,gravitywaves(RossbyWaves)canbegeneratedontheleeside.
The perturbance can even propagate into the stratosphere decreasing there locally the temperatures
belowthefrost point of NATor water andenhancing to potential ofPSCformation.
Just recently rst mass-spectrometric in-situ measurements of the composition of mountain lee wave
3
LIDAR:LIght DetectingAndRanging;ameasurementsystemusing lasers atdierentwavelengths oftenusedfor
Figure2.9: Possible generationmechanismsofPSCs: Particle phase transitionsleadingto theformationof solidPSC
type Iparticles (NAT). Altogether thereare ve scenarios ofNAT formationgivenin this plot. Circular
symbolsdenoteliquid particles, whilesquare symbolsare denotingsolidparticles. Adaptedfrom[Carslaw
etal. 1999].
inducedPSCs have been performedbySchreineretal. [1999]showing H
2
O=HNO
3
ratiosto beabove
10 at atmospheric temperatures between 189 and 192 K. The presented high ratios indicate ternary
solution particlesof H
2
O;HNO
3
and H
2 SO
4
ratherthan thepresence ofsolidhydrates.
Animportant reactionremovingNO
x
fromthegasphaseisthehydrolysisofN
2 O
5
onPSCs[Solomon
etal. 1986]-asdescribedintheprecedingsectionabouttheNO
x
chemistry. Therearemoreimportant
reactions occurringon thesurface of PSCs,like the BrONO
2
hydrolysisand heterogeneous reactions
withHCl 4
4
TheheterogeneousreactionsofHOBr,HOCl ,Cl ONO2,BrONO2andN2O5withHBrarelessimportantbecause
21 2.4. HETEROGENEOUS CHEMISTRY ON PSCS LEADING TO THE
OZONEHOLEHOCl+HCl
het;PSC
! Cl
2 +H
2
O (2.75)
BrONO
2
+HCl
het;PSC
! BrCl+HNO
3
(2.76)
HOBr+HCl
het;PSC
! BrCl+H
2
O (2.77)
N
2 O
5
+HCl
het;PSC
! ClONO+HNO
3
(2.78)
When the polar stratosphere reaches the end of the polar night (see Figure 2.10) and it is again
sunlit, thenthe weakly bound halogenspecies(e.g. Cl
2
andHOCl) arequicklyphotolysed
Figure2.10: TheschematicevolutionofthepolarOzoneHoleduringthepolarnightandspring. Adaptedfrom[Wagner
1999].
Cl
2 h
! 2Cl (2.79)
HOCl h
! Cl+OH (2.80)
Cl+O
3
! ClO+O
2
(2.81)
and the liberated atomic chlorine is beginning to deplete ozone. For highconcentrations of ClO
2(Cl+O
3
! ClO+O
2
) (2.82)
ClO+ClO M
! Cl
2 O
2
(2.83)
Cl
2 O
2 h
! Cl+ClO
2
(2.84)
ClOO M
! Cl+O
2
(2.85)
Net: 2O
3
! 3O
2
(2.86)
TheratelimitingstepofthiscycleistheselfreactionofClO,sothattheozonedepletionpotential
(ODP) 5
of this cycle is proportional to the square of the ClO concentration. As already mentioned
above,thiscycleisresponsiblefor 75%oftheozonedestructionintheAntarcticspring,whiletherest
is mainlydue to thecoupled bromine-chlorine-cycle.
The strengthof the ozonedepletion dependsmainly on the time, after which the NO
x
concentration
isagainhighenoughtobindthereactivechlorineinitsreservoirspecies. Becauseofthedenoxication
and thedenitrication thenitric acidconcentration tied up on the PSC particles can be very low in
theearlyspring,sothatthe ozonedepletioncan goonfor averylongtime. NO
x
fromlowerlatitudes
can mix with the polar airmasses not until the decay of the polar vortex, which takes place in mid
spring or even later.
The Antarctic ozoneholes of the 1990shave been long-lasting [Pyleet al. 1999]. Those in1995, 1996
and 1998,remained evident until mid-December. In 1998 the minimum ozonecolumn observed south
of40 o
S didnot riseabove160 DUuntilearlyDecember. Theozoneholesarelong-lasting becausethe
radiative heating of air in which ozone has been almost completely destroyed is very slow, and ow
across isentropic surfaces is largely inhibited. The vortexin thelowerstratosphere is thus now more
stable than it wasinthe 1960sto 1980s, when thebreakdown ofthe vortextook place insome years
inearly October.
The mean ozone column in the Arctic region during winter exhibits large interannual variability.
This variability is linked with interannual dierences in meteorology, which inuences ozone both
through varying transport and through varying temperatures, which modulate chemistry. A method
for deriving the chemical lossbased on ground-based, balloon-borneand satellite measurements uses
a 3-DCTMmodelfor removingthe transportcontributionintheozoneeldvariations [Goutailetal.
2000]. The largest column reduction - within the time period 1993 to 2000 - of 32% has occurred
in 1995, while the lowest of 5% was recorded in 1999. 3-D CTM simulations are found to be in
good agreement with observations during the coldest winters when chlorine is fully activated. In
contrast, signicant disagreement is found during the winters when temperatures marginally reach
PSC formation thresholds, suggesting that in those conditions the activation of the Arctic vortex is
not capturedcorrectly. Theozonecolumnlossreportedin1999/2000 (23%)issmallerthantherecord
valuesof31-32%observedinthemid-1990'sbecausethechemicallosswasrestrictedtoaltitudesbelow
600 K(21km) duringthatwinter,while in1995 the 60%lossextendedupto 700K(24 km). Though
theprolesof O
3
on March22,2000 show arecord lossof66% at 470K.
2.4.1 Heterogeneous chemistry on sulphate aerosols
Also in mid-latitudes there was statistically signicant ozone loss during the 1990s of 5-10% [WMO
1998] and it was clear that this loss could not be attributed to dilution of polar airmasses with low
5
AnindexcalledtheOzoneDepletionPotential(ODP)hasbeenadoptedforregulatorypurposesundertheMontreal
Protocol. TheODPofacompoundisanestimateofthetotalozonedepletiondueto1Kgofthecompounddividedby
thetotalozonedepletiondueto1KgofCFC-11. Thus,theODPshows relativeeectsofcomparableemissionsofthe
variouscompounds. Modelcalculated values forODPs ofindividual compounds changeas thebasic understandingof