(2018), volume 54 (5), pp. 684–698 doi:10.1017/S0014479717000321
A S S E S S I N G L I V E S TO C K WAT E R P RO D U C T I V I T Y I N M I X E D FA R M I N G S YS T E M S O F G U M A R A
WAT E R S H E D, E T H I O P I A
ByMENGISTU ALEMAYEHU†‡§, TILAHUN AMEDE¶, DON PEDEN¶, TESFAYE KUMSA†, MICHAEL H. BÖHME††andKURT J. PETERS‡
†Livestock Research Directorate, Ethiopian Institute of Agricultural Research, P.O. Box 2005, Addis Ababa, Ethiopia,‡Department of Crop and Animal Sciences, Humboldt University of Berlin,
Philippstr. 13, Haus 9, 10115, Berlin, Germany,¶International Livestock Research Institute/International Water Management Institute (ILRI/IWMI), P.O. Box 5689, Addis Ababa, Ethiopia and††Department of Crop and Animal Sciences, Humboldt University of Berlin,
Unter den Linden 6, 10099, Berlin, Germany
(Accepted 5 August 2016;First published online 13 July 2017)
S U M M A RY
A monitoring study was carried out in Gumara watershed, upper Blue Nile basin, with the objective of evaluating livestock water productivity (LWP) using a life cycle assessment method. Sixty two smallholder farmers were selected for the study implemented between November 2006 and February 2008. Data on crop and livestock production were collected to allow assessment of livestock water productivity. Study sites were situated in three different rainfed mixed crop/livestock farming systems; barley/potato based system (BPS), tef/finger-millet based system (TMS), and rice/noug based system (RNS). LWP was found to be significantly lower (p<0.01) in RNS (0.057 USD m−3water) than in TMS (0.066 USD m−3water) or in BPS (0.066 USD m−3water). Notably, water requirement per kg live weight of cattle increased towards the lower altitude area (in RNS) mainly because of increased evapo-transpiration. As a result, 20% more water was required per kg live weight of cattle in the low ground RNS compared to BPS situated in the upstream parts of the study area. Cattle herd management that involved early offtake increased LWP by 28% over the practice of late offtake. Crop water productivity expressed in monetary units (0.39 USD m−3water) was higher than LWP (0.063 USD m−3water) across the mixed farming systems of Gumara watershed. Strategies for improving LWP, from its present low level, could include keeping only the more productive animals, increasing pasture productivity and linking production to marketing. These strategies would also ease the imbalance between the existing high livestock population and the declining carrying capacity of natural pasture.
I N T RO D U C T I O N
Rainfed mixed crop/livestock farming is the principal production system in the highlands of Ethiopia. It is a complex system that combines crop and livestock production within the same management unit. However, the productivity of livestock in the traditional mixed farming system is very low (Haile et al., 2009). Livestock are also often blamed for their negative impact on the environment (Steinfeldet al.,
§Corresponding author. Email:mengistualem@yahoo.com
2006). Improving livestock productivity while mitigating their environmental impact challenges to enhance the role of livestock in reducing poverty and improve the livelihoods of smallholder farmers in Ethiopia and across sub-Saharan Africa.
Water is a key limiting factor to livestock production in the upper Blue Nile basin of Ethiopia particularly because of the highly seasonal availability of feed resources.
Livestock production is considered to be a relatively water intensive enterprise (Moldenet al.,2010) regardless of the production system. Globally, there is growing concern on water allocation to the agricultural sector in the face of the on-going climate change (Zhanget al.,2007) and possible competing uses (Moldenet al.,2010).
It is thus important to evaluate livestock productivity from a water use perspective to help comprehend strategies that can improve livestock water productivity (LWP).
LWP is a concept (Peden et al., 2009) that has recently received attention (Descheemaeker et al., 2010; Haileselassie et al., 2009; Moldenet al., 2010) because of its usefulness as a tool to identify possible intervention options that can lead to increase livestock production with more effective use of water and with reduced impact on the environment. LWP is generally determined as a ratio of total benefits obtained from livestock per unit of water depleted in production (Pedenet al.,2009).
Previous work on LWP including the study of Haileselassie et al. (2009) focused on assessing livestock outputs and water inputs accounted over a single study year. This approach has limitations in accounting for the portion of water used by the livestock to reach production age. The present study was, therefore, intended to determine LWP using a life cycle assessment (LCA) method to fully account for the water used by livestock from birth to farm gate. The objectives of the present study were (i) to assess LWP across different agro-ecological zones of Gumara watershed, and (ii) to highlight possible intervention options for improving LWP relevant to the study area.
M AT E R I A L S A N D M E T H O D S
Study site
Gumara watershed was selected in the upper Blue Nile basin (Supplementary Fig. S1 available online at https://doi.org/10.1017/S0014479717000321) for undertaking the present study. The site is located in the north western part of Ethiopia having coordinates of 11°81–11°85 N, and 37°70–38°02 E. Elevation of the watershed varies from 1780 m above sea level (asl) around the entry point of Gumara River into Lake Tana to 3704 m asl towards the source of the river at the base of Guna mountain. The surface area of the watershed is 1277 km2 and it produces a mean annual flow of 1317 MCM (Abereham, 2013). The rainfall distribution follows a uni-modal pattern with most precipitation occurring in June–
September with average annual precipitation of 1492 mm in the upper reaches and 1378 mm in the lower reaches of the watershed (Fenta,2009). The landscapes of the watershed encompass various topographic features ranging from rugged rolling hills to the vast flat lands known as the Fogera plains, towards Lake Tana that is usually flooded during the wet season. The soil type of the watershed is generally classified
into five categories (Fenta,2009) out of which the luvisols dominate the upper reaches while the vertisols dominate the lower reaches of the watershed.
Farming systems
The prevailing agricultural production system in Gumara watershed is subsistence- based mixed crop-livestock farming. Human and livestock pressures are high relative to the resource base of the watershed and consequently out-migration takes place to other highland or lowland areas. There is an acute shortage of arable land that has led to the expansion of production on marginal and fragile lands including steep slopes (Tamene and Vlek,2008).
The crops grown in the watershed area are relatively diverse depending on the agro-ecological conditions. Given the mosaic of mixed crop-livestock farming land uses occurring in the watershed, three distinct scenarios of mixed farming practice were identified. Haileselassie et al. (2009) specified a similar division of the mixed farming system to describe the watershed and the details can be found in their report.
1. Rice/noug based farming system (RNS): It occupies the vast plain area of Fogera adjacent to Lake Tana (Fig. S1), which is warmer for most of the year. It covers approximately 20% of the watershed and is situated at altitudes between 1780 and 1850 m asl. The farming community used to rely more on livestock than on crop production for its livelihood. Livestock have become secondary to crop production after the introduction of paddy rice farming to make use of the large flooded plain area in the wet season. The community predominantly raises cattle of their own local breed known as Fogera. The high livestock density in the area is a major problem. Feed shortage becomes critical during the rainy season due to flooding and depletion of the crop residue reserves. Livestock health problems such as trypanosomosis and fasciolosis are major concerns. The present low level of livestock performance is a manifestation of the complexity of problems in livestock production in the study area.
2. Tef/finger millet based farming system (TMS): This category represents the largest part (about 60%) of the watershed. The altitude ranges between 1851 and 2400 m asl. Cool to moderately warm weather conditions prevail. The area is typically characterized by rugged terrain and rolling hills. Within a small area, wide ecological variability is found and hence a diverse range of crops is grown.
Fragmented stone cover is a typical feature of the croplands. Similarly, different livestock species viz. cattle, sheep, goats, horses, donkeys and mules are kept by farm households. Equine livestock are used as pack animals for transporting agricultural goods across the prevailing rugged terrain. This farming system suffers from problems of severe soil erosion, land degradation, overutilization of communal grazing land, feed shortage, and poor health care all of which combine to produce low livestock performance.
3. Barley/potato based farming system (BPS): This system represents about 20% of the watershed area at an elevation between 2401 and 3700 m asl. The system is characterized by cool uplands with a mean daily minimum air temperature of 2.8
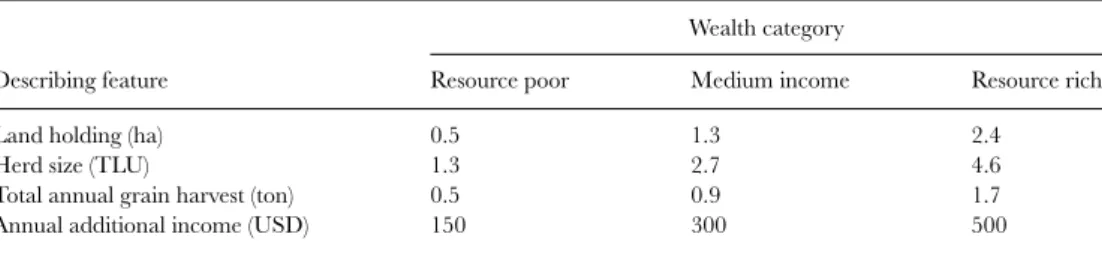
Table 1. Key features describing wealth categories of farm households in Gumara watershed area.
Wealth category
Describing feature Resource poor Medium income Resource rich
Land holding (ha) 0.5 1.3 2.4
Herd size (TLU) 1.3 2.7 4.6
Total annual grain harvest (ton) 0.5 0.9 1.7
Annual additional income (USD) 150 300 500
TLU: tropical livestock unit equivalent to 250 kg live weight; USD: US dollar.
°C (Fenta,2009). The terrain is characterized by undulating chains of mountains.
Unlike the other two farming systems, the use of horses and mules for ploughing cropland is a common practice in this system. In terms of numbers, sheep are the dominant livestock species kept by farm households. Fragmented stone cover on croplands is common and similar to the TMS. Poor soil fertility as a consequence of soil erosion, land degradation and declining land holding is the major problem that poses a challenge to the farming community to sustain its livelihood. Like the other two systems, livestock shows low performance mainly due to feed shortage and health problems such as fasciolosis (particularly in sheep) on wet lowlands.
Determination of LWP
LWP was assessed at a household level across the different farming systems of Gumara watershed by taking 2–3 representative peasant associations (PAs) from each system. Again from each PA, 10 households were selected on a random basis. The sample farmers were then stratified into three wealth categories (resource-poor, - medium and -‘rich’ farmer) based on the perception of their peer colleagues in relation to the households’ relative income, herd size, land holding and annual crop harvest (Table 1). A total of 62 farmers were monitored between November 2006 and February 2008 to collect pertinent data on crop and livestock production using recruited enumerators. In the present study, LWP was determined as the ratio of the total sum of benefits (expressed in monetary value) obtained from livestock production to the amount of water depleted or degraded for producing these benefits (Pedenet al., 2009). For determining the water used in livestock production of the study area, an LCA-based water footprint method was used to account for processes occurring from birth to exit from the farm for the whole herd as described by Koehler (2008) and Peterset al. (2010). The LCA method is a biophysical accounting framework used to characterize the material/energy flows underpinning specific activities and quantify their contributions to resource depletion and emissions-related environmental concerns (Pelletier et al., 2010). In this study, it was used with a frame boundary of cradle to farm gate that enables to invoke the whole continuum of the herd life in accounting for the water use. Hence, the determination of LWP covered the period between birth and end of productive age for breeding stock, while this period was set between birth and time of offtake (slaughter or sale) for non-breeding stock.
Determination of water use
The major water requirement for livestock production is often related to production of animal feed (Pedenet al., 2009). In all the three scenarios of the mixed farming systems, crop residues are used as a key resource for feeding livestock in the long dry season. To quantify the amount of crop residues produced by each farm household, we estimated grain and crop residue yields of cereals (barely, tef, rice, wheat, triticale, finger millet, sorghum and maize) and pulses (faba bean, field pea, chickpea, lentil and grass pea) grown by farmers in each farming system using 1×1 m quadrats. In sampling, 3 quadrats were taken from each field and all the fields were sampled for each crop grown by a household. For estimating the size of cropland allotted to each crop type, we used GPS to define field boundaries.
We partitioned the total metabolizable energy (ME) derived from the feeds consumed by each animal to account for the water portion used in meeting its maintenance requirement as indicated by NRC (2000,2001,2007) and Nsahlaiet al.
(1997). The energy required for walking to allow grazing was also estimated and included in the daily maintenance component.
Biomass productivity of both private and communal pasturelands used by each household was determined by taking representative samples (5–9 samples depending on the size of the pastureland) using 0.5×0.5 m quadrats. Determining biomass of a pasture produced from a hectare of land was required in order to estimate the amount of water used to grow a given amount of pasture. The collected samples of pasture and crop residues were analysed for nutritive value. The amount of supplementary feeds, mainly crop residues, offered to animals at homesteads, was measured throughout the study period. Knowing the energy content and quantity of crop residues offered to each animal by a household, we estimated the amount of pasture intake of each animal from grazing to sustain its live weight and provide output for which the animal is kept. We estimated the amount of feed consumed by each animal over its life cycle through extrapolating the feed intake data collected, in this study, across age classes of the different livestock species. To determine the volume of water used in producing each crop type and pasture, we used the CROPWAT model that employs the Penman–Monteith equation for estimating the reference evapo-transpiration (ETo) as described by Allenet al. (1998). The crop evapo-transpiration (ETc) was determined as the product of ETo by the crop coefficients using specific data (meteorological data, cropping pattern and soil data) inputs required by the CROPWAT8 computer program. Effective precipitation was estimated using the fixed percentage (potential evapo-transpiration/precipitation ratio) method in the CROPWAT model.
The water requirement (m3 ha−1) of each crop and pasture was then calculated from the accumulated ETc (mm d−1) over the complete growing period. We partitioned the total ETc of cereal and pulse crops into the grain and crop-residue components based on their respective local market values (Singh,2004). We estimated drinking water consumed by different livestock species and age classes as described by FAO (1986) over the productive lifetime for the breeding stock and until time of offtake for the non-breeding animals. Water required for cleaning barns, animals,
utensils and others was not estimated in this study. We did not estimate degraded water (water that cannot be recycled for use such as that mixed with acaricide in dipping animals) because of the complexity to quantify it.
Benefits from livestock
In mixed crop/livestock production systems, livestock are kept for multiple purposes. To assess the multiple benefits obtained from livestock in accounting for LWP, we quantified the various products and services rendered by the animals on the farm including the benefit from sale of animals. The estimated benefits were finally converted to monetary values based on their respective market prices to arrive at a combined monetary value. Insurance value from keeping livestock is related to the capital invested in the herd as a guarantee for meeting unexpected expenditures such as medical bills. The benefit from the insurance and financial functions is estimated to increase the value of keeping livestock by up to 7% (Bebe,2003).
Livestock outputs
Livestock outputs in terms of milk production and meat production (animal offtake) were assessed until exit from a farm. Lifetime milk production was estimated through monitoring lactation yields of milking cows and carrying out a survey using questionnaires. Data on reproductive performance of sheep and goats were also collected using questionnaires. Live weight measurements of animals were taken once a month from each household across the three farming systems. Changes in herd or flock size due to birth, death or sale were monitored in each household during the study period. Breeding animals are culled at the end of their productive life by slaughter. Those offspring not required for stock replacement or for another reason are usually sold at the ages of 2 or 4 years in the case of cattle. All households indicated that they sell bulls or heifers according to two offtake scenarios (early offtake at 2 years of age and late offtake at 4 years of age), depending on circumstances at the time.
Therefore, the two offtake scenarios were considered in each household to estimate their corresponding LWP. The reason why only offtake scenarios were considered as an option to improve LWP was because of the scope of the data obtained.
Draught use
Work performance (tillage, threshing and pack transport) of draught animals was monitored throughout the study period by keeping records of daily working hours and by calculating the number of working days in a year. The draught service over the productive age of draught animals was converted into monetary values by multiplying the number of work days by the local daily rate for hiring a pair of oxen or equids.
Manure and urine
Manure nutrient content under smallholder farm management conditions was averaged to be 16.1, 3.6 and 16.8 g kg−1DM for N, P and K, respectively (Lupwayi et al., 2000). Urine contains 0.9% N and 0.5% K on a wet basis while P content is
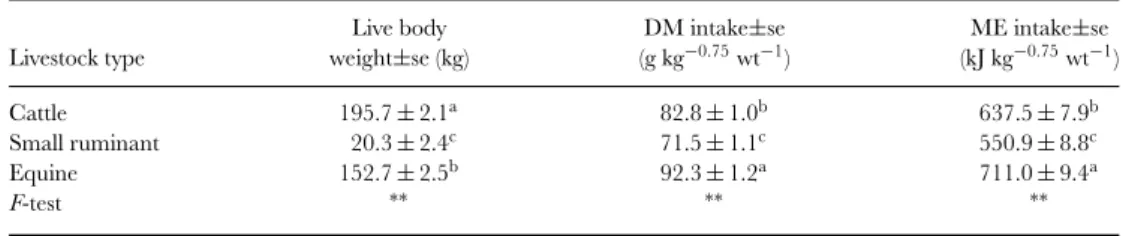
Table 2. Live weight and daily feed consumption of livestock species kept by smallholder farmers in Gumara watershed.
Live body DM intake±se ME intake±se
Livestock type weight±se (kg) (g kg−0.75wt−1) (kJ kg−0.75wt−1)
Cattle 195.7±2.1a 82.8±1.0b 637.5±7.9b
Small ruminant 20.3±2.4c 71.5±1.1c 550.9±8.8c
Equine 152.7±2.5b 92.3±1.2a 711.0±9.4a
F-test ∗∗ ∗∗ ∗∗
DM: Dry matter; ME: metabolizable energy; se: standard error; lwt: live weight;∗∗: significant at 1%; means with different superscript letters in a column are significantly different at the indicated significance level.
reported as trace level (FAO,1992). We estimated the output of urine over the herd life or until offtake using a daily average rate of 31 mL kg−1body weight (FAO,1992) regardless of its disposal site. Manure output was estimated at a rate of 3.3 kg for cattle and 2.4 kg for small ruminant and equine per day per TLU (Haileselassieet al.,2006).
We considered the nutrient price of inorganic fertilizer (Mekonnenet al., 2011) for estimating monetary value of manure and urine to serve as soil amelioration input.
The monetary value of the dung portion used for fuel, estimated at 38% of the total output (Hawando,2000), was assessed based on its market price.
Statistical analysis
The General Linear Model of SAS (2002) was employed to analyse the data. For testing effects of the independent factors on response variables, the statistical model used in the analysis is
Yi jk=μ+Wi+Fj +(W∗F)i j +Ei jk
whereYijk=response variable such as LWP, water use;µ=the overall mean,Wi=ith wealth status of smallholder farmers,Fj =jth farming system, (W∗F)ij =interaction between wealth status and farming system andEijk=error term.
The interaction effect in the model was not found to be significant (p> 0.05) in all the cases and hence was left out. A groupt-test procedure was run to compare the means of LWP between early offtake and late offtake using Satterthwaite’s approximation for unequal variances (SAS,2002). A separate analysis was also carried out to test the effect of livestock species on dry matter, metabolizable energy intakes and LWP.
R E S U L T S
Livestock performance
Small ruminants had a lower (p<0.01) daily dry matter intake per kg of metabolic body weight than both cattle and equine (Table 2). Hence, the ME used per kg of metabolic body weight was significantly lower (p<0.001) in small ruminants than in cattle reflecting their lower metabolic rate. The proportion of cattle (on a weight basis) out of the total TLU kept by a household tended to inversely relate with altitude, this
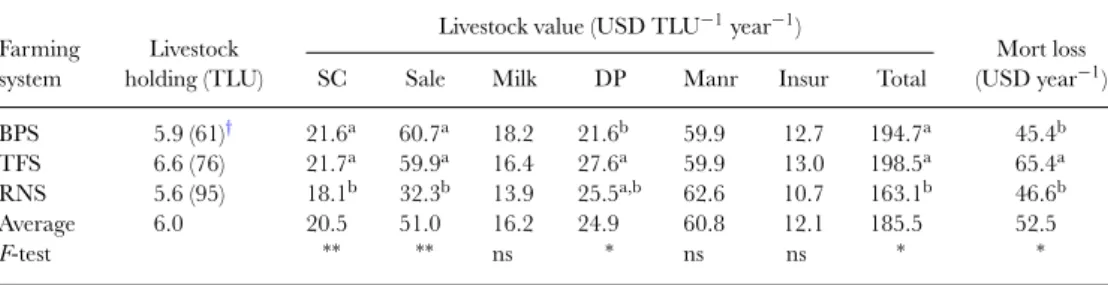
Table 3. Livestock holding and values of livestock outputs at a household level in three mixed farming systems.
Livestock value (USD TLU−1year−1) Farming
system
Livestock
holding (TLU) SC Sale Milk DP Manr Insur Total
Mort loss (USD year−1)
BPS 5.9 (61)† 21.6a 60.7a 18.2 21.6b 59.9 12.7 194.7a 45.4b
TFS 6.6 (76) 21.7a 59.9a 16.4 27.6a 59.9 13.0 198.5a 65.4a
RNS 5.6 (95) 18.1b 32.3b 13.9 25.5a,b 62.6 10.7 163.1b 46.6b
Average 6.0 20.5 51.0 16.2 24.9 60.8 12.1 185.5 52.5
F-test ∗∗ ∗∗ ns ∗ ns ns ∗ ∗
†Number in parenthesis represents percent share of cattle in TLU on live weight basis; TLU: tropical livestock unit equivalent to 250 kg live weight; USD: US dollar; SC: represents the livestock capital kept at farm; Sale: return from sale of live animal; DP: draught power; Manr: manure; Insur: insurance value of keeping stocks; Mort loss: mortality loss;∗∗: significant at 1%;∗: significant at 5%; ns: not significant; means with different superscript letters in a column are significantly different at the indicated significance level.
being manifested by a higher number of cattle in the RNS than in the BPS (Table 3).
Of all the livestock outputs, larger returns (USD TLU−1year−1) were obtained from manure used as fertilizer and sale of live animals. The return from draught power use was also considerable, amounting to about 14% of the monetary value derived from livestock. The benefit from milk production in monetary terms seemed to be among the lowest although its contribution in improving the nutritional intake of the poor rural family mainly of the children is invaluable. Monetizing the value of insurance function of the traditional livestock production by smallholder farmers appeared to raise the total livestock benefit by 6% (Table 3). Nonetheless, mortality incidence was found to reduce the total return from livestock production by 28% annually on average (Table 3).
Water productivity
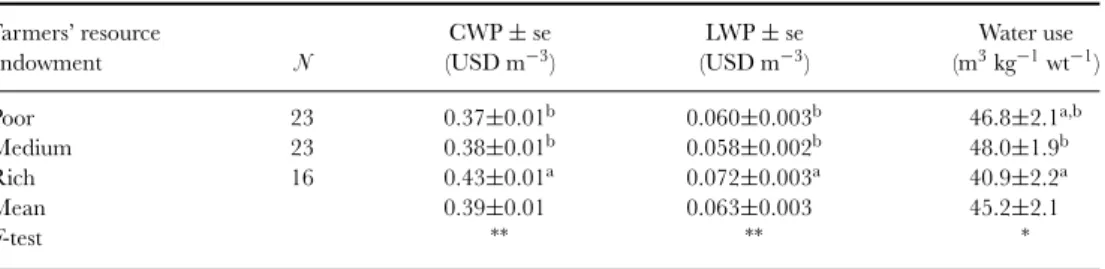
In Gumara watershed, smallholder farmers cultivated diverse crops owing to heterogeneity in farm conditions and spreading the risk of crop failure. Combining the benefits of these crops together in monetary terms, RNS showed a higher CWP (p < 0.01) with a value of 0.46 USD m−3 of water than both BPS and TMS (Table 4). In contrast, LWP was found to be significantly lower (p< 0.01) in RNS (0.057 USD m−3 water) than in TMS (0.066USD m−3 water) or in BPS (0.066 USD m−3water). This indicates that water requirement per kg live weight of animal increased towards lower altitude areas implying more water loss in RNS. As a result, 20% additional water input was required to sustain each kg of live weight of livestock in RNS as compared to BPS in the upper reach of the watershed. CWP was superior to LWP across the mixed farming systems of Gumara watershed. Wealth status of a household appeared to affect both crop and livestock water productivities (Table 5).
Only ‘rich’ farmers were able to attain both higher CWP and LWP.
A cattle herd management strategy that pursued early offtake increased LWP by 28% over that of late offtake (Table 6). The amount of water used per kg live weight of the animal over its entire lifetime was much lower (reduced by more than 50%) in
Table 4. Least-squares means of crop water productivity, LWP and water used to sustain a kilogram of live weight of livestock under three different mixed farming systems.
Farming Pasture yield CWP±se LWP±se Water use±se
system N (DM t/ha) (USD m−3) (USD m−3) (m3kg−1lwt)
BPS 23 3.35 0.33±0.01c 0.066±0.002a 42.4±1.9a
TMS 27 3.02 0.38±0.01b 0.066±0.002a 42.7±1.7a
RNS 12 3.50 0.46±0.01a 0.057±0.003b 50.6±2.5b
Mean 3.29 0.39±0.01 0.063±0.003 45.2±2.0
F-test ∗∗ ∗∗ ∗
CWP: economic crop water productivity of various crops grown by a household combined together in monetary value per unit of water input; LWP: livestock water productivity;∗∗: significant at 1%;∗: significant at 5%; means with different superscript letters in a column are significantly different at the indicated significance level.
Table 5. Least squares means of CWP, LWP and water use per kg live weight of livestock by wealth status of smallholder farmers in Gumara watershed.
Farmers’ resource CWP±se LWP±se Water use
endowment N (USD m−3) (USD m−3) (m3kg−1wt−1)
Poor 23 0.37±0.01b 0.060±0.003b 46.8±2.1a,b
Medium 23 0.38±0.01b 0.058±0.002b 48.0±1.9b
Rich 16 0.43±0.01a 0.072±0.003a 40.9±2.2a
Mean 0.39±0.01 0.063±0.003 45.2±2.1
F-test ∗∗ ∗∗ ∗
CWP: economic crop water productivity of various crops grown by a household combined together in monetary value per unit of water input; LWP: livestock water productivity;∗∗: significant at 1%;∗: significant at 5%; means with different superscript letters in a column are significantly different at the indicated significance level.
Table 6. Means of LWP, income from sale of live animal and water use to sustain a kilogram of live weight of cattle under two offtake scenarios.
Offtake LWP±se Sale income±se Water use±se
type N (USD m−3) (USD TLU−1) (m3kg−1wt−1)
Early 62 0.09±0.003 272.2±2.3 13.2±0.6
Late 62 0.068±0.001 265.3±1.2 29.6±1.0
Mean 0.079±0.002 268.7±1.7 21.4±0.8
t-test ∗∗ ∗∗ ∗∗
LWP: livestock water productivity;∗∗: significant at 1%.
the early offtake scenario than in the late offtake. Contrasting the income from sale of animals per TLU, early offtake gave a higher return than late offtake.
D I S C U S S I O N
LWP and its methodology
Water productivity is a useful concept to gauge the extent of water depleted for agricultural production and identify interventions to improve water use efficiency.
This is important because water has become a very scarce resource (Moldenet al., 2010) and food production is increasingly constrained by water shortage (Wallace,
2000). Regarding its application to livestock production, the concept of LWP as first developed by Peden et al. (2009) helps to clearly understand the interaction between livestock and water including its implications for the production environment (e.g. water contamination from livestock wastes and degraded water). Estimating LWP is a complex exercise as it requires data on the performance of livestock and conversion of all livestock outputs/utilities to monetary values using contemporary price indices. In Ethiopia, smallholder farmers do not keep performance records for their animals. The challenges encountered in obtaining complete performance data of animals, on a long term basis, might have caused some degree of uncertainty to precisely determine LWP in our study. Furthermore, capturing all the intangible values of keeping livestock in the study area was challenging although we attempted to monetize insurance value of livestock (Bebe,2003). In a similar study, Moll (2005) also highlighted the difficulty in monetizing the intangible values (accumulation of wealth, security against contingencies, display of status and others) of livestock production in sub-Saharan Africa. Hence, caution must be taken when comparing LWP values across countries or regions because of variability in production targets and in market prices of livestock outputs or services.
The methodology for quantifying the amount of water used to produce animal feeds should be refined and standardized based on the goals of livestock production.
To have a realistic estimate of water depletion in livestock production, it is necessary to assess the feed intakes of different livestock species from birth to farm gate and the source of feeds in all steps of the production. Since animal feed accounts for more than 95% of the water portion required in livestock production (Pedenet al.,2009), proper estimation of the feed consumed by livestock is a determining factor for reaching reliable LWP values. In the present study, the water input from feed consumption (through grazing and supplementary feeding) of each animal was assessed from birth to farm gate using an LCA method. Our estimation of the total consumptive water used in livestock production is subject to some uncertainty due to the absence of intake data mainly from grazing. When feed intake does not meet the energy requirement of an animal, metabolic energy is derived from animals’ body fat, protein and glycogen for example to allow on-going production of milk. However, we found it difficult to have a complete account of the energy portion derived from metabolism of the stored energy that causes body weight loss of animals.
In Gumara watershed, LWP ranged from as low as 0.03 to as high as 0.1 USD m−3 water across the different agro-ecologies. These figures appear to be low compared to those of CWP (0.2–0.6 USD m−3) obtained from the same domain. The implication is that the intrinsic feature of livestock production makes the enterprise to be more water intensive. The reasons for this are complex and context specific. However, the necessity for an animal to first pass through a long growing period in its life cycle (retarded growth at early age due to poor management in the study area) to reach its productive age is worth mentioning as one of the main reasons for low LWP. Contrary to CWP, LWP was lower in RNS than in BPS or TMS (Table 4). The reason could be associated with ETc and livestock management. RNS area has a warmer climate, and hence the ETc required for both pasture and crop production was higher than in
the upper catchment of the study area. The higher CWP in RNS may also have been due to its prevailing double cropping practice and better access to market linkages in relative terms.
In agreement with our results, Haileselassieet al. (2011) reported LWP estimates of 0.03–0.12 USD m−3water for Indo-Ganga basin, and Breugelet al. (2010) calculated 0.01–0.13 USD m−3water for different farming systems in the Nile Basin. Similarly, Mekonnen et al. (2011) and Descheemaeker et al. (2011) also showed comparable values of LWP for water stressed environments of northern Ethiopia with a narrower range between 0.07 and 0.09 USD m−3water. However, the reports by Gebreselassie et al. (2009) and Haileselassie et al. (2009) found much higher estimates of LWP ranging between 0.25 and 0.39 USD m−3 water. This divergence might have arisen from methodological differences to determine LWP. In the previous studies, the determination of LWP was limited to data of one year, which accounts for only partial input/output of the livestock production without accounting for the water inputs used in raising the animals to reach their productive age. In contrast, the present study applied the LCA method (Peterset al.,2010) to drive water footprints for estimating the total water depleted in livestock production by setting the limits from birth to farm gate. We also included the consumptive water accounted to those animals that exited the farm due to death.
LWP in Gumara watershed could be improved provided that appropriate interventions can be employed. In supporting this view, Molden et al. (2010) indicated that areas where poverty is high and water productivity is low are among the priority areas where substantive increase in water productivity is possible.
Furthermore, a theoretical ex-ante analysis done by Descheemaeker et al. (2011) for smallholder mixed crop-livestock systems of Ethiopia indicated that LWP could be tripled (to about 0.17 USD m−3 water) on the same landholding by combining different potential intervention options related to improving feed, water and livestock managements, and applying them together.
Livestock outputs and services
Manure application for sustaining soil fertility is featured as a key ecosystem component in nutrient cycling models of agricultural systems (Murwiraet al., 1995).
Currently, the Ethiopian government has paid more attention than ever before on extending the use of compost (from manure and plant biomass) by smallholder farmers. In the present study, manure and draught power made up a considerable share of the total monetary value obtained from livestock component (Table 3). The higher value of draught power in TMS might be associated with the need for intensive tillage to make a fine seedbed for small seeded cereals like tef. It can, thus, be noted that the overriding reason to keep livestock as an integral part of the mixed farming system is to provide the necessary inputs required for crop production. This leads to a tradeoff between improving livestock outputs per animal and keeping more animals to support crop production (for ploughing, compacting and threshing) against a background of critical feed shortage.
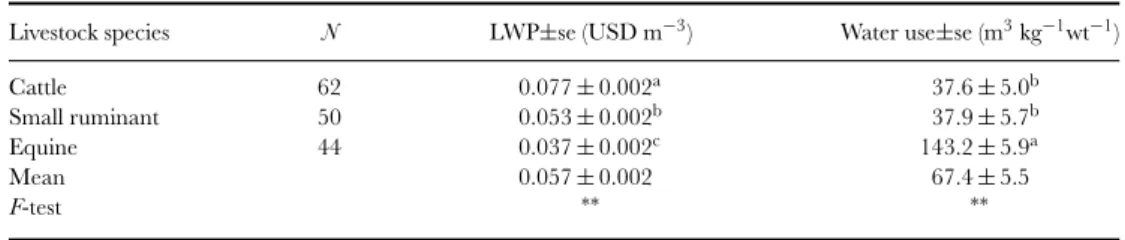
Table 7. Least squares means of LWP and water use to sustain a kilogram of live weight of different livestock species over their productive life time.
Livestock species N LWP±se (USD m−3) Water use±se (m3kg−1wt−1)
Cattle 62 0.077±0.002a 37.6±5.0b
Small ruminant 50 0.053±0.002b 37.9±5.7b
Equine 44 0.037±0.002c 143.2±5.9a
Mean 0.057±0.002 67.4±5.5
F-test ∗∗ ∗∗
LWP: livestock water productivity;∗∗: significant at 1%; means with different superscript letters in a column are significantly different at the indicated significance level.
In the tropics, livestock productivity is greatly reduced by poor husbandry practices coupled with animal health problems. In this study, we estimated mortality incidence at a rate of 10% in equids, 14% in cattle and 20% in small ruminants, affecting mainly young stock. Consequently, its cumulative effect on reducing the benefits (in monetary value) from livestock reached as high as 28% in the present study.
Agreeing with these results, Gizaw et al. (2010) reported mortality of sheep to be 17–26% under traditional management practices of smallholder farmers in Ethiopia.
So, interventions that target improved livestock health would considerably contribute to increasing productivity of livestock and water. Feed utilization efficiency of livestock seems to correlate with LWP. Cattle had higher LWP than equids (Table 7) since they provide more products and have better digestion efficiency (Udén and Van Soest 1982) when utilizing low-quality feedstuffs of the type commonly available in the study area.
Livestock offtake
Time of offtake of livestock appeared to have a significant influence on LWP.
Prolonging the time to offtake of those animals not required for replacement to about 4 years of age or above would unnecessarily add to the cost of their maintenance resulting in lower LWP. Farmers opt to keep extra animals for longer years to exploit their uses in asset accumulation, prestigious social values, threshing crop harvests and others. However, the cost of inputs (in terms of feed consumption and water use) for keeping these extra animals beyond 2 years seemed to be relatively high although their market prices would appear to slightly rise as compared to those of their younger counterparts. Nowadays in Ethiopia, consumers are more concerned about the quality of meat and hence, livestock traders prefer buying younger animals from producers to sell them at a better price relative to their keeping cost. Promoting the offtake of younger cattle is also beneficial for encouraging the beef industry in Ethiopia to target the export market of the Middle East countries. Negassa and Jabbar (2008) illustrated the need for incentivizing smallholder farmers to induce the supply of young animals to market and this in turn would contribute to alleviation of the overstocking problem in the highlands of Ethiopia.
C O N C L U S I O N
The LWP determined for Gumara watershed was 0.063 USD m−3 water on average and showed wide variation between households across the farming systems.
The prospect for improving LWP is considerable in light of the present growing aspiration pursued by the Ethiopian government to fuel agricultural development in the country, for instance, through keeping only productive animals, increasing pasture productivity, improving the utilization of other feed sources and linking the production goals to market demands. The interventions targeting early offtake proved to substantially increase LWP and this would contribute to ease the imbalance between the existing high livestock population and the deteriorating carrying capacity of natural pasture.
Acknowledgements. The authors would like to thank the CGIAR Challenge Program on Water and Food (CPWF) for financially supporting this study. We are grateful to the two anonymous reviewers for their immense contribution to improve the paper.
We would like to thank Dr. Alan Duncun for helping us in editing the paper. Finally, our gratitude goes to the farmers in the study area for their participation and resource commitment.
S U P P L E M E N TA RY M AT E R I A L
For supplementary material for this article, please visit https://doi.org/10.1017/
S0014479717000321.
R E F E R E N C E S
Abereham, A. (2013). Watershed modelling and uncertainty analysis on Gumara watershed. M.Sc. thesis, Addis Ababa University, Ethiopia, 96.
Allen, R. G., Pereira, L. S., Raes, D. and Smith, M. (1998). Crop evapo-transpiration guidelines for computing crop water requirements. FAO Irrigation and Drainage Paper 56.
Bebe, B. O. (2003). Herd dynamics of smallholder dairy in the Kenyan highlands. Ph.D. thesis, Wageningen University, The Netherlands.
Breugel, P. V., Herrero, M., de Steeg, J. V. and Peden, D. (2010). Livestock water use and productivity in the Nile Basin.Ecosystems13:205–221.
Descheemaeker, K., Amede, T. and Haileselassie, A. (2010). Improving water productivity in mixed crop-livestock farming systems of sub-Saharan Africa.Agricultural Water Management97:579–586.
Descheemaeker, K., Amede, T., Haileselassie, A. and Bossio, D. (2011). Analysis of gaps and possible interventions for improving water productivity in crop livestock systems of Ethiopia.Experimental Agriculture47(S1):21–38.
FAO (1986). Natural resource management and environment department. FAO Corporate Document Repository, Rome, Italy.
FAO (1992). Sustainable livestock production in the mountain agro-ecosystem of Nepal. FAO Animal Production and Health Paper No. 105, Rome, Italy.
Fenta, D. (2009). Satellite remote sensing for soil moisture estimation, Gumara catchment, Ethiopia. M.Sc. thesis, International Institute for Geo-Information Science and Earth Observation, Enschede, The Netherlands.
Gebreselassie, S., Peden, D., Haileselassie, A. and Mpairwe, D. (2009). Factors affecting livestock water productivity:
Animal scale analysis using previous cattle feeding trials in Ethiopia.The Rangeland Journal31:251–258.
Gizaw, S., Tegegne, A., Gebremedhin, B. and Hoekstra, D. (2010). Sheep and goat production and marketing systems in Ethiopia: Characteristics and strategies for improvement. IPMS (Improving Productivity and Market Success) of
Ethiopian Farmers Project Working Paper 23. ILRI (International Livestock Research Institute), Nairobi, Kenya, 58p.
Haile, A., Joshi, B.K., Ayalew, W., Tegegne, A. and Singh, A. (2009). Genetic evaluation of Ethiopian Boran cattle and their crosses with Holestein Friesian in central Ethiopia: Milk production traits.Animal3:486–493.
Haileselassie, A., Blummel, M., Clements, F., Descheemaeker, K., Amede, T., Samireddypalle, A., Sreedhar Acharya, N., Venkatar Radha, N., Ishaq, S., Samad, M., Murty, M. V. R. and Khan, M. A. (2011). Assessment of the livestock-feed and water nexus across a mixed crop-livestock system’s intensification gradient: An example from the Indo-Ganga basin.Experimental Agriculture47(S1):113–132.
Haileselassie, A., Peden, D., Gebreselassie, S., Amede, T. and Descheemaeker, K. (2009). Livestock water productivity in mixed crop–livestock farming systems of the Blue Nile basin: Assessing variability and prospects for improvement.Agricultural Systems102:33–40.
Haileselassie, A., Priess, J., Veldkamp, E. and Lesschen, J. P. (2006). Smallholders’ soil fertility management in the central highlands of Ethiopia: Implications for nutrient stocks, balances and sustainability of agroecosystems.
Nutrient Cycling in Agroecosystems75:135–146.
Hawando, T. (2000). Desertification in Ethiopian highlands. RALA Report No. 200, 75–86.
Koehler, A. (2008). Water use in LCA: Managing the planet’s fresh water resources.International Journal of Life Cycle Assessment13:451–455.
Lupwayi, N. Z., Girma, M. and Haque, I. (2000). Plant nutrient contents of cattle manures from small-scale farms and experimental stations in Ethiopian highlands.Agriculture, Ecosystems and Environment78:57–63.
Mekonnen, S., Descheemaeker, K., Tolera, A. and Amede, T. (2011). Livestock water productivity in a water stressed environment in northern Ethiopia.Experimental Agriculture47(S1):85–98.
Molden, D., Oweis, T., Steduto, P., Bindraban, P., Hanjra, M. and Kijne, J. (2010). Improving agricultural water productivity: Between optimism and caution.Agricultural Water Management97:528–535.
Moll, H. A. J. (2005). Costs and benefits of livestock systems and the role of market and non-market relationships.
Agricultural Economics32:181–193.
Murwira, K. H., Swift, M. J. and Frost, P. G. H. (1995). Manure as a key resource in sustainable agriculture. InLivestock and Sustainable Nutrient Cycling in Mixed Farming Systems of Sub-Saharan Africa, vol. II: Technical Papers. Proceedings of an International Conference held in Addis Ababa, Ethiopia, 22–26 November, 1994, 131–148 (Eds J. M. Powell, S. Fernandez-Rivera and T. O. Williams), Addis Ababa, Ethiopia: ILCA (International Livestock Centre for Africa).
National Research Council (NRC) (2007).Nutrient Requirements of Horses, 6th revised edn. Washington DC, USA:
National Academy Press.
Negassa, A. and Jabbar, M. (2008). Livestock ownership, commercial off-take rates and their determinants in Ethiopia. Research Report 9. International Livestock Research Institute, Nairobi, Kenya.
NRC (2000). Nutrient Requirements of Beef Cattle, 7th revised edn., update 2000, Washington DC, USA: National Academy Press.
NRC (2001).Nutrient Requirements of Dairy Cattle. 7th revised edn. Washington DC, USA: National Academy Press.
Nsahlai, I. V., Osuji, P. O. and Umunna, N. N. (1997). Digestible organic matter requirements of Ethiopian Menz sheep: Model and application.Journal of Applied Animal Research11:83–100.
Peden, D., Taddesse, G. and Haileslassie, A. (2009). Livestock water productivity: Implications for sub-Saharan Africa.
The Rangeland Journal31:187–193.
Pelletier, N., Lammers, P., Stender, D. and Pirog, R. (2010). Life cycle assessment of high- and low-profitability commodity and deep-bedded nich swine production systems in the Upper Midwestern United States.Agricultural Systems103:599–608.
Peters, G. M., Wiedemann, S. G., Rowley, H. V. and Tucker, R. W. (2010). Accounting for water use in Australian red meat production.The International Journal of Life Cycle Assessment15:311–320.
SAS (2002).Statistical Analysis System, STAT User’s Guide, Version 9. Cary, NC, USA: SAS Institute, Inc.
Singh, O., Sharma, A., Singh, R. and Shah, T. (2004). Virtual water trade in dairy economy. Irrigation water productivity in Gujarat.Economical and Political Weekly39:3492–3497.
Steinfeld, H., Gerber, P., Wassenaar, T., Castel, V., Rosales, M. and de Haan, C. (2006).Livestock’s Long Shadow:
Environmental Issues and Options, 377. Rome, Italy: Food and Agriculture Organization (FAO).
Tamene, L. and Vlek, P. (2008). Soil erosion in Ethiopia: Patterns, determinants and management implications.
InImpact of Land Use Change on Soil Resources, 73–100 (Eds A. K. Braimoh and P. L. G. Vlek). Dordrecht, The Netherlands: Springer Science 7 Business Media B.V.
Udén, P. and Van Soest, P. J. (1982). Comparative digestion of timothy (Phleurn pratense) fibre by ruminants, equines and rabbits.British Journal of Nutrition41:267–272.
Wallace, J. S. (2000). Increasing agricultural water use efficiency to meet future food production.Agriculture, Ecosystems and Environment82:105–119.
Zhang, X., Zwiers, F. W., Hegerl, G. C., Lambert, F. H., Gillett, N. P., Solomon, S., Stott, P. A. and Nozawa, T. (2007).
Detection of human influence on twentieth-century precipitation trends.Nature448:461–466.