Explaining Failures of Microfinance Institutions
Gregor Dorfleitnera,b,∗, Michaela Leidla, Christopher Pribernya
aDepartment of Finance, University of Regensburg, 93040 Regensburg, Germany
bCERMi (Centre for European Research in Microfinance), Belgium
Abstract
We empirically study the determinants of failures of microfinance institutions based on the CAMELS rating components and microfinance-specific measures by applying probit regression techniques. Our findings confirm the capital ade- quacy (C), the asset quality (A), the management capability (M), the earnings (E), and the sensitivity to market risk (S) as explaining factors of failures of microfi- nance institutions. Regarding microfinance-specific effects, there is a positive in- fluence of the percentage of female borrowers on the likelihood of failure. More- over, we find evidence that regulation, the presence of donations, and the rapid growth of an MFI affect the probability of failure.
Keywords: microfinance, MFI failure, CAMELS, regulation, gender JEL:G21, G23, G32, L26
Acknowledgements
We thank the German Research Foundation (DFG), which provided finan- cial support for the project ‘Ökonomische Analyse der Refinanzierung von Mikrokreditvergabe’ (AR 530/1-1).
∗Corresponding author. Tel.: +49 941 943 2683; fax: +49 941 943 4608.
Email addresses:gregor.dorfleitner@ur.de(Gregor Dorfleitner),
michaela.leidl@ur.de(Michaela Leidl),christopher.priberny@ur.de(Christopher Priberny)
1. Introduction
The myth that microfinance institutions (MFIs) operate successfully even without proper management structures has persisted for a long time (Armendáriz and Morduch, 2010, p. 347). However, Armendáriz and Morduch (2010) argue that efficient management structures are of great importance regarding the success or failure of an MFI. Their view is supported by a more frequent observation of MFI failures after the financial crisis of 2008/2009 due to poor portfolio quality or weak management (see e.g. Rozas, 2009, 2011).
MFIs differ from standard banks. They mainly operate in developing countries granting loans to poor entrepreneurs, often without any collateral. Bruton et al.
(2013) stress the importance of entrepreneurship as a tool for poverty reduction.
However, sufficient amounts of funding required to operate their businesses are unavailable for many microentrepreneurs. Contrary to commercial banks, MFIs are willing to meet the financing needs of microenterprises (see Khavul et al., 2013, p. 31).
Many MFIs focus on female clients. Moreover, in microfinance, various or- ganizational types can be found. Not all MFIs are organized as banks, but as non-bank financial institutions (NBFIs), credit unions, or non-governmental orga- nizations (NGOs), to name the most important possibilities. Another important difference between standard banks and MFIs is that not every MFI is allowed to collect deposits. Furthermore, as many MFIs pursue a social mission they often receive donations. As a consequence, insights on bank failures from traditional banking literature may not be applicable to MFIs. Deepening the knowledge on failures of MFIs is therefore crucial for regulators, investors, depositors, microen- trepreneurs, and other stakeholders of these institutions. This article is the first to
investigate the failures of MFIs systematically.
For our analysis, we use annual balance sheet and income statement data on 1,797 MFIs in 117 countries from 1995 until 2011, which we replenish with infor- mation regarding financial distress derived from extensive online investigations.
To detect failed MFIs, we examine breaks in the data history. We identify doc- umented failures, e.g., MFIs that have been closed by a legal authority due to bankruptcy, defaulted on a loan, undergone a restructuring process, or were forced to merge with another MFI due to financial distress.
In banking literature, there is a vast body of evidence that can be found on bank failures. Many investigations focus on US banks and use the CAMEL(S) rating components as exogenous variables. CAMELS is an acronym for capital adequacy, asset quality, management capability, earnings, liquidity, and sensitivity to market risk. While older studies focus on the five CAMEL rating components, more recent analyses (e.g., Kerstein and Kozberg, 2013) often employ the sen- sitivity to market risk as an additional element as well. For example, Thomson (1991) examines predictors of bank failures for the period from 1982 until 1989, basing his proxy variables on the elements of the CAMEL rating. Using balance sheet and income statement data, he conducts a logit regression for subsamples regarding the time to failure and detects several predictors for bank failure. For example, the return on assets of a bank serves as a predictor for failure. Banks with a lower return on assets are more likely to fail. The definition for bank fail- ure varies across different studies. In addition to bank failures, Wheelock and Wilson (2000) investigate acquisition hazards using a hazard model in the period from 1984 until 1993. Furthermore, they use two definitions of failure. The first definition regards the closure of a bank by the regulatory authority and the second
definition expands the first definition by including banks with a ratio of total eq- uity less goodwill to total assets of less than or equal to two percent. The findings of Wheelock and Wilson (2000) also show a significant negative influence of the return on assets on failure. Jin et al. (2011) explore the accounting and the audit quality as predictors for bank failures, which they detect by examining a list pub- lished online by the Federal Deposit Insurance Corporation and find a negative relationship between the reputation of the auditor and failure.
There are also studies analysing bank distress outside the United States. For example, Arena (2008) explores bank failures in nine East Asian countries for the period from 1995 until 1999 and six Latin American countries for the period from 1992 until 1996 using a cross-sectional multivariate logit model. His defi- nition of failure again differs from the previously mentioned studies. Männasoo and Mayes (2009) investigate 19 Eastern European transmission economies for the period from 1995 until 2004 by applying a survival model. Moreover, they provide a brief summary of further studies on bank failures (e.g., Whalen, 1991;
González-Hermosillo et al., 1997) including the various definitions for bank fail- ures or distress. The findings of the studies described by Männasoo and Mayes (2009) are similar. The capital asset ratio, the earnings variables, and the liquidity ratio appear to be negatively related to failure and there is a positive relationship between the measures for asset risk and failure.
In microfinance literature, to our knowledge Rozas (2009) and Rozas (2011) are the only studies to describe MFI failures in a case study style. In both studies, the author reveals several reasons for the failing of MFIs, such as fraud by the managers or a growth that is too rapid. Furthermore, there is some literature on aspects related to the failure of MFIs, e.g. the management of MFIs and the fi-
nancial performance (see, e.g., Hudon, 2010), the governance (see, e.g., Mersland and Strøm, 2009), or MFI ratings (see, e.g., Beisland and Mersland, 2012).
Other previous research in the field of microfinance investigates several effects of different measures on performance indicators, e.g., financial revenue, sustain- ability, outreach or the portfolio quality of MFIs. D’Espallier et al. (2011) exam- ine whether MFIs with a focus on female borrowers exhibit a better repayment performance. They analyse a global data set on rating data of 350 MFIs via panel regressions. Their findings demonstrate that MFIs with a larger share of female borrowers exhibit a better asset quality in terms of portfolio at risk, loan write-off rate, and provision expense rate. Tchakoute-Tchuigoua (2010) investigates perfor- mance differences between MFIs with a different legal status. His results indicate that the portfolio at risk of private companies is significantly lower than it is for cooperatives and NGOs. Furthermore, Assefa et al. (2013) examine the effect of competition, measured by a self-constructed Lerner index, on performance indi- cators. Their results show a positive relationship of competition with the portfolio at risk and the write-off ratio. Baquero et al. (2012), who examine the influence of competition, observe contradictory results on micro loan interest rates and the portfolio at risk. They reveal that the portfolio at risk of for-profit MFIs is lower in more competitive markets. Dorfleitner et al. (2013) examine determinants of microcredit interest rates and find a positive relationship between the loan loss rate and the lending rate charged by MFIs from their borrowers.
The contribution of this article is twofold. First, we investigate whether the findings from the standard banking literature (mainly the CAMELS components) can be confirmed when explaining failures of MFIs. Our results suggest that sev- eral bank-specific variables identified to determine failures in the traditional bank-
ing literature also explain failures of MFIs, e.g., capital adequacy and portfolio quality. Second, due to the difference between traditional banks and MFIs, we also analyse the microfinance-specific determinants of MFI failures. For exam- ple, we find that a higher fraction of female borrowers is associated with a higher probability of failure.
The remainder of this article is structured as follows. Section 2 describes the data, hypotheses, and methodology. Section 3 presents the results. It contains detailed descriptive statistics, several probit models, robustness checks, and dis- cusses the results by comparing our findings with previous research on traditional banks. Finally, Section 4 concludes and provides suggestions for further research.
2. Data and methodology
2.1. Data
Data sources. Our data set combines three data sources. Data concerning MFIs were obtained from the Microfinance Information Exchange (MIX) through the web-based information platform MIX Market, which makes a variety of self- reported indicators from MFIs openly available. However, these data lack cru- cial measures such as donations received by MFIs. Therefore, we include data on MFI income statements that were also obtained from MIX. As we addition- ally wish to control for the influence of country-specific effects on MFI failures, we add macroeconomic indicators obtained from the World Bank. All three data sources consist of panel data on an annual basis for the period between 1995 and 2011. Due to data inconsistencies, we carefully clean the data obtained from the MIX Market from unrealistic values, for example, a portfolio at risk, share of fe- male borrowers, average loan size, asset value or liquid assets smaller than zero,
replacing them with missing values.
Identifying failures. Additionally, information on MFI failures was collected through extensive online research. As of January 2013, 964 out of 2,370 MFIs ceased reporting to MIX Market at some point in time. The change in this report- ing behaviour could either be attributed to a merger or a failure of the MFI or it stopped reporting for other reasons, e.g., lack of personnel or time. We analysed the reasons for the break in the reporting history of every MFI that stopped report- ing to MIX Market. We classify these MFIs as failed, non-failed, and unsolved with respect to a reference year and in accordance with the two failure definitions shown in Section 2.2. The reference year is the point in time with a failure indica- tion, i.e., the breaks in the reporting history. The classification algorithm is shown in the Appendix. We exclude the 264 MFIs whose situation remains unsolved from the analysis, when we analyse the strict definition of failure. Section 2.2 provides detailed descriptions of both definitions of failure.
Cross-sectional indicators. Although panel data are available, the implementa- tion of panel regression techniques is not suitable due to the limited number of failures. Therefore, we construct cross-sectional indicators for all variables of in- terest by aggregating the MFI’s data over the last three years – but over a minimum of 2 years – available before the reference year, by using the average value. We regard institutions reporting an average loan size larger than 15,000 USD as not being focused on microfinance. To avoid distortion, we exclude the corresponding observations from the data set.
2.2. Definitions of failure
The strict definition (FAILURE1), which we employ for our main analyses, comprises documented failures. Therefore, we investigated extensively, mainly via online research, whether the reason for the discontinued data history of an MFI was a merger or a failure. MFIs are categorized as having failed if they were actually liquidated by a legal authority due to bankruptcy, defaulted on a loan or were merged with other MFIs after financial distress. Financial distress is indicated by a capital asset ratio of less than or equal to two percent. Merged MFIs with a capital asset ratio of more than two percent are not regarded as having failed according to our strict definition. Additionally, we found nine MFIs that underwent restructuring and continued reporting afterwards. These MFIs also fall into the category of failed MFIs. The category of non-failed includes those MFIs that are no longer engaged in microfinance after ceasing to report to MIX or those MFIs who represent temporary microfinance projects that were expectedly terminated.
As a robustness check, we explore an additional extended definition of failure (FAILURE2) following Wheelock and Wilson (2000). According to this defini- tion, an MFI is regarded as non-failed, if it reports a capital asset ratio of more than two percent in the last year with data available in the data history on MIX Market between 1995 and 2011. Consequently, an MFI is categorized as having failed if the MFI has a capital asset ratio of less than or equal to two percent in the last year it reported upon. In these cases, we anticipate the time of failure to be the point in time at which the capital asset ratio first falls below the mentioned threshold and does not recover afterward. If the capital asset ratio time series of an MFI consists only of values below the threshold, we cannot determine the year
of the anticipated failure and consequently exclude this MFI from the sample.
The extended definition additionally includes all MFIs that failed according to the strict definition.
Since both failure definitions require information on the capital asset ratio, which is also an explanatory variable (see below), we generally apply the follow- ing principle: For each MFI we decide whether a failure or a non-failure has been observed at some point in time. To explain these events in the regression ana- lyses, we strictly use variables from at least one year before the observed failure or non-failure. While, due to this procedure, we lose some observations because of inadequately short time series before the anticipated or actual failure event, its benefit is that the regression analyses do not suffer from self-inflicted endogeneity.
Dependent on the failure definition applied, the data used to calculate the cross sectional indicators also vary for some MFIs. Hence, we distinguish between the two data sets FAILURE1 data and FAILURE2 data referring to the failure defi- nition that is used to determine failures in the data. Table 1 presents the number of MFIs per country and the number of failed MFIs according to the strict and extended definition of failure. Note that the distribution of the observations over the countries is very imbalanced.
2.3. Explanatory variables and hypotheses
As the aim of this paper is to investigate whether the CAMELS components explain failures of MFIs and to determine additional microfinance-specific fac- tors, we follow the traditional bank failure literature (e.g., Thomson, 1991; Arena, 2008; Männasoo and Mayes, 2009) and additionally include microfinance-specific variables to derive the possible determinants of failure.
As a proxy for capital adequacy, we use the capital asset ratio. We would
Table 1: Number of MFIs per country and number of failures according to the strict (FAILURE1) and extended (FAILURE2) definition.
No. MFIs No. MFIs
FAILURE1 FAILURE2 FAILURE1 FAILURE2
Country total failed total failed Country total failed total failed
Afghanistan 17 4 17 6 Macedonia 4 0 4 0
Albania 6 0 6 0 Madagascar 13 0 12 0
Angola 2 0 2 0 Malawi 6 0 7 0
Argentina 18 0 17 0 Malaysia 1 0 1 0
Armenia 12 0 13 0 Mali 16 1 17 2
Azerbaijan 24 0 22 0 Mexico 66 1 64 1
Bangladesh 72 0 61 2 Moldova 4 0 4 0
Belarus – – 1 0 Mongolia 6 0 7 0
Belize 1 0 1 0 Montenegro 4 0 3 0
Benin 25 0 18 2 Morocco 11 1 11 1
Bhutan 1 0 1 0 Mozambique 8 0 9 0
Bolivia 25 0 25 0 Myanmar (Burma) 1 0 1 0
Bosnia and Herzegovina 16 1 15 1 Namibia 2 0 2 0
Brazil 30 0 25 1 Nepal 38 0 40 0
Bulgaria 20 0 25 0 Nicaragua 32 5 32 6
Burkina Faso 13 0 9 0 Niger 8 0 10 0
Burundi 5 0 4 0 Nigeria 50 4 46 4
Cambodia 17 0 16 0 Pakistan 30 0 30 4
Cameroon 21 0 20 1 Palestine 8 0 8 0
Central African Republic 1 0 1 0 Panama 4 0 3 0
Chad 2 0 2 0 Papua New Guinea 2 0 2 0
Chile 5 0 5 0 Paraguay 7 0 7 0
China, People’s Republic of 34 0 30 3 Peru 65 0 67 1
Colombia 37 0 34 0 Philippines 98 1 96 2
Congo, Democratic Republic of the 11 0 14 1 Poland 4 0 3 0
Congo, Republic of the 4 0 4 0 Romania 6 0 6 0
Costa Rica 15 0 15 0 Russia 29 0 59 3
Cote d’Ivoire (Ivory Coast) 17 0 9 0 Rwanda 21 0 7 0
Croatia 2 0 2 0 Saint Lucia 1 0 – –
Dominican Republic 13 1 13 1 Samoa 1 0 1 1
East Timor 3 0 3 0 Senegal 21 0 20 3
Ecuador 57 0 55 1 Serbia 4 0 4 0
Egypt 14 0 14 1 Sierra Leone 9 0 10 0
El Salvador 16 0 17 1 Slovakia 1 0 1 0
Ethiopia 21 0 18 0 South Africa 10 0 8 0
Fiji 1 0 – – South Sudan 4 0 3 0
Gabon 1 0 1 0 Sri Lanka 23 0 23 0
Gambia, The 2 0 2 0 Sudan 2 0 2 0
Georgia 13 0 12 0 Suriname 1 0 – –
Ghana 52 0 44 1 Swaziland 1 0 1 0
Grenada 1 0 – – Syria 3 0 3 1
Guatemala 22 0 22 0 Tajikistan 36 0 32 0
Guinea 7 0 7 1 Tanzania 15 1 15 1
Guinea-Bissau 4 0 2 1 Thailand 3 0 2 0
Haiti 7 0 6 0 Togo 13 1 12 3
Honduras 23 0 23 0 Tonga 1 0 1 0
Hungary 1 0 1 0 Trinidad and Tobago 2 0 2 0
India 146 12 146 20 Tunisia 1 0 1 0
Indonesia 31 1 52 1 Turkey 2 0 2 0
Iraq 12 0 12 0 Uganda 23 1 23 1
Jamaica 3 0 3 0 Ukraine 3 0 3 0
Jordan 8 0 8 0 Uruguay 2 1 2 1
Kazakhstan 22 1 30 1 Uzbekistan 18 0 30 0
Kenya 27 2 25 2 Vanuatu 1 0 – –
Kosovo 11 0 10 0 Venezuela 2 0 2 0
Kyrgyzstan 24 0 33 0 Vietnam 23 0 19 0
Laos 3 0 3 0 Yemen 9 0 8 2
Lebanon 5 0 5 0 Zambia 7 0 6 0
Liberia 3 0 2 0 Zimbabwe 5 0 5 0
Total 1797 39 1782 85
expect MFIs with a higher capital asset ratio to be less likely to fail. The portfolio at risk (30 days), the portfolio at risk (90 days), the loan loss rate, and the write-off ratio are commonly used measures for the portfolio quality in microfinance (see, e.g. Cull et al., 2007; Tchakoute-Tchuigoua, 2010; D’Espallier et al., 2011; Ahlin et al., 2011; Assefa et al., 2013) and serve as different proxies for asset quality.
There should be a positive relationship between the proxies for (bad) asset quality and the probability of failure. The ratio of borrowers per staff member is a proxy formanagement capability. This measure is generally not employed in studies on traditional bank failures. However, Armendáriz and Morduch (2010) emphasise that the motivation of staff members is an important factor for the management capability of an MFI. We suggest a negative relationship between borrowers per staff member and the probability of failure because MFIs with a higher number of borrowers per staff member are expected to operate more efficiently.
We consider the return on assets, the profit margin, and the net operating in- come as measures for theearningsof an MFI. MFIs with higher earnings are as- sumed to be less likely to fail. We employ the liquid assets as a proxy forliquidity and expect the failure probability to be lower for MFIs with a higher ratio of liquid assets. In line with Kerstein and Kozberg (2013), who investigate interest bearing deposits to total assets as a proxy for thesensitivity to market risk, we analyse the effect of deposits to total assets on the probability of failure. Contrary to Kerstein and Kozberg (2013), we expect a lower probability of failure with higher levels of deposits in the context of microfinance. Not all MFIs collect deposits. Only if an MFI meets certain criteria concerning its type or regulation is it allowed to take deposits from its clients. However, deposits are an inexpensive source of funding compared to debt from international investors. The dependence on international
capital markets is lower for MFIs that collect deposits. Therefore, the interest rate risk decreases for MFIs with higher levels of deposits. Moreover, these MFIs may also face a lower currency risk.
The fact that not all MFIs are able to offer deposits marks one of several dif- ferences between MFIs and standard banks. Accounting for these differences, we additionally examine microfinance-specific factors. We assume the percentage of female borrowers, donations, regulation, and growth effects to have an influence on the failure probability of an MFI. The discussion about gender effects is a well- known topic in microfinance. According to D’Espallier et al. (2011), MFIs with a higher fraction of female borrowers display a better repayment performance.
However, Hermes et al. (2011) argue that MFIs focusing on women operate less efficiently. We expect the share of female borrowers to have a positive impact on the failure probability of an MFI after controlling for the overall asset quality.
Another important difference to standard banking is that many MFIs receive donations. On the one hand, donations increase the equity of MFIs and reduce the pressure on an MFI to operate efficiently. Hence, this effect may cause donations to be positively associated with the event of failure. On the other hand, there could also be a negative relationship between donations and the probability of failure if donors determined certain requirements regarding the operations of an MFI. Fur- thermore, if an MFI is accompanied by a donor, it is very likely that the donor will help the MFI in times of financial distress. To observe the relationship between donations and the failure probability we include either a donations dummy or the relative donations divided by average assets, respectively.
Contrary to traditional banks, not all MFIs are subject to some form of regula- tion. However, regulation may reduce the likelihood of failure. Hence, we expect
a negative relationship between the regulation dummy and the probability of fail- ure. Moreover, Rozas (2011) mentions fast, uncontrolled growth of MFIs as being a reason for some of the MFI failures that he studies. To examine whether such an effect holds true after controlling for other effects, we proxy the growth of an MFI with the average growth rate of the number of an MFI’s borrowers (NBdev).
In summary, our empirical analyses focus on the following five hypotheses.
Hypothesis 1 (H1).The CAMELS components affect the probability of failure.
Hypothesis 2 (H2).There is a positive relationship between the percentage of female borrowers and the probability of failure.
Hypothesis 3 (H3).Donations have an influence on the likelihood of failure.
Hypothesis 4 (H4).Regulated MFIs are less likely to fail.
Hypothesis 5 (H5).The growth rate of an MFI in terms of number of borrow- ers is positively related to the probability of failure.
Further explanatory variables include several MFI-specific and macroeconomic control variables. The average assets are included to control for the size of the MFI. Furthermore, we include a dummy variable indicating whether the respec- tive MFI operates for-profit. We also include a dummy variable for the region Latin America and the Caribbean. The MFI types in our data sample are BANK, NGO, NBFI, credit union (CU), and OTHER1. We control for the type of MFI by including a dummy variable for the type NGO.
1The category OTHER includes rural banks and MFIs that do not provide information on the type on MIX Market.
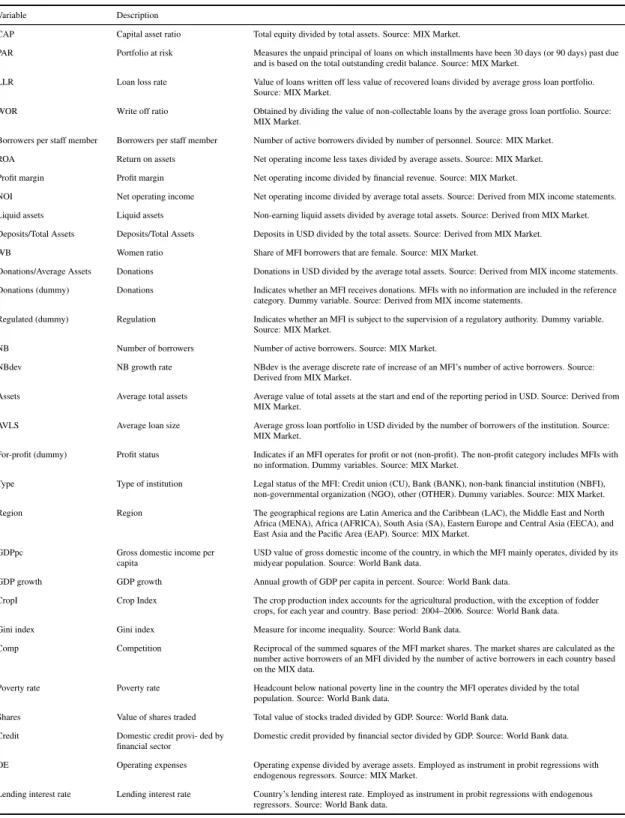
We also include macroeconomic control variables in our analysis, for example, the GDP per capita, the GDP growth, a measure for the competition, and a proxy for the agricultural production in a country (CropI). This measure considers, for example, crop shortfalls due to natural disasters. To account for the overall poverty level in a country, we include the poverty rate. We follow Cull et al. (2007) and employ the average loan size as a proxy for the poverty level of the borrowers of an MFI. Additionally, we include the Gini index to capture the distribution of income in the country where the MFI is located. All variables are defined in detail in Table 2.
2.4. Limitations of the data set
Several previous empirical studies mention selection bias issues related to MIX Market data (see, e.g., Bauchet and Morduch, 2010; Assefa et al., 2013).
Indeed, it is not unlikely that our data set comprises larger and more mature MFIs because reporting to MIX Market is voluntary for MFIs. Hence, a great number of MFIs possibly is neither able nor willing to contribute to MIX Market, which could be the case for small and/or young MFIs in particular. However, as our analyses focus on MFIs that intend to attract investors and as the MFIs providing information not only aim to enhance transparency2 but also look for new sources of financing, we argue that the MFIs reporting to MIX are most likely representa- tive of those MFIs which seek financing.
Additional concerns may arise due to the fact that smaller and less mature MFIs, which we cannot capture in our data set, might tend to fail more often in
2While transparency is of special importance to investors, other stakeholders, for example depositors or microentrepreneurs, may possibly rely on other factors enhancing the confidence in a certain MFI.
Table 2: Definition of variables.
Variable Description
CAP Capital asset ratio Total equity divided by total assets. Source: MIX Market.
PAR Portfolio at risk Measures the unpaid principal of loans on which installments have been 30 days (or 90 days) past due and is based on the total outstanding credit balance. Source: MIX Market.
LLR Loan loss rate Value of loans written off less value of recovered loans divided by average gross loan portfolio.
Source: MIX Market.
WOR Write off ratio Obtained by dividing the value of non-collectable loans by the average gross loan portfolio. Source:
MIX Market.
Borrowers per staff member Borrowers per staff member Number of active borrowers divided by number of personnel. Source: MIX Market.
ROA Return on assets Net operating income less taxes divided by average assets. Source: MIX Market.
Profit margin Profit margin Net operating income divided by financial revenue. Source: MIX Market.
NOI Net operating income Net operating income divided by average total assets. Source: Derived from MIX income statements.
Liquid assets Liquid assets Non-earning liquid assets divided by average total assets. Source: Derived from MIX Market.
Deposits/Total Assets Deposits/Total Assets Deposits in USD divided by the total assets. Source: Derived from MIX Market.
WB Women ratio Share of MFI borrowers that are female. Source: MIX Market.
Donations/Average Assets Donations Donations in USD divided by the average total assets. Source: Derived from MIX income statements.
Donations (dummy) Donations Indicates whether an MFI receives donations. MFIs with no information are included in the reference category. Dummy variable. Source: Derived from MIX income statements.
Regulated (dummy) Regulation Indicates whether an MFI is subject to the supervision of a regulatory authority. Dummy variable.
Source: MIX Market.
NB Number of borrowers Number of active borrowers. Source: MIX Market.
NBdev NB growth rate NBdev is the average discrete rate of increase of an MFI’s number of active borrowers. Source:
Derived from MIX Market.
Assets Average total assets Average value of total assets at the start and end of the reporting period in USD. Source: Derived from MIX Market.
AVLS Average loan size Average gross loan portfolio in USD divided by the number of borrowers of the institution. Source:
MIX Market.
For-profit (dummy) Profit status Indicates if an MFI operates for profit or not (non-profit). The non-profit category includes MFIs with no information. Dummy variables. Source: MIX Market.
Type Type of institution Legal status of the MFI: Credit union (CU), Bank (BANK), non-bank financial institution (NBFI), non-governmental organization (NGO), other (OTHER). Dummy variables. Source: MIX Market.
Region Region The geographical regions are Latin America and the Caribbean (LAC), the Middle East and North Africa (MENA), Africa (AFRICA), South Asia (SA), Eastern Europe and Central Asia (EECA), and East Asia and the Pacific Area (EAP). Source: MIX Market.
GDPpc Gross domestic income per
capita
USD value of gross domestic income of the country, in which the MFI mainly operates, divided by its midyear population. Source: World Bank data.
GDP growth GDP growth Annual growth of GDP per capita in percent. Source: World Bank data.
CropI Crop Index The crop production index accounts for the agricultural production, with the exception of fodder crops, for each year and country. Base period: 2004–2006. Source: World Bank data.
Gini index Gini index Measure for income inequality. Source: World Bank data.
Comp Competition Reciprocal of the summed squares of the MFI market shares. The market shares are calculated as the number active borrowers of an MFI divided by the number of active borrowers in each country based on the MIX data.
Poverty rate Poverty rate Headcount below national poverty line in the country the MFI operates divided by the total population. Source: World Bank data.
Shares Value of shares traded Total value of stocks traded divided by GDP. Source: World Bank data.
Credit Domestic credit provi- ded by
financial sector
Domestic credit provided by financial sector divided by GDP. Source: World Bank data.
OE Operating expenses Operating expense divided by average assets. Employed as instrument in probit regressions with endogenous regressors. Source: MIX Market.
Lending interest rate Lending interest rate Country’s lending interest rate. Employed as instrument in probit regressions with endogenous regressors. Source: World Bank data.
comparison to their peers represented at MIX Market. However, because of the lack of information, we are not able to consider these MFIs in our investigation.
Again, as we are only interested in the MFIs that wish to attract potential investors, the MFIs not reporting to MIX Market are not in the scope of our investigation.
Furthermore, for our regression analyses it is not necessary to identify the correct proportion of failed MFIs among all MFIs. The analyses solely require the failed MFIs of our sample to be representative for failed MFIs in general. The data show no indication contrary to this assumption. Moreover, we exclude unsolved cases regarding the FAILURE1 data set to avoid misspecification of failures. To conclude, although a certain sample selection bias exists, we are confident of the representativeness of our data set concerning the intended analyses.
2.5. Methodology
The dependent variable is a binary indicator for MFI failures. We estimate regression models with the following probit specification:
probit{P(yi=1|X)}=βXi+εi, (1)
whereXis a vector of explanatory variables concerning MFIiandεi∼N(0,σe2)is an individual residual. We apply Eicker–Huber–White heteroskedastic-consistent standard errors in all regressions.
Probit models are frequently used to determine the factors influencing fail- ures of traditional banks (e.g., Cole and Gunther, 1998; Reynaud, 2010; Ker- stein and Kozberg, 2013). Other regression techniques comprise logit models (e.g., Thomson, 1991; Arena, 2008; Cole and White, 2012; Jin et al., 2011), the
linear probability model (e.g., Poghosyan and ˇCihak, 2011), and survival models3 (e.g., Wheelock and Wilson, 2000; Arena, 2008; Auvray and Brossard, 2012).
There are several MFIs that do not report all variables required for the ana- lyses. Because failures are already rare events in our data sample, we follow D’Espallier et al. (2011) and impute metric variables with their means to prevent the loss of these observations.
3. Results
3.1. Descriptive analysis
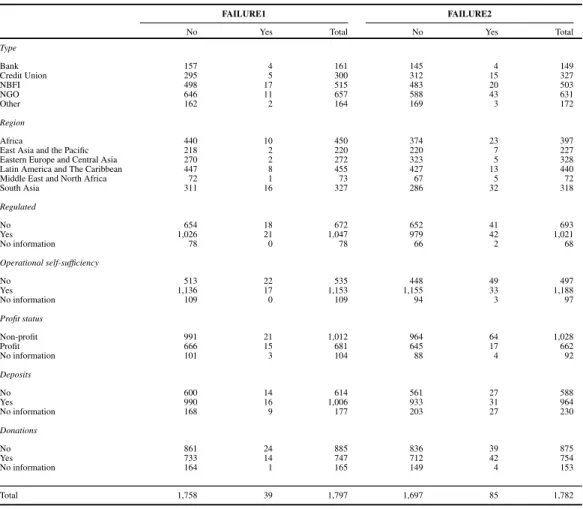
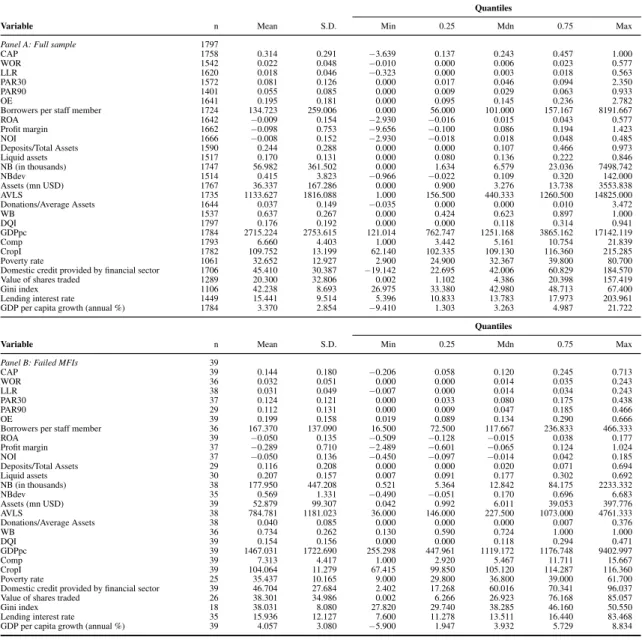
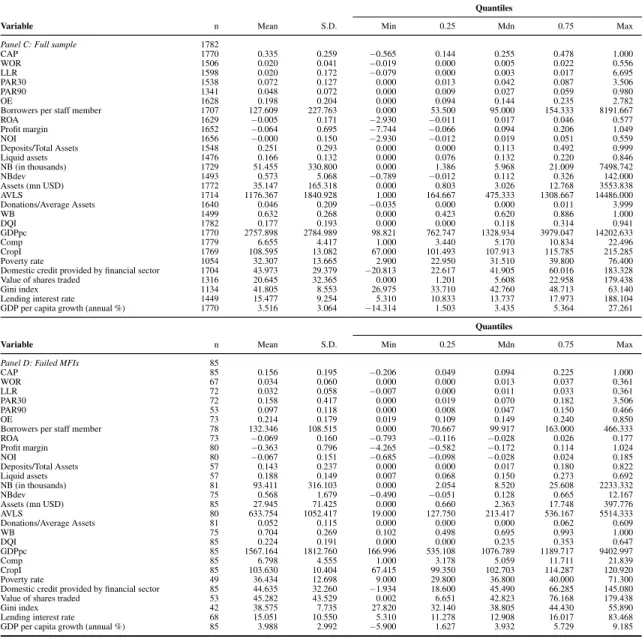
Table 3 shows the frequencies of failed and non-failed MFIs according to the strict (column 2–4) and extended (column 5–7) definition of failure for the cate- gorical variables. The FAILURE1 data set includes 39 failed and 1758 non-failed MFIs while the FAILURE2 data set consists of 85 failed and 1697 non-failed MFIs. Although it is possible that our data set may be biased regarding the size due to the usage of MIX Market information, as mentioned in Section 2.4, the ma- jority of MFIs operates on a non-profit basis in both failure samples. Over 40% of the MFIs receive donations.
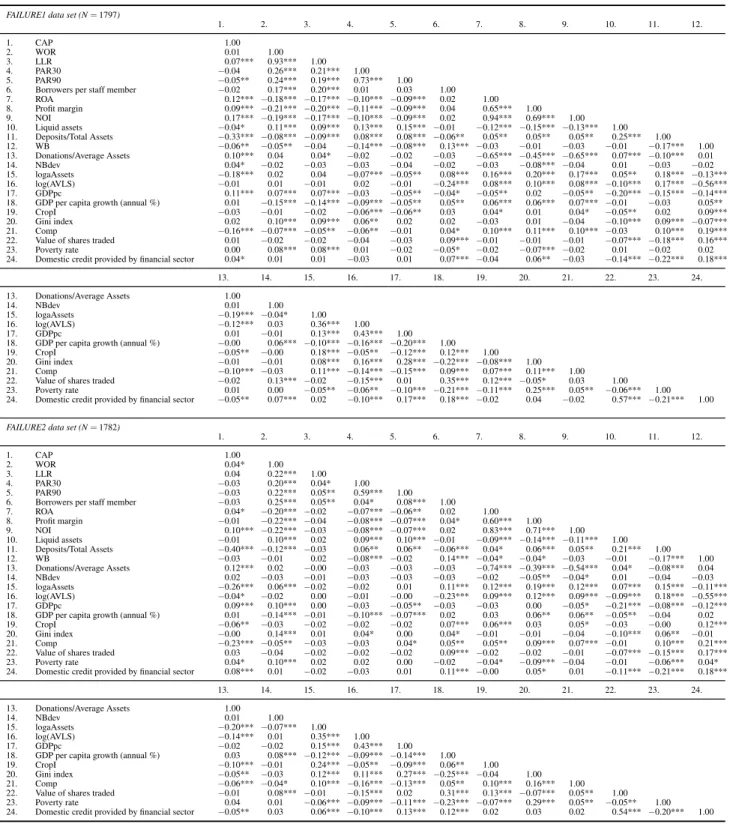
Table 4 presents the descriptive statistics for the metric variables of the full sample (Panel A) and the sample of failed MFIs (Panel B) according to the strict definition. Table 5 exhibits the full sample (Panel C) and the sample of failed MFIs (Panel D) according to our extended definition.
3We are not able to estimate survival models because we cannot determine the failure date.
Table 3: Frequencies for categorical variables based on the unimputed data sets for the strict (FAILURE1) and extended (FAILURE2) definition of failure. The variables are defined in Table 2.
FAILURE1 FAILURE2
No Yes Total No Yes Total
Type
Bank 157 4 161 145 4 149
Credit Union 295 5 300 312 15 327
NBFI 498 17 515 483 20 503
NGO 646 11 657 588 43 631
Other 162 2 164 169 3 172
Region
Africa 440 10 450 374 23 397
East Asia and the Pacific 218 2 220 220 7 227
Eastern Europe and Central Asia 270 2 272 323 5 328
Latin America and The Caribbean 447 8 455 427 13 440
Middle East and North Africa 72 1 73 67 5 72
South Asia 311 16 327 286 32 318
Regulated
No 654 18 672 652 41 693
Yes 1,026 21 1,047 979 42 1,021
No information 78 0 78 66 2 68
Operational self-sufficiency
No 513 22 535 448 49 497
Yes 1,136 17 1,153 1,155 33 1,188
No information 109 0 109 94 3 97
Profit status
Non-profit 991 21 1,012 964 64 1,028
Profit 666 15 681 645 17 662
No information 101 3 104 88 4 92
Deposits
No 600 14 614 561 27 588
Yes 990 16 1,006 933 31 964
No information 168 9 177 203 27 230
Donations
No 861 24 885 836 39 875
Yes 733 14 747 712 42 754
No information 164 1 165 149 4 153
Total 1,758 39 1,797 1,697 85 1,782
Table 4: Descriptive statistics for metric variables based on the unimputed data set for the strict definition of failure (FAILURE1). The variables are defined in Table 2.
Quantiles
Variable n Mean S.D. Min 0.25 Mdn 0.75 Max
Panel A: Full sample 1797
CAP 1758 0.314 0.291 −3.639 0.137 0.243 0.457 1.000
WOR 1542 0.022 0.048 −0.010 0.000 0.006 0.023 0.577
LLR 1620 0.018 0.046 −0.323 0.000 0.003 0.018 0.563
PAR30 1572 0.081 0.126 0.000 0.017 0.046 0.094 2.350
PAR90 1401 0.055 0.085 0.000 0.009 0.029 0.063 0.933
OE 1641 0.195 0.181 0.000 0.095 0.145 0.236 2.782
Borrowers per staff member 1724 134.723 259.006 0.000 56.000 101.000 157.167 8191.667
ROA 1642 −0.009 0.154 −2.930 −0.016 0.015 0.043 0.577
Profit margin 1662 −0.098 0.753 −9.656 −0.100 0.086 0.194 1.423
NOI 1666 −0.008 0.152 −2.930 −0.018 0.018 0.048 0.485
Deposits/Total Assets 1590 0.244 0.288 0.000 0.000 0.107 0.466 0.973
Liquid assets 1517 0.170 0.131 0.000 0.080 0.136 0.222 0.846
NB (in thousands) 1747 56.982 361.502 0.000 1.634 6.579 23.036 7498.742
NBdev 1514 0.415 3.823 −0.966 −0.022 0.109 0.320 142.000
Assets (mn USD) 1767 36.337 167.286 0.000 0.900 3.276 13.738 3553.838
AVLS 1735 1133.627 1816.088 1.000 156.500 440.333 1260.500 14825.000
Donations/Average Assets 1644 0.037 0.149 −0.035 0.000 0.000 0.010 3.472
WB 1537 0.637 0.267 0.000 0.424 0.623 0.897 1.000
DQI 1797 0.176 0.192 0.000 0.000 0.118 0.314 0.941
GDPpc 1784 2715.224 2753.615 121.014 762.747 1251.168 3865.162 17142.119
Comp 1793 6.660 4.403 1.000 3.442 5.161 10.754 21.839
CropI 1782 109.752 13.199 62.140 102.335 109.130 116.360 215.285
Poverty rate 1061 32.652 12.927 2.900 24.900 32.367 39.800 80.700
Domestic credit provided by financial sector 1706 45.410 30.387 −19.142 22.695 42.006 60.829 184.570
Value of shares traded 1289 20.300 32.806 0.002 1.102 4.386 20.398 157.419
Gini index 1106 42.238 8.693 26.975 33.380 42.980 48.713 67.400
Lending interest rate 1449 15.441 9.514 5.396 10.833 13.783 17.973 203.961
GDP per capita growth (annual %) 1784 3.370 2.854 −9.410 1.303 3.263 4.987 21.722
Quantiles
Variable n Mean S.D. Min 0.25 Mdn 0.75 Max
Panel B: Failed MFIs 39
CAP 39 0.144 0.180 −0.206 0.058 0.120 0.245 0.713
WOR 36 0.032 0.051 0.000 0.000 0.014 0.035 0.243
LLR 38 0.031 0.049 −0.007 0.000 0.014 0.034 0.243
PAR30 37 0.124 0.121 0.000 0.033 0.080 0.175 0.438
PAR90 29 0.112 0.131 0.000 0.009 0.047 0.185 0.466
OE 39 0.199 0.158 0.019 0.089 0.134 0.290 0.666
Borrowers per staff member 36 167.370 137.090 16.500 72.500 117.667 236.833 466.333
ROA 39 −0.050 0.135 −0.509 −0.128 −0.015 0.038 0.177
Profit margin 37 −0.289 0.710 −2.489 −0.601 −0.065 0.124 1.024
NOI 37 −0.050 0.136 −0.450 −0.097 −0.014 0.042 0.185
Deposits/Total Assets 29 0.116 0.208 0.000 0.000 0.020 0.071 0.694
Liquid assets 30 0.207 0.157 0.007 0.091 0.177 0.302 0.692
NB (in thousands) 38 177.950 447.208 0.521 5.364 12.842 84.175 2233.332
NBdev 35 0.569 1.331 −0.490 −0.051 0.170 0.696 6.683
Assets (mn USD) 39 52.879 99.307 0.042 0.992 6.011 39.053 397.776
AVLS 38 784.781 1181.023 36.000 146.000 227.500 1073.000 4761.333
Donations/Average Assets 38 0.040 0.085 0.000 0.000 0.000 0.007 0.376
WB 36 0.734 0.262 0.130 0.590 0.724 1.000 1.000
DQI 39 0.154 0.156 0.000 0.000 0.118 0.294 0.471
GDPpc 39 1467.031 1722.690 255.298 447.961 1119.172 1176.748 9402.997
Comp 39 7.313 4.417 1.000 2.920 5.467 11.711 15.667
CropI 39 104.064 11.279 67.415 99.850 105.120 114.287 116.360
Poverty rate 25 35.437 10.165 9.000 29.800 36.800 39.000 61.700
Domestic credit provided by financial sector 39 46.704 27.684 2.402 17.268 60.016 70.341 96.037
Value of shares traded 26 38.301 34.986 0.002 6.266 26.923 76.168 85.057
Gini index 18 38.031 8.080 27.820 29.740 38.285 46.160 50.550
Lending interest rate 35 15.936 12.127 7.600 11.278 13.511 16.440 83.468
GDP per capita growth (annual %) 39 4.057 3.080 −5.900 1.947 3.932 5.729 8.834
Table 5: Descriptive statistics for metric variables based on the unimputed data set for the extended definition of failure (FAILURE2). The variables are defined in Table 2.
Quantiles
Variable n Mean S.D. Min 0.25 Mdn 0.75 Max
Panel C: Full sample 1782
CAP 1770 0.335 0.259 −0.565 0.144 0.255 0.478 1.000
WOR 1506 0.020 0.041 −0.019 0.000 0.005 0.022 0.556
LLR 1598 0.020 0.172 −0.079 0.000 0.003 0.017 6.695
PAR30 1538 0.072 0.127 0.000 0.013 0.042 0.087 3.506
PAR90 1341 0.048 0.072 0.000 0.009 0.027 0.059 0.980
OE 1628 0.198 0.204 0.000 0.094 0.144 0.235 2.782
Borrowers per staff member 1707 127.609 227.763 0.000 53.500 95.000 154.333 8191.667
ROA 1629 −0.005 0.171 −2.930 −0.011 0.017 0.046 0.577
Profit margin 1652 −0.064 0.695 −7.744 −0.066 0.094 0.206 1.049
NOI 1656 −0.000 0.150 −2.930 −0.012 0.019 0.051 0.559
Deposits/Total Assets 1548 0.251 0.293 0.000 0.000 0.113 0.492 0.999
Liquid assets 1476 0.166 0.132 0.000 0.076 0.132 0.220 0.846
NB (in thousands) 1729 51.455 330.800 0.000 1.386 5.968 21.009 7498.742
NBdev 1493 0.573 5.068 −0.789 −0.012 0.112 0.326 142.000
Assets (mn USD) 1772 35.147 165.318 0.000 0.803 3.026 12.768 3553.838
AVLS 1714 1176.367 1840.928 1.000 164.667 475.333 1308.667 14486.000
Donations/Average Assets 1640 0.046 0.209 −0.035 0.000 0.000 0.011 3.999
WB 1499 0.632 0.268 0.000 0.423 0.620 0.886 1.000
DQI 1782 0.177 0.193 0.000 0.000 0.118 0.314 0.941
GDPpc 1770 2757.898 2784.989 98.821 762.747 1328.934 3979.047 14202.633
Comp 1779 6.655 4.417 1.000 3.440 5.170 10.834 22.496
CropI 1769 108.595 13.082 67.000 101.493 107.913 115.785 215.285
Poverty rate 1054 32.307 13.665 2.900 22.950 31.510 39.800 76.400
Domestic credit provided by financial sector 1704 43.973 29.379 −20.813 22.617 41.905 60.016 183.328
Value of shares traded 1316 20.645 32.365 0.000 1.201 5.608 22.958 179.438
Gini index 1134 41.805 8.553 26.975 33.710 42.760 48.713 63.140
Lending interest rate 1449 15.477 9.254 5.310 10.833 13.737 17.973 188.104
GDP per capita growth (annual %) 1770 3.516 3.064 −14.314 1.503 3.435 5.364 27.261
Quantiles
Variable n Mean S.D. Min 0.25 Mdn 0.75 Max
Panel D: Failed MFIs 85
CAP 85 0.156 0.195 −0.206 0.049 0.094 0.225 1.000
WOR 67 0.034 0.060 0.000 0.000 0.013 0.037 0.361
LLR 72 0.032 0.058 −0.007 0.000 0.011 0.033 0.361
PAR30 72 0.158 0.417 0.000 0.019 0.070 0.182 3.506
PAR90 53 0.097 0.118 0.000 0.008 0.047 0.150 0.466
OE 73 0.214 0.179 0.019 0.109 0.149 0.240 0.850
Borrowers per staff member 78 132.346 108.515 0.000 70.667 99.917 163.000 466.333
ROA 73 −0.069 0.160 −0.793 −0.116 −0.028 0.026 0.177
Profit margin 80 −0.363 0.796 −4.265 −0.582 −0.172 0.114 1.024
NOI 80 −0.067 0.151 −0.685 −0.098 −0.028 0.024 0.185
Deposits/Total Assets 57 0.143 0.237 0.000 0.000 0.017 0.180 0.822
Liquid assets 57 0.188 0.149 0.007 0.068 0.150 0.273 0.692
NB (in thousands) 81 93.411 316.103 0.000 2.054 8.520 25.608 2233.332
NBdev 75 0.568 1.679 −0.490 −0.051 0.128 0.665 12.167
Assets (mn USD) 85 27.945 71.425 0.000 0.660 2.363 17.748 397.776
AVLS 80 633.754 1052.417 19.000 127.750 213.417 536.167 5514.333
Donations/Average Assets 81 0.052 0.115 0.000 0.000 0.000 0.062 0.609
WB 75 0.704 0.269 0.102 0.498 0.695 0.993 1.000
DQI 85 0.224 0.191 0.000 0.000 0.235 0.353 0.647
GDPpc 85 1567.164 1812.760 166.996 535.108 1076.789 1189.717 9402.997
Comp 85 6.798 4.555 1.000 3.178 5.059 11.711 21.839
CropI 85 103.630 10.404 67.415 99.350 102.703 114.287 120.920
Poverty rate 49 36.434 12.698 9.000 29.800 36.800 40.000 71.300
Domestic credit provided by financial sector 85 44.635 32.260 −1.934 18.600 45.490 66.285 145.080
Value of shares traded 53 45.282 43.529 0.002 6.651 42.823 76.168 179.438
Gini index 42 38.575 7.735 27.820 32.140 38.805 44.430 55.890
Lending interest rate 68 15.051 10.550 5.310 11.278 12.908 16.017 83.468
GDP per capita growth (annual %) 85 3.988 2.992 −5.900 1.627 3.932 5.729 9.185

