Pure & Appl. Chem., Vol. 61, No. 8, pp. 1379-1386,1989, Printed in Great Britain.
0 1989 IUPAC
An equation of state for the gas phase of methanol
R.J.B. Craven, K.M. de Reuck and W.A. Wakeham IUPAC Thermodynamic Tables Project Centre,
Department of Chemical Engineering and Chemical Technology, London SW7 2BY, England
Abstract
-
A critical review of the very extensive literature on methanol reveals a lack of accurate PpT data in the gas phase. In order to utilise the available and accurate measurements of enthalpy, isobaric heat capacity and speed of sound, an equation of state has been developed for the gas phase in terms of a reduced Gibbs energy function. Comparisons are given of the experimental data with the equation of state and the problems caused by decomposition are discussed. The successful representation of the effects of association on the isobaric heat capacity is illustrated.INTRODUCTION
There is a very extensive literature on methanol, but because of the experimental problems, which are discussed in the next section, a thorough critical review revealed only a limited amount of accurate data.
An early attempt to produce an equation of state for the whole surface was made by Zubarev, Prusakov and Sergeeva (ref. 1) who published tables of the thermodynamic properties over the range 178 to 573K, for pressures up to 50MPa. More recently, Goodwin (ref. 2) at the National Bureau of Standards, published tables based on his equation of state. These equations rely heavily on PpT data, but for methanol the reliable PpT data in the gas phase cover a very small range and it is therefore necessary to use other properties, such as enthalpy and isobaric heat capacity, which are less sensitive t o the effects of adsorption and decomposition. However these properties cannot be used directly to fit the usual Helmholtz energy function since both types of data are measured as a function of pressure and temperature; also the isobaric heat capacities are non-linear in terms of the coefficients. The gas phase data were therefore fitted to a Gibbs energy function, and this will later be used to calculate input data for fitting a Helmholtz energy equation for the whole surface.
EXPERIMENTAL PROBLEMS
There are three major problems encountered when making experimental thermodynamic measurements on methanol, and since they are a frequent source of error, they are discussed separately.
Purity
The most common impurity is water, which is very difficult to remove (see recommendations in ref. 3).
Since methanol is very hygroscopic any quoted water impurity content is likely t o be unreliable unless care has been taken t o exclude moist air from the stored sample. The presence of water reduces the vapour pressure, increases the density, the enthalpy of evaporation and the heat capacity.
Adsorption
Gaseous methanol adsorbs readily onto many surfaces and results in an increase in the apparent density.
The size of the error depends on both the experimental method and the nature of the surface. If adsorption isotherms are measured separately corrections can be made for it, or it can be partly compensated for when using gas density balance methods. Fischer et al. (ref. 4) found that adsorption effects at temperatures below 329 K were greater than the experimental errors from other sources if the relative pressure P/P, was greater than 0.37, where P, is the saturation pressure. Therefore at lower temperatures measurements of the saturated vapour density or densities near to saturation are likely to be unreliable. In the presence of adsorption, measured second virial coefficients are too negative. For most of the earlier density measurements inadequate care was taken either to eliminate or correct for adsorption.
1379
160
140
7 120
*
0
- -
l l
Decomposition
As with adsorption, decomposition is dependent on the nature of the surface as well as the temperature and pressure, but also on the residence time of the methanol under these experimental conditions. In the gas phase a t low pressures, below about 0.16 MPa, significant decomposition is not observed until a temperature of 650 K is reached (see ref. 4). At higher pressures, about 3 . 4 MPa, chemical reaction or decomposition has been observed in the gas for temperatures as low as 473 K (see refs. 5 and 6), and also at this temperature a t pressures of 800 MPa in the liquid (see ref. 7). Therefore measurements at any temperature greater than 473 K for pressures above 3 . 4 MPa may be affected by decomposition.
the end of the run in order to measure the amount of impurities present, and to calculate the probable error caused by them.
DEVELOPMENT OF THE GIBBS EQUATION OF STATE
The equation of state is expressed in the form of a reduced Gibbs energy written in an analogous way to the usual Helmholtz energy function as
G ( K , T)/RT = 7 ’ d ( ~ )
+
h ( a / K a )+
T(K, T ) (1)where K = P / P * , T = T * / T and P* and T* are reducing parameters. The entropy and enthalpy are taken to be zero at an arbitrary reference point (na, T ~ ) in the ideal gas. The pressure-dependent part of the ideal gas is represented by &(K/K,) and the temperature-dependent part by rid(.) which can be calculated from the ideal gas isobaric heat capacity,
Cid,
by the relationshipAn equation of state for the gas phase of methanol 1381
The equation for C i d used here is from Craven and de Reuck (ref. 15).
The function ~ ( a , T ) represents the real part of the reduced Gibbs energy for the gas, and the general functional form chosen for the "bank" of 111 terms is given by
i = l j = 1 i = l
The linear coefficients nij and ni were determined using SEEQ (ref. 16), which is a multi-property least-squares method where the statistically-significant terms are selected fiom the original bank of terms: the method was first developed by Wagner (ref. 17) for fitting vapour pressure curves.
The exponential temperature terms in eq. (3) were included to account for the association of the molecules in the gas. The form of the terms was proposed by Weltner and Pitzer (ref. 11) from a model of polymerisation based on the arbitrary assumption that the heat of polymerisation is constant and AC of polymerisation is zero. The terms represent dimers and higher polymers up to clusters of seven molecJes, and the numerical constants qi used here were based on those from Counsel1 and Lee (ref. 13).
In terms of eq. (3) the compression factor z is given by z = 1
+
T ( a T / a ? f ) TThe weighted sum of squares to be minimised for PpT data is given by
(4)
where M1 is the total number of PpT data points and uiesl is the estimated variance for each data point calculated using the Gaussian error propagation formula.
In terms of eqs. (1) and (3) the enthalpy is given by
(6)
so the weighted sum of squares t o be minimised for these data is
where the point (rS, rs) is that of the saturated vapour a t 298.15 K. There are also some A H measurements at constant temperature, where the weighted sums of squares is
The weighted sums of squares t o be minimised for isobaric heat capacities is
The speed of sound is non-linear in terms of the coefficients nij and ni, but if values for C,/Cv and the densit are taken from a previous fit, then experimental speed of sound data can be used to include the slope (%y/a~z), into the fit. The speed of sound can be defined as
and using eq. (3)
So the weighted sum of squares to be minimised for these data is
where M is the molar mass.
The total sum of squares which was minimised was S I + SZ
+
Ss+
Sq+
Ss.DATA USED IN THE FIT OF THE GIBBS E Q U A T I O N
The data used to determine the coefficients nij and ni of eq. (3) are listed in Table 1. As discussed previously there are very few PpT data sets which were considered to be of sufficient accuracy to use in the fitting procedure. The low pressure measurements by Fischer et al. (ref. 4) and by Bich et al. (ref. 18) were used with minor corrections by the authors (ref. 19); their lowest temperature values were omitted because the authors considered that adsorption was causing errors (ref. 19). The calculated saturated vapour densities from the triple point to 8.0 MPa were included as PpT data. These were calculated using the Clausius-Clapeyron relation together with auxiliary equations fitted t o experimental vapour pressures, saturated liquid densities and enthalpies of evaporation. Since the enthalpies of evaporation had to be extrapolated, an iterative procedure was used until a physically realistic set of saturated vapour densities was obtained.
The gas phase specific enthalpy data of Yerlett and Wormald (ref. 9) were measured in a flow calorimeter; the data of Lydersen (ref. 20) were isothermal measurements of AH.
Table 1. Selected data used to determine the coefficients of equation (13)
Source Date Temperature Pressure No. of points
range/K range/MPa
1972 329-634 0 * 026-0 * 21 42
Straty et al (ref. 8) 1986 498-573 5 . 3 - 8 - 0 38
Fischer et al (refs.
PoT
4,19)Bich et a1 (refs. 18,19) 1984 356-628 0.057-0.19 19
pd%Tc7
Calculated 1 75-5 10 1 * 7x 10 -7-8 * 0 68
Yerlett and Wormald 1986 373-573 0.1-7-6
1986 428-564 1.5-7
-
4 55 77De Vries and?ollins (ref.10) 1941 3 5 0 4 2 0 0.1 7
Sinke and De Vries [ref. 12) 1953 3 4 1 4 0 5 0.1 4
Weltner and Pitzer ref. 11 1951 346-521 0 . 1 3
Counsel1 and Lee (ref. 13) 1973 3 3 0 4 5 0 0-025-0.1 26
heed of sound
Goodwin and Ewing (ref. 21) 1986 280-320 <om022 84
GIBBS ENERGY E Q U A T I O N OF STATE
The complete Gibbs energy equation of state is given by eq. (1) where the equation for the reduced Gibbs energy of the real gas contains 16 terms and is given by
1 2 1.6
i = l
The coefficients a i and qi and exponents T i and S i are given i n Table 2, together with the values for P*
and T*, the gas constant R and molar mass M. The fittin procedure selected four of the special association terms, but whilst three of these have negative coefkients the fourth is positive and so they
An equation of state for the gas phase of methanol 1383
A
2.06 mol dmJ 3 -
2 -
I .
0 O - 0 rl
x - I
. -
h a
can only be considered as empirical parameters, and no conclusions can be drawn about the size of the molecular clusters.
A
3.23 mo1 d K a 3 -
2 -
i -
m m.
0
- i
-
Table 2. Numerical values of the coefficients ai and qi and the exponents r i and S i of equation (13)
3
-Qi ai q i r i si
4 -
3 .
2 .
1 -
0
-i
-2
~
1 2 3 4 5 6 7 8 9 10 11 12 13 14 15 16
2.68 B D l dmd
m
.
4 . 0 8 8 8 379 366 533 0.464 897 841 530 -2.914 108 416 38 2.387 323 127 36 -0.860 093 122 904
1 * 105 601 806 72 4 . 2 8 4 704 391 367 4 . 9 4 5 290 986 597 1.018 213 256 73 4 - 3 0 7 950 196 724
0.856 718 115 499 4 . 5 3 6 621 462 787 -0.00 536 368 707 259 -0,214 167 133 938 10-11
0.267 248 550 807 10-17
-0.725 750 174 566 10-23
4 -
3 .
2 .
i -
0 -
-1
-Q
- -
3.901 4665 23.213 127 34.234 553 45.255 979
3.88 mol dm*
-
2 4 8 8 LO
1 2 3 3 3 4 5 5 4 4 6 6 1 3 4 5
4 0 0 1 7 0 0 9 14.5 19.5 14.5 19.5
- - - -
P* = 8.0845 MPa, T* = 512.574 K , R = 8.31434 J K-lmol-1, M = 0.03204216 kg mol-1
I
Presmura / W E Presaure /MPa
Fig. 2 Comparisons alon isochores of the PpT data with equation (13) and with the equation of state of Goodwin (ref. 27.
I: Straty et al. (ref. 8);
-
: Goodwin (ref. 2).1.00
0 . 5 0 .
-
8 '# - .oo
-
8I
- 0 . 5 0 .
-
-1.00 .
.
-1.50
.
-4 a . 2 K - 2 . 0 0 '
1.00
8
0 . 5 0
.
8
.oo
.
- 0 . 5 0 .
-1.00
.
-1.50
.
g15.2 K
- 2 . 0 0
3 3
0 E
0 . 5 0
.oo
- 0 . 5 0
-1.00
-1.50
- 2 . 0 0
I
8 8
-
' 8
.
.
.
323.2 K
2 A 6 0 10
a
E
kd
0 . 5 0
.oo
- 0 . 5 0
-1.00
-1.50
- 2 . 0 0 w
8 8
-
' 8
.
.
.
323.2 K
2 A 6 0 10
1.00
0 . 5 0 . 8
8
.oo
- - -
I .
- 0 . 5 0 .
-1.50
.
A48.2 K
e 4 6 0 10
- 2 . 0 0
1 . 0 0
8 '
I
4 9 8 . 2 K
-0.50
- 1 . 0 0
-1.50
- 2 . 0 0
10
1.00I i
0 . 5 0
t
-0.50
'ooLz7-i
P r e s w r e /Wa Pressure /MPa
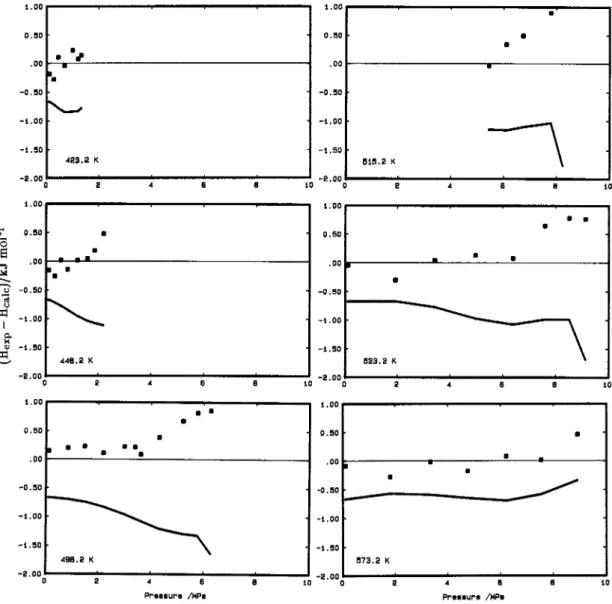
Fig. 3 Comparisons along isotherms of the enthalpy data with equations (2) and (13), and with the equation of state of Goodwin (ref. 2).
I: Yerlett and Wormald (ref. 9);
-
: Goodwin (ref. 2).An equation of state for the gas phase of methanol 1385
tsobaric heat capacity
The C, data of Counsel1 and Lee (ref. 13), which were used, all agree with values calculated from the equation of state t o within f 0.5%, with the largest deviations being near t o the saturation curve; the experimental accuracy was given as f 0.2%. Figure 1 shows the behaviour of C, along the 0.1 MPa isobar and the deviations of the various data sets from the curve calculated from the equation of state;
the dashed curve represents values from the equation of state of Goodwin (ref. 2) at 0.101325 MPa. The data of Stromsoe et al. (ref. 14) were not used in the fit. The exponential temperature terms in eq. (13) were essential to enable the steep rise in C, resulting from association of the molecules, t o be reproduced.
Speed of sound
Deviations of speed of sound values predicted by the equation of state from the preliminary measurements of Goodwin and Ewing (ref. 21) are systematic in that, in general, along each isotherm the deviations increase negatively with increasing pressure, but the maximum deviation is only -0.13%. The experimental precision is considerably higher than this but since these are the only data used in this region and they extend the temperature range 50 K below the PpT data used by Fischer et al. (ref. 4,19), the agreement can be considered to be very good.
Speed of sound measurements by Akhmetyanov (ref. 22) were not used in the fit. Values in the saturated vapour are reproduced by the equation of state t o within - 0 . 5 t o +2-5% for tem eratures up to 475 K, but at higher temperatures the deviations increase to a maximum of nearly - 9 - O k For pressures up to 3.4 MPa the single-phase values are reproduced to within f 2-0%, but at higher pressures the deviations increase to a maximum of +9.0%. Again, the increased deviations occur for measurements above 473 K and 3.4 MPa, where decomposition is known t o occur.
Second virial coefficient
Second virial coefficient data were not included in the fit of the equation of state and its predictions are
.
The deviations of other data sets are in general much larger than this. Below 350 K all deviations are negative, that is, the predicted values are less negative than the experimental data, which is to be expected if the measurements were affected by adsorption.systematically less negative than those given by Fischer et al. refs. 4,19) and by Bich et al. (refs. 18,19) by about 15 cm3 mol-1, for temperatures down to about 350
SUMMARISING THE FIT TO THE GIBBS EQUATION OF STATE
All the properties are well represented by the equation of state for pressures up to about 4.0 MPa where the saturation temperature is N 473 K; this being the point above which decomposition is known to occur.
Above this point the deviations for all properties become systematic and larger than the experimental errors. This occurs for the enthalpy data of Yerlett and Wormald (ref. 9), the PpT data of Straty et al.
(ref. 8), the calculated saturated vapour densities, as well as for the Akhmetyanov (ref. 22) speed of sound data at saturation which were not used in the fit. This systematic behaviour suggests that there are inconsistencies between the overlapping sets of enthalpy and PpT data. In the PpT measurements the same sample was kept in the cell for between 17 and 35 h and an attempt was made to correct for thermal degradation by measuring the rate of change of pressure with time. The authors report that the maximum effect due to decomposition will be at "intermediate densities near the critical region at temperatures above [513 K]". They conclude that the net effect on the pressure is small but "the isochore curvatures could be expected to be altered somewhat, affecting thermodynamic calculations in this region". It is therefore not surprising that there are systematic differences from the equation of state in the region where the PpT data of Straty et al. overlap with the enthalpy measurements of Yerlett and Wormald. For the enthalpy measurements the longest time of residence in the hot zone of the calorimeter was estimated t o be 325 s and an analysis after the run at 573.2 K and 8 - 9 MPa found impurities of acetone (0.29 mole percent), methyl formate (0.18 mole percent) and methyl acetate (0.02 mole percent). Yerlett and Wormald estimated the effect on their measurements of assuming that the impurities were acetone and methyl formate in the mole ration of 3/2. The maximum error due to decomposition was for their run at 573.2 K and 13-64 MPa where the error in the enthalpy increment was estimated to be 4 . 6 % or -256 J mol-1. The effect of these impurities was t o increase the enthalpy difference. They did not correct for this error, and in general the values calculated from eq. (13) are smaller than the measured data at the higher temperatures and pressures. Below 498.2 K decomposition was found to be negligible.
CONCLUSIONS
For temperatures from 280 K to 630 K for pressures up to 4.0 MPa all the selected data, except for the speed of sound measurements, are represented by the Gibbs equation of state (13), t o within their experimental accuracy. At a pressure of 4.0 Ma the saturation temperature is approximately 473 K , and at pressures and temperatures greater than this the deviations from the equation of state increase progressively; this is almost certainly a result of decomposition occurring. It is probable that the enthalpy data is less affected by decomposition than the PpT data because the time of residence in the hot part of the flow calorimeter is orders of magnitude less than the time the PpT sample was maintained at high
temperatures and pressures. The fact that decomposition is partly dependent on the material of the vessel means that, in this region of higher temperatures and pressures, systematic differences between different experimenters are inevitable.
Data with random errors of varying sizes can easily be included in a fit by adjusting the weights applied to each point, but systematic errors have serious consequences for derived properties and this is well illustrated by the deviations shown in Fig. 3.
The final aim of this project is to prepare a Helmholtz energy equation for the whole surface, using the Gibbs equation of state to calculate input data for the gas phase. However, the problem of decomposition may result in restricting the range of temperature and pressure for which such an equation will be valid.
The other problems of purity, adsorption and association can be overcome.
Acknowledgements
The authors wish to thank Professor A.L. Lydersen for sending them his unpublished enthalpy data, Dr.
M.B. Ewing for letting them have his preliminary results of the speed of sound in the gas phase, and Dr.
C.J. Wormald for sending them his enthalpy data before publication. They also wish t o thank Dr. J.
Millat for sending the revised data on PpT measurements in the gas phase by Professor G. Opel and his colleagues at Wilhelm-Pieck University, Rostock.
This work was supported by the United Kingdom Department of Trade and Industry.
REFERENCES
1. V.N. Zubarev, P.G. Prusakov and L.V. Sergeeva, Thermoahvsical Proaerties of Methvl Alcohol, GSSD. Izdat el, Stvo Standartov, Moscow (1973).
2. R.D. Goo*J. Phvs. Chem. Ref. Data,
Is,
799-892 (1987).3. Y. Marcus and S. Glikberg, Pure & A D D ~ . Chem., 57, 855-864 (1985).
4. S. Fischer, H. Kohler and G. Opel, WZ Rostock 21, @, 181-189 (1972).
5. A.P. Kudchadker, PhD Thesis, Texas A & M University (1968).
6. T.J. Bruno and G.C. Straty, J. Res. Natl. Bur. Stand., 91, 135-138 (1986).
7. R. Ta’ani, Doctoral Dissertation, Karlsruhe University (1976).
8. G.C. Straty, A.M.F. Palavra and T.J. Bruno, Int. J. ThermoDhvs., 7, 1077-1089 (1986).
9. T.K. Yerlett and C.J. Wormald, J. Chem. Thermodvn.,
18,
719-726 (1986).10. T . De Vries and B.T. Collins, J. Am. Chem. SOC.,
63,
1343-1346 (1941).11. W. Weltner and K.S. Pitzer, J. Am. Chem. SOC., 73, 2606-2610 (1951).
12. G.C. Sinke and T . De Vries, J. Am. Chem. SOC.,
75,
1815-1818 (1953).13. J.F. Counsel1 and D.A. Lee, J. Chem. Thermodvn.,
5,
583-589 (1973).14. E. Stromsoe, H.G. Ronne and A.L. Lydersen, J. Chem. Enn. Data,
15,
286-290 (1970).15. R.J.B. Craven and K.M. de Reuck, Int. J. ThermoDhvs.,
1,
541-552 (1986).16. K.M. de Reuck and B. Armstrong, Crvonenics, 19, 505-512 (1979).
17. W. Wagner, Forschr.-Ber., VDI-Z 3, No. 39 (1974).
18. E. Bich, R. Pietsch and G. Opel, Zeit. Phvs. Chem. (Leipzigb, 265, 396400 (1984).
19. J. Millat (private communication of revised data prepared y Prof. G. Opel and his co-authors at Wilhelm-Pieck University, Rostock).
20. A.L. Lydersen (private communication).
21. A.R.H. Goodwin and M.B. Ewing (private communication).
22. K.G. Akhmetyanov, M.G. Shirkevich and I.B. Rozhdestvenskii, Prim. Ul’traakust. Issle.
Veshtch.-M. MOPI, B ( 4 ) , 127-135 (1957).