Angular Correlations
Alena L¨osle, Lei Zhang (3/2016)
Angular Correlations
Contents
1 Introduction 1
2 Tasks 2
3 Experimental setup 2
4 Experimental procedure 3
4.1 Spectrum measurement and energy calibration . . . 3 4.2 Investigation of coincidences between the individualγ-transitions . . . 3 4.3 Angular correlation measurement of theγγ-cascadec→b→a . . . 3
5 Experimental setup 4
6 List of equipments 5
7 Decay schemes 6
8 Literature 8
9 Tips 10
1 Introduction
Radioactive sources emit their electromagnetic radiation in an isotropic way, which means that the ra- diation is emitted into all regions of space with equal probability. This is due to the fact, that statistical distributions of the spin of atomic nuclei are found to be isotropic. However, if the intermediate m-levels of an excited nucleus are not equally occupied, the emitted radiation is anisotropic. An orientation of the spins can be achieved by measuring the direction of flight of the first emittedγ-quant of aγ-γ-cascade.
Defining this direction as the quantisation axis results in an anisotropic angular distribution for the secondγ-quant.
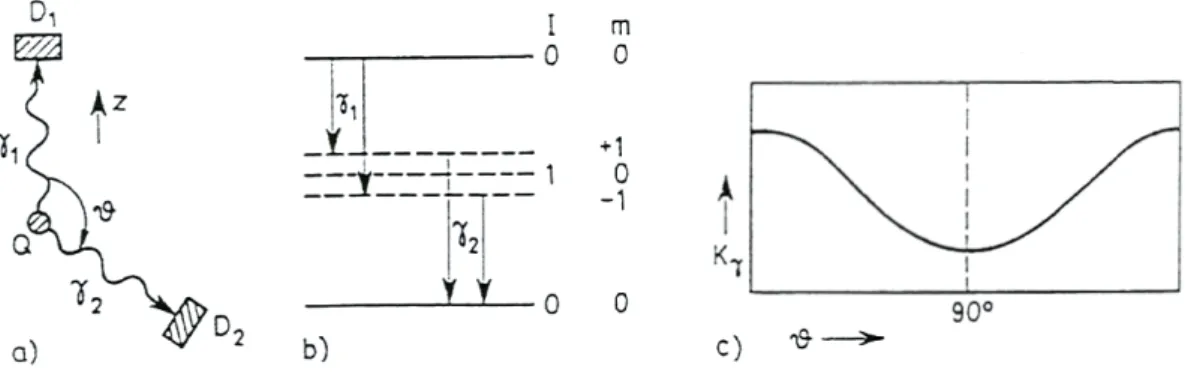
Fig.1shows an example of a hypotheticγ-γ-cascade between three nucleus levels with spin configuration 0→1→0. The z-axis can be defined as the direction between radioactive sourceQand detectorD1(see Fig.1c)). As only transitions with ∆I= 1 are allowed, the nucleus emits dipolradiation. In particular, out of the two possible angular distributions
X10
2and X1±
2, only X1±
2 describes the emittance of a γ-quant in z-direction. This means, that with respect to the quantization axis ( z-axis ) only intermediate levels with m= +1 and m =−1 can be occupied. Fig.1b) shows these intermediate levels spatially separated, however they can have the same energy. The secondγ-quant has to obtain a spin difference of
∆m=±1 with respect to the z-axis. This results in an observed distribution X1±
2 for the coincidence rateKγ as function of the angleθbetweenD1 andD2 (see Fig. 1c)).
This example shows, that by defining a quantisation axis (e.g. the direction of flight of the first emitted γ-quant) an non-uniform distribution of the intermediate levels is obtained. This effect can be observed in the characteristic angular distribution of the secondγ-quant.
Fig.1shows the measurement of angular correlations for a (0→1→0)-casacade.
Figure 1: a) Measurement setup b) niveu scheme c) coincidence rate Kγ as function of angle θ.
2 Tasks
Determine the decay scheme of106Pd and the spin of the nucleus for the three lowest levels. Fig. 2gives an overview of possibe decay chains starting with106Ru.
Figure 2: Decay scheme of106Ru to 106Pd.
3 Experimental setup
Figure 3: Block diagram of the experimental setup with Z¨ahler(german)=counter.
4 Experimental procedure
4.1 Spectrum measurement and energy calibration
The γ-spectrum of 106Pd is measured with the PCA-multi-channel analyzer. The energy calibration of the analyzer is done with two different sources (22Na and 60Co). Notice, that for the analyzer γ- energies up toE = 2.7 MeV have to be amplified linearly. Theγ-spectrum belowE = 0.4 MeV mainly consists of compton scattering and back scattering events and is not of interest for this analysis. Notice:
someγ-transition of106Pd are very low in intensity, hence the length of the measurement has to be set accordingly.
4.2 Investigation of coincidences between the individual γ-transitions
The resolution time at the coincidence unit has to be set to 30 ns. Both single-channel analyzers have variable time delay units, where one can be set to constant (60 ns). Then, the optimal overlapping of the coincidence signals is determined by variyng the time delay of the second analyzer (compensation of run-time differences for the branches).
Question: How can one measure random coincidences with this setup?
The multi-channel analyzer can be used to adjust the energy windows for the single-channel analyzer properly: The linear signal from the amplifier is given as input to the multi-channel analyzser, while the logical signal of the single-channel analyzer has to be set to input SCA IN or GATE of the multi-channel analyzer. Then, the coincidence and anticoincidence units allow to adjust the energy windows properly.
To avoid reflections at the multi-channel analyzer, the large piping wire has to be connected with a wave resistance. An optimal performance of the coincidence unit of the mulit-channel analyzer is obtained for a time delay below 100 ns.
4.3 Angular correlation measurement of the γγ-cascade c → b → a
For both γ-transitions, the width of the energy window has to be smaller than the full with at half maximum of the measured energy peaks. Why?. The measurement of the angular correlations has to be corrected for random coincidences to be comparable to theoretical predicitions. In addition, the theoretical predicitions for the angular corrections have to take into account the finit opening angle of theγ-counters. Both NaI (TI) crystals have a diameter of about 51 mm. It’s important to ensure that the measured spin-sequenze allows to determine the corresponding spin states unambigiously. In any case, calculate the coefficiences Ai or ai for the angular correlations of this cascade. In addition, one can measure the correlation of thed→b→acascade to estimate the variation in angular correlations, that can appear. However, interpreting these results is not straight forward and requires additional knowledge, which is beyond the scope of this experiments (keyword multipole mixture).
5 Experimental setup
Figure 4: 1) and 2) amplifier and single-channel analyzer for the scintillators A and B 3) delay unit 4) Linear Gate 5) coincidence unit 6) multi-channel analyzer 7) Level shifter 8) counter 9) high voltage supply for scintillator.
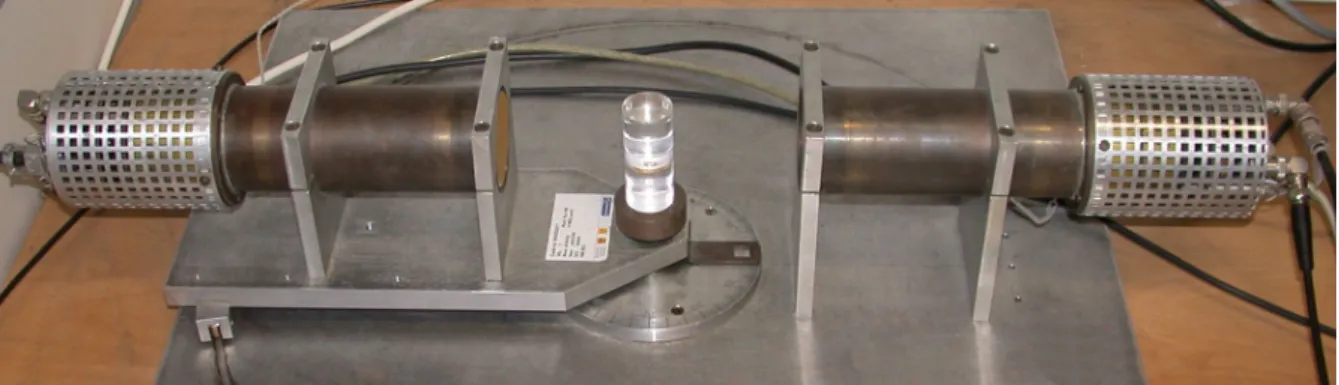
Figure 5: Experimental setup of the fixed scintillator (right) and the rotatable scintillator (left) with the natrium source in the center
6 List of equipments
As specified in the caption of Fig. 4and5.
7 Decay schemes
8 Literature
• Yates, M.: Finite Solid Angle Corrections, Perturbed Angular Corrections, North-Holland Pub- lishing Company, 1963
• Rose, M.: The Analysis of Angular Correlation and Angular Distibution Data, Phys. Review, Vol. 91, S. 610
• Klema, E.; McCowan, F.: γ-γ-Angular Correlation in60Ni, Phys. Review, Vol. 91, S. 616
• de Benedetti, S.: Nuclear Interactions, Interactions with Radiation, Wiley and Sons, 1964
• Zeitmessungen mit Koinzidenzen
• Coincidence Circuits
Additional literature(maybe put here links to paper) General comments:
The additional literature for this experiment includes various different documents, where the correspond- ing page numbers are given in the following. This collection may contain multiple description of the same topic. Thus,the reader can decide which one to choose on their preferance. However, in some cases, it might be useful to combine various documents to obtain a complete picture of the underlying theory. In particular, a succesfull operation of the experiment requires some thereotical knowlegde about multipole radiation.
In a classical and quantum-mechanical approache radiation fields and γ-quants are characterized by their angular momentum. The selection rules for the transition of atomic nuclei between different levels directly follow from the requirement of angular conservation for the system, which describes the radioac- tive source (the atomic nucleus) and the emitted γ-quants. The angular distribution of this radiation, which is characterizes by theL- andM-quantum numbers, are of particular importance.
For measuring the angular correlations, one has to undertand, that in general angular distributions of γ-quants from decays of excited nuclei, are isotrop. An anisotropic angular distribution can be obtained by measuring two γ-quants from a single nucleus decay under a specified angle with respect to each other (for this measuremnt a coincidence unit is required). Then, the angular correlation is given by the intensity distribution of the second γ−quant with respect to the direction of flight of the firstγ-quant.
The angular correlation provides distinct information about the spin transitions involved in the decay process under study.
Make yourself familiar with the following terms and definitions:
orbital angular momentum, nuclear spin, parity, level scheme of a nucleus
Descripitive illustration of γ-decay, multipol radiation, selection rules, emission probability (life time) (Both illustrations give a description of these terms, but do not allow for a theoretical understanding);
S. 10-26
Semi-classical theory of dipol radiation (As the method described here is not straightforward, this chap- ter is not necessary for the theoretical understanding); p. 27-35
Description of dipole radiation in a classical approach (essential for the understanding of this experi-
Optionally,Fl¨ugge,Theoretische Physik, Bd. 3 p. 155 ff. might be useful. However, these documents miss the consideration of angular momentum and correlation; p. 36 - 48
Three descriptions of angular correlations.
The first description includes a tabular with coefficients for angular correlations of frequently occuring spin-combinations. The second and third description give some expressions for the theoretical calcula- tion of angular distributions (p. 63,72); p. 49 - 73
Spherical functions; p. 74 - 77
Further notes concerning possible error sources and required corrections for the measurement of angular correlations; p. 78 - 80
9 Tips
Task: For the 2-week, beside c-b-a measurement, the d-b-a measurement is also expected.
Trouble-shooting: Modules used in FP are pretty old and the performance of some them are unstable.
As a qualified experimentalist, locating problem, figuring out solution and coming the right person for help are the abilities which are requested.
For example, if the performance of the coincidence module is not stable. You can use the oscilloscope to trace down the signal step by step to figure out the problem. Once you prove which module is wrong, you let the tutor or technician know.
At the beginning of the experiment, checking on all the instruments is also suggested, for example, A quick scan on the energy spectrum of the NaI source. Furthermore, since the γ-quant of the electron- positron annilation from NaI source is back-to-back, you can use this feature to measure the angular resolution which should be taken into account for the angular correction measurement.