Quantifying the medical student learning curve for ECG rhythm strip interpretation using deliberate practice
Abstract
Objectives:Obtaining competency in medical skills such as interpretation of electrocardiograms (ECGs) requires repeated practice and feedback.
Jason Waechter
1David Reading
2Structured repeated practice and feedback for ECGs is likely not
Chel Hee Lee
3provided to most medical students, so skill development is dependent
Mathieu Walker
4on opportunistic training during clinical rotations. Our aim was to de- scribe:
1. the amount of deliberate practice completed for learning ECG rhythm strip diagnoses in first year medical students,
1 University of Calgary, Depts.
of Critical Care and 2. the learning curve for rhythm strip diagnosis, and Anesthesiology, Calgary
(Alberta), Canada 3. student experiences with deliberate practice.
2 University of British Columbia, Dept. of Internal Methods:First year medical students from two medical schools were
provided with online rhythm strip practice cases. Diagnostic accuracy
Medicine, Vancouver (British Columbia), Canada
was measured throughout practice, and students were provided feed- back for every case they completed. Total cases practiced and time
3 University of Calgary, Dept.
of Mathematics and spent practicing were correlated with their performance during practice
and on an exam.
Statistics and Dept. of Critical Results:314 of 384 (82%) students consented. The mean number of
ECGs each student practiced was 59 (range 0-280), representing Care, Calgary (Alberta), Canada
18,466 total instances of deliberate practice. We generated mathem-
4 University of McGill, Dept. of Medicine, Division of atical models that accurately correlated both the number of cases
practiced and time spent practicing, with diagnostic accuracy on an
Cardiology, Montreal (Quebec), Canada exam (p<0.001). For example, students would need to spend on average
of 112 minutes and complete 34 practice cases to obtain 75% on an ECG rhythm strip exam. Student satisfaction was high using the online cases.
Conclusions:We succeeded in delivering deliberate practice for ECG rhythm strip interpretation to a large cohort of students at 2 medical schools. We quantified a learning curve that estimates the number of cases and practice time required to achieve pre-determined levels of diagnostic accuracy. This data can help inform a competency-based approach to curriculum development.
Keywords:learning curve, Electrocardiography, Competency-Based Education, deliberate practice
Introduction
Although electrocardiogram (ECG) interpretation is a core competency for all graduating medical students [1], liter- ature from the past 3 decades has consistently shown that ECG interpretation skills are consistently below ex- pectations for graduating medical students [2], [3], resid- ents in training [4], [5], [6], [7], [8], [9], and physicians in practice [10], [11], [12]. ECG interpretation errors may expose patients to harm through delayed diagnosis, inap- propriate investigations and treatment, and delays in appropriate treatment [13], [14]. There is an identified need for improvement to ECG learning in both undergradu- ate and residency training programs [15].
Unfortunately, variability and low performance of medical skills is not limited to ECG interpretation. High variability of procedural competence among residents, fellows, and attendings has been described for lumbar puncture [16], bariatric surgery [17], and insertion of intravascular catheters [18]. Such outcomes have generated calls for prompt changes to medical education [19].
Deliberate practice is widely cited as a key component of obtaining competence and mastery [20], [21]. Deliber- ate practice, a process of providing multiple iterations of structured practice and feedback until the trainee demonstrates the required competency [19], [22], [23], [24], has been described as superior to passive learning for skills acquisition [25], [26], [27]. Deliberate practice to obtain mastery has been demonstrated in multiple
domains including sports, gaming, the business world, and musical performance [28], [29]. Within medicine, studies have shown improved performance of specific skills via mastery learning approaches, including paracen- tesis, central line placement, and advanced cardiac life support skills [18], [30], [31].
The Clerkship Directors of Internal Medicine (CDIM) survey results in 2005 suggested that the majority of time spent on ECG teaching during clerkship was focused on didactic theory, with little formalized structured ECG practice [32].
Indeed, limited opportunities for practice and feedback have been identified as contributing to poor ECG interpret- ation skills [1].
The premise of a competency based learning approach is promotion based on performance that meets estab- lished standards. A population of students will demon- strate different learning rates for a given skill and will require different amounts of practice and feedback to obtain competency [32], [33]. Therefore, a flexible delivery of practice and feedback should help individualize training for each student’s needs. Further, the optimal number of ECG cases that need to be practiced to achieve com- petence, and the time required to complete this practice and feedback would be helpful in planning resources for learning ECGs; this is currently unknown [34].
The first objective of this paper was to describe the amount of deliberate practice completed by a cohort of first year medical students who were learning ECG rhythm strip diagnoses. Second, we aimed to mathematically quantify the learning curve for rhythm strip diagnosis with respect to both time and number of cases practiced. The third objective was to describe student opinions regarding their experiences with deliberate practice.
Methods
This was an observational associational cohort study that used a novel online platform to measure and describe practice behaviours and performance of medical students learning ECG rhythm strip diagnoses. An observational design was chosen because an experimental design was not possible for reasons of disparate treatment between intervention and control groups due to the absence of an appropriate pre-existing intervention with which to com- pare [35].
Setting and participants
A convenience sample of first year medical students en- rolled at 2 medical schools in Canada (McGill University and University of Calgary) in 2016 and 2017 were invited to participate in the study during their Cardiovascular courses. McGill offers 7 hours of lecture and 2 hours of workshop on ECG learning in a 6 week course; Calgary provides 7 hours of lecture and 0 hours of workshop in a 12 week course that is combined with the Respiratory curriculum. Both curricula include case based learning and some of these cases incorporate ECG’s. Students
were invited to participate via e-mail sent by the under- graduate office and in-class announcements. The Univer- sity of Calgary Conjoint Health Research Ethics Board approved the study. No funding was obtained for this study.
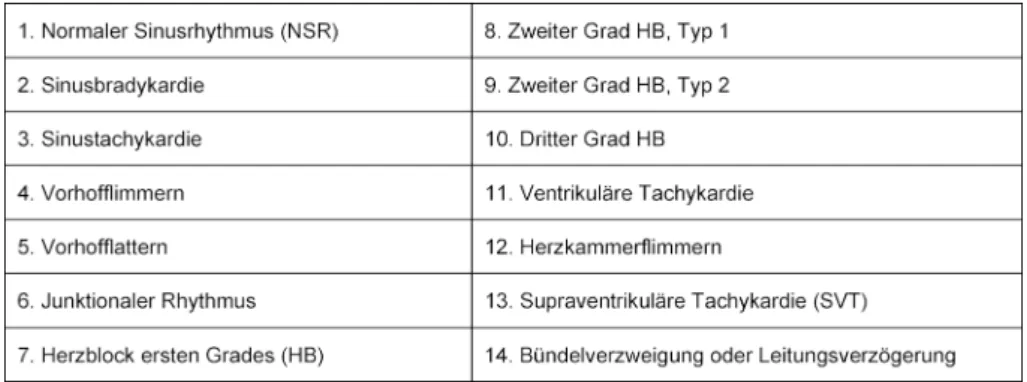
Students practiced rhythm strip cases through the freely accessible online modules on [https://
www.teachingmedicine.com/] during independent study time. The 14 different ECG diagnoses chosen for learning were based on the Advanced Cardiac Life Support (ACLS) rhythms that must be mastered in order to manage a cardiac arrest (see table 1). The ECG’s were presented as rhythm strips (as opposed to 12 lead ECGs). There were 3 discrete practice modules, each with one different example of the 14 diagnoses (including one normal rhythm). Thus, completion of one module guaranteed one exposure to each of the 14 diagnoses. Students were required to complete at least one practice module as part of their coursework. Students could practice each module as many times as they wanted. Performance during practice was quantified as the percentage of rhythm strips that were diagnosed correctly by each student, as com- pared to the correct answer that was unanimously agreed upon by 3 experts. Time to complete the practice modules was recorded by the online platform. The timer started when the module was entered and stopped when the module was exited. If there was no user activity for greater than 5 minutes, then 4 minutes was subtracted and the timer was stopped.
Each rhythm strip case required the student to answer 8 questions characterizing the ECG, followed by 2 questions about the diagnosis (see table 2). Except for the question on ventricular rate, all questions were multiple-choice with the diagnosis question providing 14 options. Motiv- ation techniques, such as showing students their evolving performance, popup messages that rewarded and encour- aged excellent performance, and providing comparison statistics between the user and the mean scores of their peers were built into the practice modules in an attempt to increase student engagement [36].
Multiple considerations informed the design of the feed- back that was provided [37]. Four types of immediate feedback were available to each student. First, answers were identified as correct or incorrect. Second, if the submitted diagnosis was incorrect, a table displayed the correct diagnosis, the student’s incorrect diagnosis, the diagnostic criteria of both diagnoses with highlighted differences between the two sets of criteria. Third, an explanatory discussion of the case was provided. The fourth form of feedback was the opportunity to ask questions of the course instructor via email, with an email response provided within 24 hours.
All student responses were recorded and made available for analysis. At the end of their Cardiovascular course, students completed a mandatory rhythm strip exam that counted toward 5% of their final course grade. Exam results from McGill were excluded from analysis because the exam questions were taken from the practice modules and thus did not represent a valid examination of previ-
Table 1: Diagnoses Included in Practice Cases
Table 2: Questions and Possible Answers Asked for Each Rhythm Strip.
ously unseen cases. The University of Calgary used an offline paper exam which contained no rhythm strips from the practice modules. Each rhythm strip exam case was comprised of a single diagnosis that was considered by 2 experts to be similar in difficulty to the practice cases, and contained the same diagnoses as the rhythm strips in the practice modules. Performance on the exam was defined as the percentage of rhythm strips that were correctly diagnosed. Failure to complete the mandatory
practice module or the exam resulted in an “Incomplete”
status in the course.
Data analysis
Data was de-identified and exported to a local computer.
Data was analyzed using R-3.5.1 [38], nlme-3.1-137 [39], Stata 10.0 (Statacorp LLP) and Excel software (Microsoft Excel for Mac, Version 15.28). Descriptive statistics, in-
cluding means (with standard deviations [SD]) and pro- portions, were used to summarize survey data.
Practice data
This data is comprised of two independent populations, is non-linear and compares multiple paired samples per individual; the individuals do not all have the same number of paired samples. Two scatter plots were created to observe the relationships between diagnostic accuracy and time per module spent practicing vs. the number of modules completed. The Gompertz function was used to graphically represent the means of this data [40]. Differ- ences between the 2 schools were assessed using AN- COVA. Differences between paired successive modules were tested for significance using paired t-tests with Bonferoni correction.
Exam data
This data is comprised of one population, is non-linear, unpaired and it is assumed that all observations are in- dependently measured. One scatter plot was created to observe the relationship between diagnostic accuracy and total time spent practicing vs. the number of modules completed. Based on visual inspection of this scatter plot, three mathematical functions: Gompertz function, Michael- is-Menten (MM) function, and quadratic function were chosen as possible candidates to represent these 2 rela- tionships [40]. The coefficients associated with the models were assessed for statistical significance of their fit to the data. Alpha was set to 0.05 a priori. Akaike in- formation criteria (AIC) and correlation between observed and predicted measurements are used for measuring the goodness fit of the mathematical models.
Results
Amount of practice
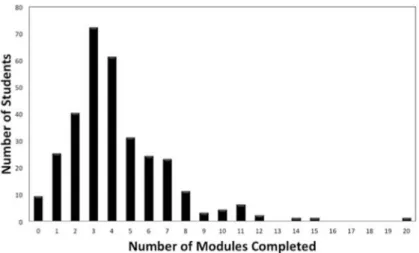
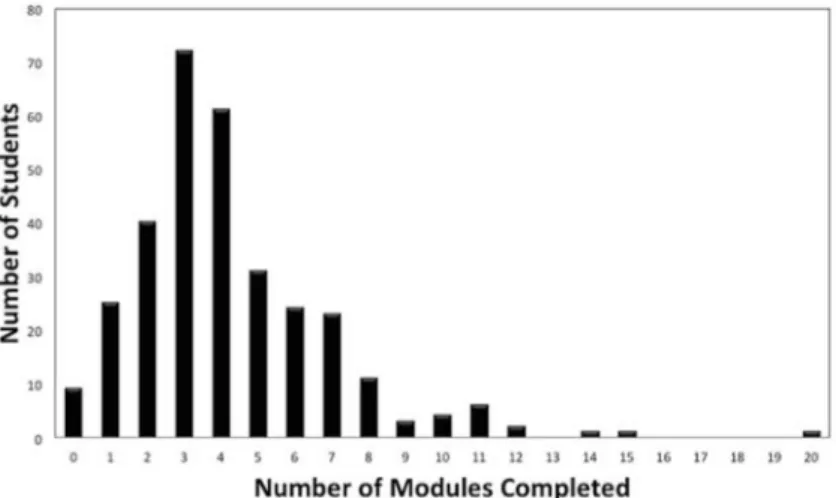
A total of 384 students were invited to participate and 314 (82%) consented. Among the 298 (95%) of consen- ted participants who completed the pre-survey, the mean age was 24.9 (SD=4.2) years and 54% were female. 14 (4%) students indicated they had previously used online practice modules for rhythm strip learning. The mean number of times each of the 14 diagnoses were practiced per student was 4.1 (SD=2.7), representing 59 rhythm strips practiced per student (see figure 1). A total of 24 (8%) students practiced only the mandatory single module prior to the exam. Nine students did not complete the mandatory module prior to the exam and completed it after the exam. Forty-eight students completed 10 or more modules, which translated to ≥140 rhythm strips each. The maximum number of modules completed by a student was 20, representing 280 rhythm strips. The total number of rhythm strips practiced by all 314 students
was 18,466 and thus 18,466 instances of feedback were delivered.
Practice performance
Figure 2, left and right shows the scatter plots relating the number of practice modules completed with diagnost- ic accuracy and per module practice time in two different schools during practice. There were no statistical differ- ences in diagnostic accuracy during practice between the two schools. There were no statistical differences in per module practice time between the two schools except for one time point (at module 3). Differences in diagnostic accuracy between consecutive modules showed statistic- ally significant increases between modules: 1 and 2; 2 and 3; not 3 and 4, but again 4 and 5, indicating that diagnostic accuracy was continuing to increase through modules 1-3 and possibly also continuing up to module 5 (full statistical values reported in online supplemental material Nr. 1 see attachment 1). Differences in per module practice time significantly decreased between consecutive modules: 1 and 2; through to modules 7 and 8 inclusive, indicating that speed was continuing to in- crease throughout all these modules.
Exam performance
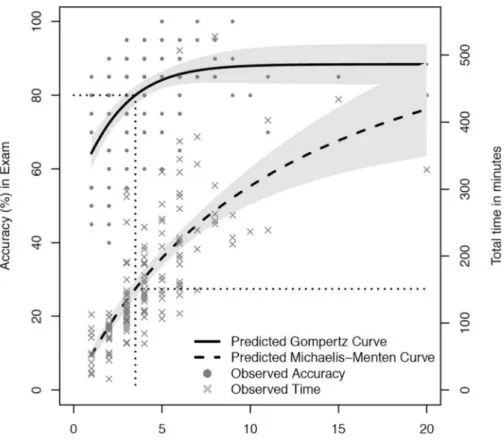
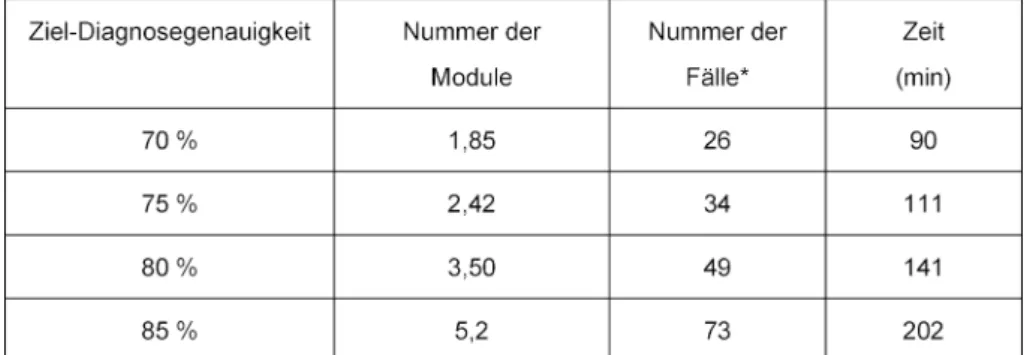
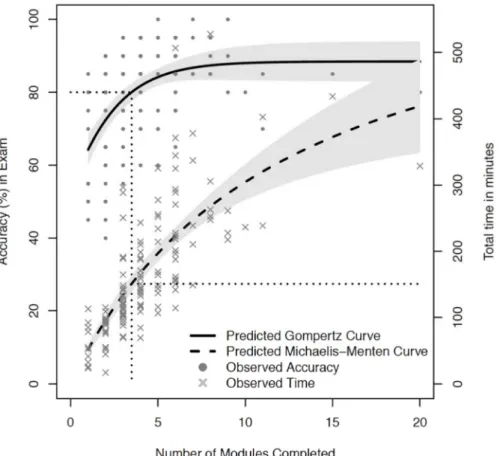
The mathematical function that best approximated the diagnostic accuracy learning curve was the Gompertz equation with the following coefficients: Y~88*exp (0.51*exp (0.47*M)). The function that best described the total practice time curve was the Michaelis-Menten function with the coefficients: Y~671*M/(12.1+M). M represents the number of modules completed. The AIC goodness of fit assessment for both of these mathemat- ical functions produced p values<0.001 for all coefficients in the models. These curves are used to estimate the workload required by students to obtain a pre-defined level of performance on the exam. A two-stage model for finding the time spent practicing from the expected accur- acy is illustrated in figure 3. The estimate Gompertz model is used to find the corresponding required number of modules, which is then used as an input for the estim- ated Michaelis-Menten function to predict the time needed for practice. Table 3 shows the total practice time and required number of modules practiced to achieve scores ranging from 70 to 85% on the exam.
In the pre-survey, students reported how much time they spent practicing rhythm strip interpretations prior to the research study; when students were stratified according to pre-study practice, there were no statistical differences in exam performance.
Student satisfaction
Based on the survey completed at the end of the Cardi- ovascular courses, 174 (of 314 who consented) students indicated that the learning modules were effective (97%), efficient (97%) and enjoyable (92%) (online supplement
Figure 1: The number of modules completed by each student. One module contains 14 rhythm strip cases.
Figure 2: Left shows diagnostic accuracy during practice of two difference medical schools during rhythm strip practice. Right shows per module practice time. There are no significant differences between the two schools except for one time difference
at module #3, which is likely not “clinically” significant.
Table 3: Number of Modules Completed and Total Practice Time required to achieve pre-defined Target Diagnostic Accuracies.
material Nr. 2 see attachment 2). Most students believed practice is required to learn ECG interpretation (99%), that immediate feedback was helpful (95%), and that they were interested in using the same method for learning other diagnostic skills, such as x-ray and ultra- sound interpretation (99%).
Instructor workload
In terms of instructor workload to respond to feedback emails from the students, a total of 14 email questions were submitted by students from McGill and 37 were submitted by Calgary students. Comparing emails to total cases practiced, 51 feedback emails were submitted for
Figure 3: Diagnostic accuracy and total practice time are plotted against the total number of modules practiced. The solid line curve is the Gompertz curve that estimates diagnostic accuracy. The dashed curve is the Michaelis-Menten curve that estimates total practice time. Grey shaded regions represent 95% CI. The horizontal and vertical dotted line shows an exemplar 80%
diagnostic accuracy mapping to the estimated number of modules and total practice time required to obtain this competency level. See also tab. 3 for calculated values.
18,466 practice cases, which is approximately 1 email for every 360 cases practiced.
Discussion
Our data shows that first year medical students practiced interpreting a mean of 59 rhythm strips prior to a rhythm strip exam and in total, over 18,000 instances of feed- back were provided to 314 students at 2 different med- ical schools. This is important for several reasons. First, challenges have been reported on providing feedback for deliberate practice [37]. We have described the details of successfully providing feedback for deliberate practice to two large cohorts of medical students, thus addressing a need identified within medical education literature.
Second, our previously unpublished local data demon- strated that when practice was not mandated and there was no rhythm strip exam, students completed a mean of only 6 practice rhythm strips despite strong promotion and encouragement to practice by instructors [41].
Comparing these findings to the findings of our current study, introducing a mandatory practice module and a dedicated rhythm strip summative exam resulted in a 9- fold increase in practice behaviours by the students. The students were willing, able and motivated to practice well beyond the mandated workload by the course instructors,
completing a mean of 59 practice rhythm strips when only 14 were required.
The dedicated rhythm strip summative exam was likely a strong motivator for student practice behaviour. Other studies have described the positive impact of summative assessments specifically on student performance on ECG interpretation [42], [43]. In residency training programs, periodic objective assessments of ECG interpretation skills have been recommended [34]. In addition to form- ative feedback, Raupach et al. have identified that sum- mative feedback increased medium term retention of ECG interpretation skills regardless of teaching technique and thus, should be strongly considered as an important component for skill retention [44].
The learning curve for ECG rhythm strip interpretation in medical students has not been previously quantified. A learning curve is a graphic illustration relating a metric of time or effort with performance of a skill [22]. We demonstrated that the diagnostic accuracy and time spent practicing were very similar between students at two dif- ferent medical schools. Students continued to demon- strate improvement both in diagnostic accuracy and speed of diagnosis while practicing up to 4 modules (56 cases). The value of 56 cases emphasizes the large number of practice cases that should be made available to students so that they have the opportunity to continue to practice while they are continuing to improve. Identify-
ing when the learning curve reaches its asymptote is im- portant to indicate when learning probably stops.
Using the curves in figure 3, the number of ECG cases and the time required to obtain pre-determined levels of competency in first year medical students can be determ- ined (see table 3). This information is valuable for stu- dents to help them budget their study time and set real- istic goals of performance. The results of the learning curve analysis can also provide direction for curriculum development; a competency standard of diagnostic accur- acy can first be chosen and the learning curves estimate how much deliberate practice is required for the students.
For example, if the competency standard is set to 75%
diagnostic accuracy, 34 practice cases and 111 minutes of practice will be required for the average medical stu- dent to achieve this level of performance. We feel strongly that the responsibility of providing the required practice and feedback to obtain medical skills belongs to the medical school and its faculty, in contrast to being im- posed on the students.
Previous calls for changes to how ECG interpretation is taught suggests that more practice opportunities are re- quired [2]. The 2013 CDIM survey of internal medicine clerkship programs reported on the number of 12 lead ECGs that students in third year clerkship rotations formally interpreted under supervision [1]. Students from only 37% of medical schools formally interpreted more than ten 12-lead ECGs during their internal medicine ro- tation [1]. All other respondents indicated that their stu- dents interpreted fewer ECGs, or did not respond to this question. Data for pre-clerkship ECG training, which is the population we studied, is sparse.
Our study investigated rhythm strip interpretation and not 12 lead ECG interpretation. However, 12 lead ECG interpretation is more complex than rhythm strips and thus, could be expected to require even more practice than rhythm strips to achieve competency. Our results, combined with the results of the CDIM survey, may sug- gest that the ECG practice needs of students are not be- ing met at many medical schools. To further highlight the gap between what is provided to trainees and what is needed by trainees, the ACC/AHA guidelines for learning 12 lead ECGs recommend that initial learning should in- corporate a minimum of 500 supervised interpretations [45], although the evidence for this recommendation is unclear.
One of the key components of skill development is feed- back [46]. Formative feedback can help students self- monitor and determine if they have met the competency standards defined by their school [47], [48]. The quality and nature of feedback has a strong influence on motiv- ation [49], and is suggested to be most useful when in- structors assume an active role in the learning process [50]. An absence of feedback or lack of support can lead to low motivation and early termination of self-directed courses [49]. Therefore, a self-directed learning resource should incorporate direct involvement of instructors. Our learning tool provided a blended form of feedback, includ- ing 3 different components of automated feedback, and
an email function that enabled efficient involvement of the local instructor.
There are logistical challenges to providing individualized feedback to students when there are many students and few instructors. The first consideration is scalability and feasibility. For example, for a class of 100 students where each student completes 50 practice ECGs, feedback would be required 5,000 times. To provide deliberate practice to our cohort of 314 students, 18,466 instances of both practice and feedback were required. With com- puter algorithms providing automated feedback, the workload of providing additional email feedback was low for the instructors. The workload of additional feedback that was requested from students via email to their local instructors was on average, 25 emails per instructor and not deemed overwhelming. Viewed another way, there was one feedback email question for every 360 cases practiced.
Another advantage of automated feedback is consistency;
all learners receive the same quality of feedback because the influence of assessor variability is removed from the process. Additionally, the quality of the feedback can be increased over time as performance data of students is collected and analyzed and common errors are identified.
This information informs modifications to case discus- sions, so that common errors can be directly and pre- emptively addressed.
A positive emotional response to a learning environment facilitates student engagement [51], [52]. Our survey data confirmed that 92% of students described the delib- erate practice learning process as “very fun” or “a little enjoyable”. Student experiences may also have been positively influenced by their perception that the learning resources were both effective and efficient. Additionally, individualized feedback likely also contributed to both student satisfaction and performance, given that students indicated that instant feedback was either “absolutely required” (95%) or “helpful” (4%).
Strengths of this study include unobtrusive collection of learning analytics during core curricular activities, thereby minimizing participant bias and maximizing data collec- tion. Enrolling students from 2 medical schools increases the generalizability of our findings. The study was easy to implement and will be scalable for future study of other diagnostic skills.
There are many limitations to our research. A comparative experimental design is methodologically stronger, but the absence of a control group with whom we could justify equipoise was not possible. No previous method of providing deliberate practice existed at either medical school and we could not randomize students into a group that did not practice; therefore, our study was observa- tional.
Our independent variable was quantified on the basis of module completion, and not individual case completion.
If we had structured our data collection on individual cases completed instead of the modules completed, we would have obtained higher fidelity data. Realizing this limitation after data collection, we have modified the data
collection software to enable future projects to analyze case by case data.
Post analysis, we realize that our digital practice library is likely too small to meet the needs of the average stu- dent should we target a diagnostic accuracy of 80% or greater. Further, dividing the cases into 3 separate mod- ules likely creates artificial and possibly meaningless stop points for the learner; it would probably be better to have all practice cases within one module, and have well in excess of 50 practice cases to help ensure there are enough cases for students at the slower end of the learning curve. As we have a total of 42 unique cases, we fall short of this goal and this is a limitation in our study because students who practiced more than 42 cases were repeating cases they had previously practiced.
We measured short term retention of rhythm strip inter- pretation; the exact timing of when the students com- pleted practice was not measured, but was contained within a 10 week learning block and it is probable that a lot of practicing occurred within a 2-3 week proximity of the exam. We cannot extrapolate our results to long term retention, but hope to be able to re-assess students in more senior years of training and repeat our analysis with long term (2 years) retention.
We studied performance in ACLS level rhythm strip ECG interpretation and these results cannot be extrapolated to full 12 lead ECG interpretation, which involves more analysis, and often multiple co-existing diagnoses.
Importantly, the students were interpreting the ECG rhythms without any clinical context; diagnostic interpret- ation might change when patient information is provided [53], [54].
To our knowledge, our students used primarily one learning tool for practicing ECG’s. Therefore, we cannot extrapolate our results to other learning tools; it would, however, be very interesting to compare learning curve slopes for different tools so that the tool that produces the fastest learning with least effort could be identified.
Further, our assessment tool (the rhythm strip exam) has not yet been formally validated.
Another limitation in our study is the lack of analysis on each individual learner; we are reporting means of per- formance across many students. Not all learners follow the same learning curve; in fact, the mean of student performance rarely describes the performance of an indi- vidual student [55].
In conclusion, we successfully provided deliberate prac- tice to a large cohort of first year medical students and our data quantifies a learning curve for ACLS level rhythm strip interpretation using a specific online learning mod- ule. These results may assist in curricular design for ECG rhythm strip interpretation, a required skill for managing cardiac arrest.
Notes
Jason Waechter is the founder of teachingmedicine.com.
The modules used for this project are currently open ac- cess and freely accessible.
Ethical approval
The University of Calgary Conjoint Health Research Ethics Board has approved this research study (REB14- 0654_MOD2). The University of McGill has approved this research study (IRB study number A07-E50-15B).
Previous presentations
Poster presentation titled “Learning Curves for ECG Inter- pretation: Correlating Deliberate Practice with Perform- ance.” Presented at the 2017 Canadian Conference for Medical Education (CCME)
Acknowledgement
We would like to thank Dr. Rachel Ellaway and Dr. Martin Pusic both for editing the manuscript and providing sup- port for the project.
Competing interests
The authors declare that they have no competing in- terests.
Attachments
Available from
https://www.egms.de/en/journals/zma/2019-36/zma001248.shtml 1. Attachment_1.pdf (63 KB)
Statistical analysis of practice data 2. Attachment_2.pdf (68 KB)
Pre-survey completed by 298 students
References
1. Jablonover RS, Stagnaro-Green A. ECG as an Entrustable Professional Activity: CDIM Survey Results, ECG Teaching and Assessment in the Third Year. Am J Med. 2016;129(2):226-230.
DOI: 10.1016/j.amjmed.2015.10.034
2. Jablonover RS, Lundberg E, Zhang Y, Stagnaro-Green A.
Competency in Electrocardiogram Interpretation Among Graduating Medical Students. Teach Learn Med. 2014;26(3):279- 284. DOI: 10.1080/10401334.2014.918882
3. Kopec G, Magon W, Holda M, Podolec P. Competency in ECG Interpretation Among Medical Students. Med Sci Monit 2015;21:3386-3394. DOI: 10.12659/MSM.895129
4. Pinkerton RE, Francis CK, Ljungquist KA, Howe GW.
Electrocardiographic training in primary care residency programs.
JAMA. 1981;246(2):148-150. DOI:
10.1001/jama.1981.03320020040021
5. Sur DK, Kaye L, Mikus M, Goad J, Morena A. Accuracy of electrocardiogram reading by family practice residents. Fam Med. 2000;32(5):315-319.
6. Goodacre S, Webster A, Morris F. Do computer generated ECG reports improve interpretation by accident and emergency senior house officers? Postgrad Med J. 2001;77(909):455-457. DOI:
10.1136/pmj.77.909.455
7. Higueras J, Gómez-Talkavera S, Ganadas V, Bover R, Losas M, Gómez-Polo JC, Olmos C, Fernandez C, Villacastin J, Macaya C.
Expertise in Interpretation of 12-Lead Electrocardiograms of Staff and Residents Physician: Current Knowledge and Comparison between Two Different Teaching Methods. J Caridol Curr Res.
2016;5(3):00160. DOI: 10.1546/jccr.2016.05.00160 8. Hartman ND, Wheaton NB, Williamson K, Quattromani EN,
Branzetti JB, Aldeen AZ. A Novel Tool for Assessment of Emergency Medicine Resident Skill in Determining Diagnosis and Management for Emergent Electrocardiograms: A Multicenter Study. J Emerg Med. 2016;51(6):697-704. DOI:
10.1016/j.jemermed.2016.06.054
9. Eslava D, Dhillon S, Berger J, Homel P, Bergmann S. Interpretation of electrocardiograms by first-year residents: the need for change.
J Electrocardiol. 2009;42(6):693-697. DOI:
10.1016/j.jelectrocard.2009.07.020
10. Morrison WG, Swann IJ. Electrocardiograph interpretation by junior doctors. Arch Emerg Med. 1990;7(2):108-110. DOI:
10.1136/emj.7.2.108
11. Jayes RL Jr, Larsen GC, Beshansky JR, D'Agostino RB, Selker HP.
Physician electrocardiogram reading in the emergency department – accuracy and effect on triage decisions: findings from a multicenter study. J Gen Intern Med. 1992 Jul- Aug;7(4):387-92. DOI: 10.1007/bf02599153
12. Kuhn M, Morgan MT, Hoffman JR. Quality assurance in the emergency department: evaluation of the ECG review process.
Ann Emerg Med. 1992;21(1):10-15. DOI: 10.1016/S0196- 0644(05)82229-2
13. Kohn LT, Corrigan JM, Donaldson MS. To Err is Human: Building a Safer Health System. Washington (DC): National Academies Press (US); 2000.
14. Snoey ER, Housset B, Guyon P, ElHaddad S, Valty J, Hericord P.
Analysis of emergency department interpretation of electrocardiograms. J Acc Emerg Med. 1994;11(3):149-153.
DOI: 10.1136/emj.11.3.149
15. Eslava D, Dhillon S, Berger J, Homel P, Bergmann S. Interpretation of electrocardiograms by first-year residents: the need for change.
J Electrocard. 2009;42(6):693-697. DOI:
10.1016/j.jelectrocard.2009.07.020
16. Barsuk JH, Cohen ER, Caprio T, Mcgaghie WC, Simuni T, Wayne DB. Simulation-based education with mastery learning improves residents' lumbar puncture skills. Neurol. 2012;79(2):132- 137. DOI: 10.1212/WNL.0b013e31825dd39d
17. Dlouhy BJ, Rao RC. Surgical skill and complication rates after bariatric surgery. New Engl J Med. 2014;370(3):285-. DOI:
10.1056/NEJMc1313890
18. Barsuk JH, Ahya SN, Cohen ER, Mcgaghie WC, Wayne DB. Mastery learning of temporary hemodialysis catheter insertion by nephrology fellows using simulation technology and deliberate practice. Am J Kidney Dis. 2009;54(1):70-76. DOI:
10.1053/j.ajkd.2008.12.041
19. Cohen ER, Mcgaghie WC, Wayne DB, Lineberry M, Yudkowsky R, Barsuk JH. Recommendations for Reporting Mastery Education Research in Medicine (ReMERM). Acad Med. 2015;90(11):1509- 1514. DOI: 10.1097/ACM.0000000000000933
20. Mcgaghie WC, Barsuk JH, Wayne DB. Mastery Learning With Deliberate Practice in Medical Education. Acad Med.
2015;90(11):1575. DOI: 10.1097/ACM.0000000000000876 21. Ericsson KA. Acquisition and maintenance of medical expertise:
a perspective from the expert-performance approach with deliberate practice. Acad Med. 2015;90(11):1471-1486. DOI:
10.1097/ACM.0000000000000939
22. Pusic M, Pecaric M, Boutis K. How Much Practice Is Enough?
Using Learning Curves to Assess the Deliberate Practice of Radiograph Interpretation. Acad Med. 2011;86(6):731-736. DOI:
10.1097/ACM.0b013e3182178c3c
23. Ericsson KA. Deliberate practice and the Acquisition and Maintenance of Expert Performance in Medicine and Related Domains. Acad Med. 2004;79(10 Suppl):S70-81. DOI:
10.1097/00001888-200410001-00022
24. Kirkman MA. Deliberate practice, domain-specific expertise, and implications for surgical education in current climes. J Surg Educ.
2013;70(3):309-317. DOI: 10.1016/j.jsurg.2012.11.011 25. Mcgaghie WC, Issenberg SB, Cohen ER, Barsuk JH, Wayne DB.
Does Simulation-Based Medical Education With Deliberate Practice Yield Better Results Than Traditional Clinical Education?
A Meta-Analytic Comparative Review of the Evidence. Acad Med.
2011;86(6):706-711. DOI: 10.1097/ACM.0b013e318217e119 26. Duckworth AL, Kirby TA, Tsukayama E, Berstein H, Ericsson KA.
Deliberate Practice Spells Success: Why Grittier Competitors Triumph at the National Spelling Bee. Soc Psychol Person Sci.
2011;2(2):174-181. DOI: 10.1177/1948550610385872 27. Mcgaghie WC, Issenberg SB, Cohen ER, Barsuk JH, Wayne DB.
Medical Education Featuring Mastery Learning With Deliberate Practice Can Lead to Better Health for Individuals and Populations. Acad Med. 2011;86(11):e8-e9. DOI:
10.1097/ACM.0b013e3182308d37
28. Macnamara BN, Moreau D, Hambrick DZ. The Relationship Between Deliberate Practice and Performance in Sports. Perspect Psychol Sci. 2016;11(3):333-350. DOI:
10.1177/1745691616635591
29. Macnamara BN, Hambrick DZ, Oswald FL. Deliberate Practice and Performance in Music, Games, Sports, Education, and Professions: A Meta-Analysis. Psychol Sci. 2014;25(8):1608- 1618. DOI: 10.1177/0956797614535810
30. Wayne DB, Butter J, Siddall VJ, Fudala MJ, Wade LD, Feinglass J, McGaghie WC. Mastery learning of advanced cardiac life support skills by internal medicine residents using simulation technology and deliberate practice. J Gen Intern Med.
2006;21(3):251-256. DOI: 10.1111/j.1525-1497.2006.00341.x 31. Barsuk JH, Cohen ER, Vozenilek JA, O'Connor LM, Mcgaghie WC, Wayne DB. Simulation-based education with mastery learning improves paracentesis skills. J Grad Med Educ. 2012;4(1):23- 27. DOI: 10.4300/JGME-D-11-00161.1
32. O'Brien KE, Cannarozzi ML, Torre DM, Mechaber AJ, Durning SJ.
Training and Assessment of ECG Interpretation Skills: Results From the 2005 CDIM Survey. Teach Learn Med. 2009;21(2):111- 115. DOI: 10.1080/10401330902791255
33. Englander R, Flynn T, Call S, Carraccio C, Cleary L, Fulton TB, et al. Toward Defining the Foundation of the MD Degree: Core Entrustable PRofessional Activities for Entering Residency. Acad Med. 2016;91(10):1352-1358. DOI:
10.1097/ACM.0000000000001204
34. Salerno SM, Alguire PC, Waxman HS. Competency in Interpretation of 12-Lead Electrocardiograms: A Summary and Appraisal of Published Evidence. Ann Intern Med.
2003;138(9):751-760. DOI: 10.7326/0003-4819-138-9- 200305060-00013
35. Ringsted C, Hodges B, Scherpbier A. 'The research compass': An introduction to research in medical education: AMEE Guide No.
56. Med Teach. 2011;33(9):695-709. DOI:
10.3109/0142159X.2011.595436
36. Fleishman EA. On the relation between abilities, learning, and human performance. Am Psychol. 1972:1017-1032. DOI:
10.1037/h0033881
37. Eppich WJ, Hunt EA, Duval-Arnould JM, Siddall VJ, Cheng A.
Structuring Feedback and Debriefing to Achieve Mastery Learning Goals. Acad Med. 2015;90(11):1501-1508. DOI:
10.1097/ACM.0000000000000934
38. Team RC. R: A Language and Environment for Statistical Computing. 2014.
39. Pinheiro J, Bates D, DebRoy S, Sarkar D. nlme: Linear and Nonlinear Mixed Effects Models. 2018.
40. Paine CET, Marthews TR, Vogt DR, Purves D, Rees M, Hector A, Turnball LA. How to fit nonlinear plant growth models and calculate growth rates: an update for ecologists. Method Ecol Evol. 2011;3(2):245-256. DOI: 10.1111/j.2041-
210X.2011.00155.x
41. Waechter J. Unpublished data from University of Calgary, Undergraduate Medical School, years 2014-2017. Calgary:
University of Calgary; 2017.
42. Raupach T, Brown J, Anders S, Hasenfuss G, Harendza S.
Summative assessments are more powerful drivers of student learning than resource intensive teaching formats. BMC Med.
2013;11(1):61. DOI: 10.1186/1741-7015-11-61
43. Raupach T, Hanneforth N, Anders S, Pukrop T, Th J ten Cate O, Harendza S. Impact of teaching and assessment format on electrocardiogram interpretation skills. Med Educ.
2010;44(7):731-740. DOI: /10.1111/j.1365- 2923.2010.03687.x
44. Raupach T, Andresen JC, Meyer K, Strobel L, Koziolek M, Jung W, Brown J, Anders S. Test-enhanced learning of clinical reasoning: a crossover randomised trial. Med Educ.
2016;50(7):711-720. DOI: 10.1111/medu.13069 45. Kadish AH, Buxton AE, Kennedy HL, Knight BP, Mason JW,
Schuger CD, Tracy CM, Winters WL Jr, Boone AW, Elnicki M, Hirshfeld JW Jr, Lorell BH, Rodgers GP, Tracy CM, Weltz HH;
American College of Cardiology/American Heart
Association/American College of Physicians-American Society of Internal Medicine Task Force; International Society for Holter and Noninvasive Electrocardiology. ACC/AHA clinical competence statement on electrocardiography and ambulatory
electrocardiography: A report of the ACC/AHA/ACP-ASIM task force on clinical competence (ACC/AHA Committee to develop a clinical competence statement on electrocardiography and ambulatory electrocardiography). Circulation.
2001;104(25):3169-3178. DOI: 10.1161/circ.104.25.3169 46. Mitchell T, Chen SY, Macredie RD. The relationship between web
enjoyment and student perceptions and learning using a web- based tutorial. Learn Media Technol. 2005;30(1):27-40. DOI:
10.1080/13581650500075546
47. Harlen W, Crick RD. A systematic review of the impact of Summative assessment and tests on students' motivation for Learning (EPPI-Centre Review, version 1.1*). Research Evidence in Education Library.: EPPI Center; 2002.
48. Pusic MV, Chiaramonte R, Gladding S, Andrews JS, Pecaric MR, Boutis K. Accuracy of self-monitoring during learning of radiograph interpretation. Med Educ. 2015;49(8):838-846. DOI:
10.1111/medu.12774
49. Orrell J. Feedback on learning achievement: rhetoric and reality.
Teach High Educ. 2006;11(4):441-456. DOI:
10.1080/13562510600874235
50. Ericsson KA, Krampe RT, Tesch-Römer C. The role of Deliberate Practice in the Acquisition of Expert Performance. Psychol Rev.
1993;100(3):363-406. DOI: 10.1037/0033-295X.100.3.363 51. Malone TW. Toward a theory of intrinsically motivating instruction.
Cogn Sci. 1981;5(4):333-369. DOI:
10.1207/s15516709cog0504_2
52. Huang WH, Soman D. A Practitioner's Guide to Gamification of Education. Research Report Series Behavioural Economics in Action. Toronto: University of Toronto, Rotman School of Management; 2013.
53. Grum CM, Gruppen LD, Woolliscroft JO. The influence of Vignettes on EKG Interpretation by Third-year Students. Acad Med.
1993;68(10 Suppl):S61-63. DOI: 10.1097/00001888- 199310000-00047
54. Hatala R, Norman GR, Brooks LR. Impact of a clinical scenario on accuracy of electrocardiogram interpretation. J Gen Intern Med. 1999;14(2):126-129. DOI: 10.1046/j.1525-
1497.1999.00298.x
55. Pusic MV, Boutis K, Hatala R, Cook DA. Learning Curves in Health Professions Education. Acad Med. 2015;90(8):1034-1042. DOI:
10.1097/ACM.0000000000000681
Corresponding author:
Clin. Associate Prof. Jason Waechter, MD University of Calgary, Depts. of Critical Care and
Anesthesiology, 1403 29 St NW, Calgary (Alberta), Canada jason.waechter@ahs.ca
Please cite as
Waechter J, Reading D, Lee CH, Walker M. Quantifying the medical student learning curve for ECG rhythm strip interpretation using deliberate practice. GMS J Med Educ. 2019;36(4):Doc40.
DOI: 10.3205/zma001248, URN: urn:nbn:de:0183-zma0012482
This article is freely available from
https://www.egms.de/en/journals/zma/2019-36/zma001248.shtml
Received:2018-10-29 Revised:2019-04-07 Accepted:2019-05-28 Published:2019-08-15
Copyright
©2019 Waechter et al. This is an Open Access article distributed under the terms of the Creative Commons Attribution 4.0 License. See license information at http://creativecommons.org/licenses/by/4.0/.
Quantifizierung der Lernkurve von Medizinstudierenden für die EKG-Rhythmusstreifeninterpretation im Rahmen einer bewussten Praxis (Deliberate Practice)
Zusammenfassung
Ziele:Der Kompetenzerwerb von medizinischen Fähigkeiten wie der Interpretation von Elektrokardiogrammen (EKGs) erfordert wiederholtes
Jason Waechter
1David Reading
2Üben und Feedback. Strukturierte wiederholte Übungen und Feedback
Chel Hee Lee
3für die Durchführung von EKGs stehen den meisten Medizinstudierenden
Mathieu Walker
4in der Regel nicht zur Verfügung, sodass der Kompetenzerwerb von einer opportunistischen Ausbildung im Rahmen klinischer Praktika abhängt.
Unser Ziel war die Untersuchung folgender Aspekte:
1 University of Calgary, Depts.
of Critical Care and 1. die Anzahl der bewussten Übungen zum Erlernen der EKG-Rhyth-
musstreifendiagnose bei Medizinstudierenden im ersten Jahr, Anesthesiology, Calgary (Alberta), Kanada 2. die Lernkurve für eine Rhythmusstreifendiagnose und
3. die Erfahrungen der Studierenden mit bewusstem Üben. 2 University of British Columbia, Dept. of Internal Methodik:Medizinstudierenden des ersten Jahrgangs zweier medizini-
scher Fakultäten wurden online Übungsfälle zum Thema Rhythmusstrei-
Medicine, Vancouver (British Columbia), Kanada
fen bereitgestellt. Die diagnostische Genauigkeit wurde während der 3 University of Calgary, Dept.
of Mathematics and gesamten Übungen gemessen und die Studierenden erhielten für jeden
abgeschlossenen Fall ein Feedback. Die Gesamtzahl der geübten Fälle Statistics and Dept. of Critical Care, Calgary (Alberta), Kanada
und die Zeit, die mit dem Üben verbracht wurde, wurden mit ihrer Leistung während der Übungen und bei einer Prüfung korreliert.
Resultate:314 von 384 (82%) Studierende willigten ein. Die durch- schnittliche Anzahl der EKGs, mit denen jeder Studierende übte, betrug
4 University of McGill, Dept. of Medicine, Division of Cardiology, Montreal (Quebec), Kanada 59 (Gesamtanzahl 0-280), was einer Gesamtzahl von 18.466 Fällen
bewusster Praxis entspricht. Wir generierten mathematische Modelle, die sowohl die Anzahl der geübten Fälle als auch die Zeit, die mit der Übung verbracht wurde, genau mit der diagnostischen Korrektheit bei einer Prüfung korrelierten (p<0.001). Beispielsweise mussten die Stu- dierenden durchschnittlich 112 Minuten und 34 Übungsfälle absolvie- ren, um 75% für eine EKG-Rhythmusstreifenprüfung zu erhalten. Die Zufriedenheit der Studierenden war bei den Online-Fällen hoch.
Schlussfolgerungen: Es ist uns gelungen, einer großen Gruppe von Studierenden an zwei medizinischen Fakultäten eine gezielte Übung zur Interpretation von EKG-Rhythmusstreifen bereitzustellen. Wir quantifizierten eine Lernkurve, welche eine Schätzung der Anzahl der Fälle und die Übungszeit darstellt, die benötigt werden, um ein vorgege- benes, diagnostisches Genauigkeitsniveau zu erreichen. Diese Daten können zur Entwicklung eines kompetenzbasierten Curriculum-Ansatzes beitragen.
Schlüsselwörter:Lernkurve, Elektrokardiographie, Kompetenzbasierte Ausbildung, bewusste Praxis, Deliberate Practice
Einleitung
Obgleich die Interpretation des Elektrokardiogramms (EKG) eine Kernkompetenz für sämtliche graduierten Medizinstudenten darstellt [1], zeigen Studien der letzten
3 Jahrzehnte immer wieder, dass die Fähigkeit der zur EKG-Interpretation stets unterhalb den Erwartungen für Medizinabsolventen [2], [3], in der Schulung befindliche Ärzte (Vorklinik) sowie [4], [5], [6], [7], [8], [9] für Ärzte innerhalb der Klinik liegt [10], [11], [12]. EKG-Interpreta- tionsfehler können Patienten durch verspätete Diagnosen, unangemessene Untersuchungen und Behandlungen
sowie Verzögerungen bei der angemessenen Behandlung schädigen [13], [14]. Es besteht ein Verbesserungsbedarf hinsichtlich der EKG-Lernerfahrung in den Ausbildungs- programmen für Studierenden als auch in der Vorklinik [15].
Leider ist die Variabilität und geringe medizinische Leis- tungsfähigkeit Fähigkeiten nicht nur auf die EKG-Interpre- tation beschränkt. Es wurde eine hohe Variabilität der Verfahrenskompetenz zwischen Vorklinik-Ärzten, Klinik- und Fachärzten für die Bereiche Lumbalpunktion, [16]
Adipositas-Chirurgie, bariatrische Chirurgie [17] und das Einführen von intravaskulären Kathetern beschrieben [18]. Solche Ergebnisse haben zu Forderungen nach einer raschen Änderung der medizinischen Ausbildung geführt [19].
Eine bewusste Praxis (Deliberate Practice) wird weithin als Schlüsselkomponente für den Erwerb von Kompetenz und Meisterschaft erwähnt [20], [21]. Bewusste Praxis, ein Prozess, bei dem mehrere Iterationen strukturierter Praxis und Feedback bereitgestellt werden, bis der Trai- nee die erforderliche Kompetenz nachweist [19], [22], [23], [24] wird, im Vergleich zum passiven Lernen, für den Erwerb von Fähigkeiten als überlegene Strategie beschrieben [25], [26], [27]. Bewusste Praxis zur Erlan- gung der Meisterschaft ist in mehreren Bereichen demons- triert worden, darunter Sport, Gaming, der Geschäftswelt und bei musikalischen Leistungen [28], [29]. Medizini- sche Studienergebnisse haben verbesserte Ergebnisse in Fällen gezeigt, in denen die Leistung spezifischer Fä- higkeiten durch Meister-Lernansätze, einschließlich Para- zentese, Zentrallinienplatzierung und fortgeschrittene Fähigkeiten zur Unterstützung des kardialen Lebens, verbessert werden konnte [18], [30], [31].
Die Ergebnisse einer Umfrage der Clerkship Directors of Internal Medicine (CDIM) im Jahr 2005 deuten darauf hin, dass sich der Großteil der Zeit, der auf den EKG-Un- terricht aufgewendet wurde, auf den Bereich didaktische Theorie konzentrierte, mit einem geringen Anteil an for- malisierter strukturierter EKG-Praxis [32]. Tatsächlich wurden begrenzte Möglichkeiten für Praxis und Feedback als Beitrag zu schlechten EKG-Interpretationsfähigkeiten identifiziert [1].
Die Prämisse eines kompetenzbasierten Lernansatzes basiert auf einem leistungsorientierten Ansatz, der eta- blierten Standards entspricht. Eine Gruppe von Schülern zeigt unterschiedliche Lernraten für eine bestimmte Fä- higkeit und benötigt unterschiedliche Mengen an Übung und Feedback, um Kompetenz zu erlangen [32], [33].
Daher sollte eine flexible Bereitstellung von Praxis und Feedback dazu beitragen, die Schulung eines jeden indi- viduellen Studierenden an seine Bedürfnisse auszurich- ten. Darüber hinaus wäre die Kenntnis der optimalen Anzahl von EKG-Fällen, die zum Kompetenzgewinn geübt werden müssen, sowie die Zeit, die benötigt wird, um diese Praxis und das Feedback zu vervollständigen, hilf- reich bei der Planung von Ressourcen für Lern-EKGs;
diese Zahl ist derzeit nicht bekannt [34].
Das erste Ziel dieses Aufsatzes bestand darin, die Menge der bewussten Praxis zu beschreiben, die eine Gruppe
von Medizinstudenten im ersten Jahr ausgesetzt ist, welche die EKG-Rhythmusstreifendiagnose erlernen.
Zweitens wollten wir mathematisch die Lernkurve für die Rhythmusstreifendiagnose in Bezug auf Zeit und Anzahl der geübten Fälle quantifizieren. Das dritte Ziel bestand darin, die Meinungen der Studierenden zu ihren Erfahrun- gen mit der bewussten Praxis (Deliberate Practice) zu beschreiben.
Methoden
Dies stellte eine beobachtende assoziative Kohortenstu- die dar, die eine neuartige Online-Plattform zur Messung und Beschreibung des Praxisverhaltens und der Leistung von Medizinstudenten, die lernen, eine EKG-Rhythmus- streifendiagnose durchzuführen, nutzte. Es wurde ein Beobachtungsansatz gewählt, da ein Ansatz auf Basis von Experimenten aus Gründen der Ungleichbehandlung von Interventions- und Kontrollgruppen nicht möglich wäre, da es keine geeignete vorherige Intervention zum Vergleich gibt [35].
Studie und Teilnehmer
Eine Stichprobe unter Medizinstudenten des ersten Jah- res, die 2016 und 2017 an zwei medizinischen Fakultä- ten in Kanada (McGill University und University of Calgary) eingeschrieben waren, wurde dazu eingeladen, an der Studie teilzunehmen, während diese ihre kardiovaskulä- ren Kurse belegten. McGill bietet 7 Stunden Vorlesung und 2 Stunden Seminar zum Thema EKG-Lernen inner- halb eines 6-wöchigen Kurses an; Calgary bietet 7 Stun- den Vorlesung und 0 Stunden Seminar innerhalb eines 12-wöchigen Kurses, der mit Curriculum, das die Atem- wege betrifft, kombiniert wird. Beide Curricula beinhalten fallbezogenes Lernen und einige dieser Fälle beinhalten EKGs. Die Studierenden wurden zur Teilnahme per E-Mail eingeladen, die vom Studiensekretariat verschickt wurde, sowie durch Ankündigungen im Unterricht. Das University of Calgary Conjoint Health Research Ethics Board geneh- migte die Studie. Für diese Studie wurden keine Mittel eingeworben.
Während des Selbststudiums übten die Studierenden Rhythmusstreifen-Fälle über die frei zugänglichen Online- Module auf teachingmedicine.com. Die 14 verschiedenen EKG-Diagnosen, die für das Lernen ausgewählt wurden, basierten auf den Advanced Cardiac Life Support (ACLS) Rhythmen, die für die Behandlung eines Herzstillstands beherrscht werden müssen (siehe Tabelle 1). Die EKGs wurden als Rhythmusstreifen dargestellt (im Gegensatz zu 12-Kanal-EKGs). Es gab 3 diskrete Übungsmodule, von denen jedes ein anderes Beispiel der 14 Diagnosen (einschließlich Normalrhythmus) enthielt. Dieser Ansatz garantierte, dass in diesem Modul jede der 14 Diagnosen zum Tragen kam. Die Studierenden waren verpflichtet, im Rahmen ihrer Studienarbeit mindestens ein Praxismo- dul zu absolvieren. Die Studierenden konnten jedes Modul so oft üben, wie sie wollten. Die Leistung während der
Tabelle 1: In den Praxisfällen enthaltene Diagnosen
Schulung wurde als Prozentsatz der Rhythmusstreifen quantifiziert, die von jedem Studierenden richtig diagno- stiziert wurden, verglichen mit der richtigen Antwort, die von 3 Experten einstimmig angenommen wurde. Die Zeit für den Abschluss der Übungsmodule wurde von der On- line-Plattform erfasst. Der Timer startete beim Eintritt in das Modul und stoppte beim Verlassen des Moduls. Kam es für einen Zeitraum länger als 5 Minuten zu keiner Benutzeraktivität, wurden 4 Minuten abgezogen und der Timer gestoppt.
Jeder Rhythmusstreifen-Fall erforderte, dass der Studie- rende 8 Fragen zur Charakterisierung des EKG beantwor- tete, gefolgt von 2 Fragen zur Diagnose (siehe Tabelle 2).
Bis auf die Frage nach der ventrikulären Rate waren alle Fragen Multiple-Choice-Fragen, wobei die Diagnosefrage 14 Optionen bot. Motivationstechniken, wie z. B. die Of- fenlegung der sich entwickelnden Leistung der Schüler, Popup-Meldungen, die exzellente Leistung belohnten und förderten, und das Bereitstellen von Vergleichsstatistiken zwischen dem Benutzer und den Durchschnittswerten ihrer Kollegen wurden in die Übungsmodule integriert, um das Engagement der Studierende zu erhöhen [36].
Mehrere Überlegungen beeinflussten die Gestaltung des bereitgestellten Feedbacks [37]. Vier Arten von direktem Feedback standen jedem Studierenden zur Verfügung.
Zunächst wurden die Antworten als korrekt oder falsch identifiziert. In einem zweiten Schritt wurden bei falsch eingereichten Diagnosen eine Tabelle mit der richtigen Diagnose, der falschen Diagnose des Studierenden sowie die diagnostischen Kriterien beider Diagnosen mit hervor- gehobenen Unterschieden zwischen den beiden Kriteri- ensätzen angezeigt. Drittens wurde eine erklärende Dis- kussion zum Fall geführt. Die vierte Form des Feedbacks stellte die Möglichkeit dar, Fragen an den Kursleiter per E-Mail zu stellen, wobei die Antwort per E-Mail innerhalb von 24 Stunden erfolgte.
Alle Antworten der Studierenden wurden dokumentiert und zur Analyse zur Verfügung gestellt. Am Ende ihres kardiovaskulären Kurses absolvierten die Studierenden eine obligatorische Rhythmusstreifen-Prüfung, die bis zu 5% zu ihrer Abschluss-Kursnote beitrug. Prüfungsergeb- nisse von McGill wurden von der Analyse ausgeschlossen, da die Prüfungsfragen aus den Praxismodulen entnom- men wurden und somit keine valide Prüfung von bisher unsichtbaren Fällen darstellten. Die University of Calgary führt eine klassische Papierprüfung durch, welche keine
Rhythmusstreifen aus den Übungsmodulen enthielt. Jeder Rhythmusstreifenuntersuchungsfall bestand aus einer einzigen Diagnose, die von 2 Experten als ähnlich schwierig eingestuft worden war wie die Praxisfälle und die gleichen Diagnosen wie die Rhythmusstreifen in den Übungsmodulen enthielt. Die Leistung bei der Untersu- chung wurde definiert als der Prozentsatz der Rhythmus- streifen, die zu einer korrekten Diagnose führte. Das Nichtbestehen des obligatorischen Übungsmoduls oder der Prüfung führte zum Kursstatus „unvollständig“.
Datenanalyse
Die Daten wurden de-identifiziert und auf einen lokalen Computer exportiert. Die Daten wurden mit R-3.5.1 [38], nlme-3.1-137 [39], Stata 10.0 (Statacorp LLP) und Excel (Microsoft Excel für Mac, Version 15.28) analysiert. Zur Zusammenfassung der Umfragedaten wurden deskriptive Statistiken einschließlich Mittelberechnungen (mit Stan- dardabweichungen [SD]) und Größen verwendet.
Praxisdaten
Diese Daten bestehen aus zwei unabhängigen Populatio- nen, sind nichtlinear und vergleichen mehrere gepaarte Stichproben pro Person; die Individuen verfügen alle nicht über die gleiche Anzahl gepaarter Stichproben. Zwei Streudiagramme wurden erstellt, um die Zusammenhänge zwischen diagnostischer Genauigkeit und Zeit pro Modul beim Üben im Vergleich zur Anzahl der abgeschlossenen Module zu beobachten. Die Gompertz-Funktion wurde verwendet, um die Mittel dieser Daten grafisch darzustel- len [40]. Die Unterschiede zwischen den beiden Schulen wurden mit ANCOVA bewertet. Unterschiede zwischen gepaarten aufeinanderfolgenden Modulen wurden mit gepaarten t-Tests mit Bonferoni-Korrektur auf ihre Bedeu- tung getestet.
Untersuchungsdaten
Diese Daten bestehen aus einer Population, sind nichtli- near, ungepaart; sie stehen unter der Annahme, dass sämtliche Beobachtungen unabhängig voneinander ge- messen werden. Ein Streudiagramm wurde erstellt, um den Zusammenhang zwischen diagnostischer Genauigkeit und der Gesamtzeit beim Üben im Vergleich zur Anzahl
Tabelle 2: Fragen und mögliche Antworten für jeden Rhythmusstreifen.
der abgeschlossenen Module zu beobachten. Basierend auf der visuellen Betrachtung des Streudiagramms erga- ben sich drei mathematische Funktionen: Gompertz- Funktion, Michaelis-Menten (MM)-Funktion und quadra- tische Funktion wurden als mögliche Kandidaten ausge- wählt, um diese 2 Beziehungen darzustellen [40]. Die mit den Modellen verbundenen Koeffizienten wurden auf ihre statistische Signifikanz für die Anpassung an die Daten untersucht. Alpha wurdea prioriauf 0,05 gesetzt. Akaike Informationskriterien (AIC) und die Korrelation zwischen beobachteten und vorhergesagten Messungen werden zur Messung der Güteanpassung der mathematischen Modelle verwendet.
Ergebnisse
Übungsumfang
Insgesamt wurden 384 Schüler zur Teilnahme eingeladen und 314 (82%) willigten ein. Unter den 298 (95%) zuge- lassenen Teilnehmern, welche die Vorbefragung abge-
schlossen haben, lag das Durchschnittsalter bei 24,9 (SD=4,2) Jahren und 54 % der Teilnehmer waren weiblich.
14 (4%) Schüler gaben an, dass sie zuvor Online- Übungsmodule verwendet hatten, um Rhythmusstreifen interpretieren zu können. Die durchschnittliche Häufigkeit, mit der jede der 14 Diagnosen pro Schüler geübt wurde, betrug 4,1 (SD=2,7), was 59 Rhythmusstreifen pro Stu- dierenden entspricht (siehe Abbildung 1). Insgesamt 24 (8%) Studierenden übten nur das obligatorische Einzelm- odul vor der Prüfung. Neun Studierenden haben das Pflichtmodul nicht vor der Prüfung und nach der Prüfung abgeschlossen. Achtundvierzig Schüler absolvierten 10 oder mehr Module; das entspricht ≥140 Rhythmusstreifen für jedes Modul. Die maximale Anzahl der von einem Studierenden absolvierten Module betrug 20, was 280 Rhythmusstreifen entspricht. Die Gesamtzahl der von allen 314 Schülern geübten Rhythmusstreifen betrug 18.466. Damit konnte auf 18.466 Feedbackfälle zurück- gegriffen werden.
Abbildung 1: Die Anzahl der von jedem Studierenden absolvierten Module. Ein Modul enthält 14 Rhythmusstreifen-Untersuchungsfälle.
Übungsleistung
Abbildung 2 (links und rechts) zeigt die Streudiagramme, die sich auf die Anzahl der abgeschlossenen Übungsmo- dule mit diagnostischer Genauigkeit und die pro Modul Übungszeit in zwei verschiedenen Einrichtungen während der Absolvierung der Übung beziehen. Es gab keine sta- tistischen Unterschiede hinsichtlich der diagnostischen Genauigkeit zwischen beiden Einrichtungen während der Absolvierung der Übung. Es gab keine statistischen Un- terschiede in der Übungszeit pro Modul zwischen den beiden Einrichtungen, außer für einen Zeitpunkt (bei Modul 3). Unterschiede in der diagnostischen Genauigkeit zwischen aufeinanderfolgenden Modulen zeigten statis- tisch signifikante Steigerungen zwischen den Modulen:
1 und 2; 2 und 3; nicht 3 und 4, sondern erneut 4 und 5, was darauf hindeutet, dass die Diagnosegenauigkeit durch die Module 1-3 und möglicherweise auch bis zum Modul 5 (vollständige statistische Werte gemäß Anhang 1) weiter gestiegen ist. Die Unterschiede in der Praxiszeit pro Modul haben sich zwischen aufeinanderfolgenden Modulen deutlich verringert: 1 und 2; bis hin zu den Mo- dulen 7 und 8 einschließlich, was darauf hindeutet, dass die Geschwindigkeit in allen diesen Modulen weiter zuge- nommen haben.
Prüfungsleistung
Die mathematische Funktion, welche die Lernkurve der diagnostischen Genauigkeit am besten approximierte, entspricht der Gompertz-Gleichung mit den folgenden Koeffizienten: Y~88*exp(0,51*exp(0,47*M)). Die Funk- tion, welche die gesamte Trainingszeitkurve am besten beschreibt, entspricht der Michaelis-Menten-Funktion mit den Koeffizienten: Y~671*M/(12,1+M). M stellt die An- zahl der abgeschlossenen Module dar. Die AIC Goodness of Fit Bewertung für diese beiden mathematischen Funktionen ergab p-Werte<0.001 für alle Koeffizienten in den Modulen. Diese Kurven werden verwendet, um den Arbeitsaufwand der Studierenden zu schätzen, der erforderlich ist, um ein vordefiniertes Leistungsniveau
für die Prüfung zu erreichen. Ein zweistufiges Modell zum Auffinden der Übungszeit aus der erwarteten Genauigkeit ist in Abbildung 3 dargestellt. Die Schätzung des Gom- pertz-Modells wird verwendet, um die entsprechende Anzahl von Modulen zu finden, die dann als Input für die Schätzung der Michaelis-Menten-Funktion verwendet wird, um die für die Praxis benötigte Zeit vorherzusagen.
Tabelle 3 zeigt die gesamte Übungszeit und die erforder- liche Anzahl der Module, die geübt wurden, um in der Prüfung eine Punktzahl von 70 bis 85% zu erreichen.
In der Vorbefragung berichteten die Studierenden dar- über, wie viel Zeit sie vor der Forschungsstudie damit verbracht hatten, die Interpretation von Rhythmusstreifen zu üben; werden die Studierenden nach ihrer Vorstudien- praxis sortiert, ließen sich keine statistischen Unterschie- de in der Prüfungsleistung feststellen.
Zufriedenheit der Studierenden
Basierend auf der am Ende der kardiovaskulären Kurse durchgeführten Umfrage gaben 174 (von 314 Zustimmen- den) Studierende an, dass die Lernmodule effektiv (97%), effizient (97%) und angenehm (92%) sind (siehe Anhang 2). Die meisten Studierenden waren der Auffassung, dass ein Praxisbezug erforderlich ist, um das Interpretieren von EKGs zu erlernen (99%), dass sofortiges Feedback hilfreich war (95%) und dass sie daran interessiert waren, die gleiche Methode zum Erlernen anderer diagnostischer Fähigkeiten, wie Röntgen- und Ultraschallinterpretation, zu verwenden (99%).
Arbeitsbelastung der Dozenten
In Bezug auf den Arbeitsaufwand des Dozenten für die Beantwortung von Feedback-E-Mails der Schüler wurden insgesamt 14 E-Mail-Fragen von Studierenden von McGill und 37 von Calgary eingereicht. Vergleicht man E-Mails mit den insgesamt geübten Fällen, so wurden 51 Feed- back-E-Mails für 18.466 Praxisfälle eingereicht, was etwa einer E-Mail pro 360 geübten Fällen entspricht.
Abbildung 2: Links zeigt die diagnostische Genauigkeit während der Übungsphase zweier verschiedener medizinischen Einrichtungen bei der Interpretation des Rhythmusstreifens. Rechts zeigt die Übungszeit pro Modul. Es gibt keine signifikanten
Unterschiede zwischen den beiden Schulen außer einem Zeitunterschied beim Modul #3, der wahrscheinlich nicht „klinisch“
signifikant ist.
Tabelle 3: Anzahl der abgeschlossenen Module und Gesamtübungszeit, die benötigt wird, um die vordefinierten Ziel-Diagnosegenauigkeiten zu erreichen.
Diskussion
Unsere Daten zeigen, dass Medizinstudenten im ersten Jahr vor einer Rhythmusstreifenuntersuchung einen Mit- telwert von 59 Rhythmusstreifen interpretiert haben.
Insgesamt wurden 314 Studierenden an zwei verschiede- nen medizinischen Fakultäten über 18.000 Feedback- Fälle zur Verfügung gestellt. Dies ist aus mehreren Gründen wichtig. Erstens wurden von Herausforderungen bei der Bereitstellung von Feedback für die bewusste Praxis (Deliberate Practice) berichtet [37]. Wir haben detailliert beschrieben, wie man zwei großen Kohorten von Medizinstudenten erfolgreich Feedback im Rahmen der bewussten Praxis geben könnte, um auf diese Weise einem in der medizinischen Lehrliteratur identifizierten Bedarf gerecht zu werden.
Zweitens zeigten unsere bisher unveröffentlichten lokalen Daten, dass, wenn das Üben nicht vorgeschrieben war und es keine Rhythmusstreifen-Prüfung gab, die Studie- renden trotz starker Förderung und Ermutigung durch die Dozenten lediglich einen Mittelwert von nur 6 Übungs-
rhythmusstreifen erreichten [41]. Der Vergleich dieser Ergebnisse mit den Ergebnissen unserer aktuellen Studie, die Einführung eines obligatorischen Übungsmoduls und einer speziellen Rhythmusstreifen-Summenprüfung führte zu einer 9-fachen Steigerung des Praxisverhaltens der Studierenden. Die Studierenden waren bereit, fähig und motiviert, weit über das von den Kursleitern vorge- schriebene Arbeitspensum hinaus zu üben und absolvier- ten durchschnittlich 59 Übungsrhythmusstreifen, auch, wenn nur 14 benötigt wurden.
Die spezielle Rhythmusstreifen-Summenprüfung war wahrscheinlich ein starker Motivator für das Verhalten der Studierenden in der Praxis. Andere Studien haben die positiven Auswirkungen von summativen Bewertungen speziell auf die Leistung der Studierenden auf die EKG- Interpretation beschrieben [42], [43]. Bei Vorklinik- Schulungsprogrammen wurden regelmäßige objektive Beurteilungen der EKG-Interpretationsfähigkeiten emp- fohlen [34]. Zusätzlich zu den prägenden Rückmeldungen haben Raupach et al. festgestellt, dass summatives Feedback die mittelfristige Aufrechterhaltung der EKG-