Hertie School of Governance - working papers, No. 23, April 2008
Beyond Matrices and Black-box Algorithms:
Settings Marketing Priorities with Marketing Strategy Conferences
Martin S. Schilling (London School of Economics)
Paul J. Schulze-Cleven (Decision Institute, Berlin)
Hertie School of Governance – working papers, No. 23, April 2008
Beyond Matrices and Black-box Algorithms:
Setting Marketing Priorities with Marketing Strategy Conferences
Martin S. Schilling (London School of Economics)
Paul J. Schulze-Cleven (Decision Institute, Berlin)
About the HSoG Working Paper Series
The Working Paper Series of the Hertie School of Governance is intended to provide visibility, internally as well as externally, to the current academic work of core faculty, other teaching staff, and invited visitors to the School. High-quality student papers will also be published in the Series, together with a foreword by the respective instructor or supervisor.
Authors are exclusively responsible for the content of their papers and the views
expressed therein. They retain the copyright for their work. Discussion and comments are
invited. Working Papers will be made electronically available through the Hertie School
of Governance homepage. Contents will be deleted from the homepage when papers are
eventually published; once this happens, only name(s) of author(s), title, and place of
publication will remain on the list. If the material is being published in a language other
than German or English, both the original text and the reference to the publication will be
kept on the list.
Beyond Matrices and Black-box Algorithms:
Setting Marketing Priorities with Marketing Strategy Conferences Schilling, Martin S.
London School of Economics
Management Department, London School of Economics, Houghton Street, London, WC2A 2AE, UK
Decision Institute, Berlin (m.schilling@lse.ac.uk) Schulze-Cleven, Paul J.
Decision Institute, Berlin
Charlottenstrasse 159, 10117 Berlin, Germany (p.schulzecleven@decisioninstitute.eu)
Summary
With this paper, we introduce the Marketing Strategy Conference approach to set strategic marketing priorities effectively and allocate marketing-related resources accordingly. The system is based on managerial preference modelling with a decision model (analytical side) and communication-enhancing strategy conferencing (interactive side). After a review of alternative resource allocation frameworks, as rule-of-thumb approaches, matrix-based analyses, statistical analyses and management science models, we analyse existing analytical, behavioural and organisational impediments to effective marketing resource allocation. Addressing some of these impediments, this paper outlines two Marketing Strategy Conference cases, which we carried out for the pharmaceutical company, Schering Argentina.
Keywords: resource allocation, prioritisation, decision conference, multiple-attribute utility theory, marketing mix
Introduction
“Formal systems, mechanical or otherwise, have offered no improved means of dealing with the information overload of human brains … All the promises about artificial intelligence, expert systems, and the like improving if not replacing human intuition never materialized at the strategy level. Formal systems could certainly process more information, at least hard information. But they could never internalize it, comprehend it, synthesize it.” – Mintzberg, 1994 (p.111)
The idea of supporting strategic marketing decisions with computer-based models goes back at least to the mid-1960s (Kuehn, 1965; Little and Lodish, 1969a; Montgomery and Urban, 1969). The core idea is to combine the adaptable, but sometimes biased judgements of marketeers with the consistent, but sometimes rigid data processing capabilities of formal models (Li, 2005).
Models include, amongst others, Artificial Neural Networks (Poh, 1994; Chien, 1999;
Golpayegani and Emamizadeh, 2007), fuzzy logic (Levy and Yoon, 1995; Kuo and Xue, 1998;
Lin and Hsieh, 2004), expert information systems (McDonald and Wilson, 1990; Alpar, 1991;
Metaxiotis and Psarras, 2003) and case-based approaches (Chiu, 2002). Li et al (2000) provides a review of these approaches.
As reflected in Mintzberg’s quote above, the results for effective applications of model- based support in marketing decision making are mixed. The application of formal systems is usually limited to a narrow domain. Ill-defined decision problems with multiple objectives in the face of uncertainty, common in practice, are difficult to capture in a simple computer model.
Consequently, a survey with marketing managers of manufacturing companies in the UK indicated widespread dissatisfaction with computer-based systems used in developing marketing strategies (Li, Kinman et al., 2000). In particular, most systems fail to aid strategic thinking and couple strategic analysis with managerial judgments.
To address this dissatisfaction, this paper aims to introduce a system - Marketing Strategy Conferencing (MSC) - consisting of an analytical and an interactive component to aid marketing managers in setting strategic marketing priorities effectively and allocating resources accordingly.
Analytically, MSC builds on recent advances in the area of decision analysis in order to provide marketeers with insights into efficient trade-offs between strategic marketing initiatives. The systems deals in particular with investments in different marketing programmes (direct customer service activities, loyalty programmes, direct advertising, etc.) or trade-offs between marketing activities for different product groups. Besides this analytical component, the system contains an interactive component by providing organisations with a discussion framework to create a strategic consensus, i.e. shared understanding on marketing priorities (Rapert, Velliquette et al., 2002). The system is designed to combine the operational bottom-up knowledge of marketing managers with the strategic vision of top-level management. The aim of the interactive component of the system is thereby to offer a learning device in strategic marketing planning. It serves to enable organisations to lead quality discussions, both at top-level and within departments, about marketing priorities. Marketing Strategy Conferencing therefore aims to contribute to a strategy development of both the ‘rational’ planning perspective and the ‘adaptive’
learning tradition (Mintzberg, Ahlstrand et al., 1998; Sull, 2007).
The rest of the paper is structured as follows: in the next section, we outline some existing methodologies to analyse strategic marketing prioritisations and to allocate resources accordingly.
We then highlight analytical, behavioural and organisational impediments which hinder effective priority setting in marketing. Addressing some of these impediments we, third, introduce the Marketing Strategy Conferencing approach, applied to two cases in the pharmaceutical company, Schering Argentina.
Resources Allocation Methodologies For Marketing-related Decisions
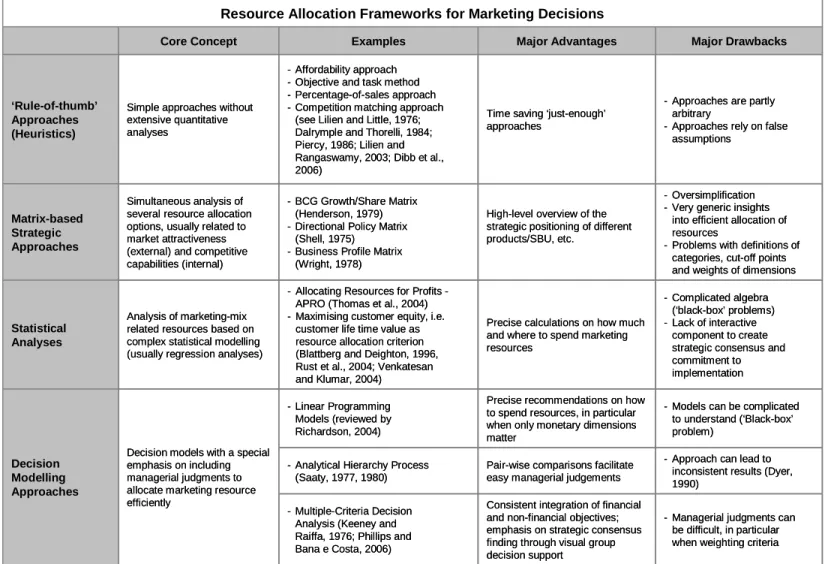
Frameworks to set marketing priorities and to allocate resources are numerous. As displayed in Table 1, these methods can be divided into at least four categories:
- ’rule-of-thumb‘ approaches (resource allocation heuristics), such as the percentage-of-sales
method (Piercy, 1986; Lilien and Rangaswamy, 2003; Dibb, Simkin et al., 2006; Kotler and Keller, 2006),
- matrix-based strategic approaches, including the BCG growth/share matrix or the directional policy matrix (Henderson, 1979; Wind and Mahajan, 1981; Morrison and Wensley, 1991; Baker, 2000)
- statistical analyses, mostly based on complex regression models (Blattberg and Deighton, 1996; Thomas, Reinartz et al., 2004; Reinartz, Thomas et al., 2005)
- decision modelling approaches, including linear programming models, the Analytical Hierarchy Process or Multiple-Criteria Decision Analysis (Kuehn, 1965; Little, 1976;
Davies, 1994; Richardson, 2004; Phillips and Bana e Costa, 2007)
‘Rule-of-thumb’ Approaches (Resource Allocation Heuristics)
In particular, when setting advertising budgets, various simple ‘rule-of-thumb’ methods exist. Methods range from allocating budgets according to what managers consider their company can afford (Piercy, 1986; Piercy, 2002), to setting marketing objectives and allocating budgets accordingly to achieve these targets (Piercy, 1986; Dibb, Simkin et al., 2006). Other common approaches include spending a fixed percentage of (current or forecasted) sales volume or to match the marketing expenditures of competitors or an industry (Piercy, 2002). Although ‘rule- of-thumb’ approaches can be applied in a time-saving manner, they are based on arbitrary assumptions, such as that sales volume creates advertising, rather than vice versa, or they ignore
the fact that competitors might have completely different marketing objectives (Dalrymple and Thorelli, 1984; Piercy, 1986; Dibb, Simkin et al., 2006).
Matrix-based Strategic Approaches
To provide a more structured framework for strategic marketing decisions, The Boston Consulting Group (BCG) introduced the growth-share matrix in the 1970s (Henderson, 1979). As market growth is only a rough proxy for market attractiveness, and as market share only partially captures competitiveness, multi-dimensional approaches have won wider acceptance in the last few decades. Shell’s Directional Policy Matrix, or the business profile matrix, for example, both offer a multiple factor framework to analyse portfolios (for a review of matrix-based approaches see Wind and Mahajan, 1981). Matrix-based portfolio analyses usually aim to classify and compare a firm’s products or services in order to analyse optimal investment strategies for each product or service. In most cases, one axis represents ‘internal’ factors such as the competitiveness of the firm’s products, and the other, ‘external’ factors, such as market opportunities (Day, 1977; Wensley, 1981; Brown, 1991; Morrison and Wensley, 1991; Dibb, Simkin et al., 2006).
Despite their wide applicability in practice, matrix-based portfolio analyses have been criticised for being too generic to provide a sound basis for marketing strategy development (Wensley, 1981). With the BCG matrix, for example, decision makers do not obtain guidance on which ‘problem child’ to invest in or how many ‘cash cows’ to maintain. In addition to this issue of over-simplification, the definition of categories, cut-off points and markets influence the results of matrix-based portfolio analyses significantly. Matrix-based portfolio approaches can therefore be misleading when allocating budgets or developing strategies (Day, 1977). Another criticism of matrix-based approaches focuses on the underlying ‘classical’ product life-cycle, which has been criticised for not being universally applicable (Dhalla, 1976).
Statistical Analyses
Statistical analyses are a more recent development and aim to provide guidance for an efficient allocation of marketing-mix related resources. These approaches are usually based on complex regression models to determine how much and where to spend marketing resources.
Thomas et al. (2004), for example, introduced the Allocating Resources for Profits (APRO) approach, which aims to determine optimal investments by balancing spending between retaining old and attracting new customers. As one of the earlier statistical approaches, Blattberg and Deighton (1996) chose customer equity as a resource allocation criterion for maximising the firm’s long-term profitability. Using more advanced statistical models, Venkatesan and Kumar (2004), as well as Rust et al. (2004), analyse strategic marketing initiatives based on their discounted customer life-time value. In comparison to the other approaches, statistical analyses offer precise calculations on how much to spend in different marketing expenditures. On the other hand, the complex calculations and the lack of interactive models to discuss strategic issues are the potential drawbacks of these approaches.
Decision Modelling Approaches
Researchers have been developing decision models since the 1960s to aid marketing strategy development as well as the allocation of marketing resources (see for example, Kuehn, 1965; Montgomery and Urban, 1969; Little and Lodish, 1969b; Lodish, 1971; Vargas and Saaty, 1981; Nguyen, 1985; Mazanec, 1986; Eliashberg, Swami et al., 2002; Richardson, 2004). Linear programming models, the Analytical Hierarchy Process and multiple criteria decision models have so far been the most prevalent management science approaches to marketing-related decisions.
Linear programming models use an optimisation function (such as maximising sales volume) and constraints (such as a budget) to calculate optimal resource allocations (Hillier and
Lieberman, 2005). Due to the complexity and lack of adaptiveness of early linear programming models, Little (1976) introduced more simple marketing science models. Following his ‘Decision Calculus’ school, researchers developed software based tools to help marketing managers allocate resources and develop marketing strategies. MEDIAC, for example, deals with selecting media options to create a media schedule (Little and Lodish, 1969a). CALLPLAN guides sales staff by optimally allocating their time with customers (Lodish, 1971). SPRINTER facilitates marketing activities for the launch of new products (Urban, 1970). Lodish, Curtis et al. (1988), used a custom model to analyse the optimal sales force size and how an organisation should deploy it.
For a brief review of these approaches, see Richardson (2004). Linear programming models have been applied successfully in practice, nonetheless, it remains challenging to build models which are sufficiently complex to capture the whole picture of a decision situation and, at the same time, remain sufficiently simple to be usable (Lodish, 2001).
Whereas linear programming approaches usually optimise a single criterion, such as profit or sales volume, the Analytical Hierarchy Process (Saaty, 1977, 1980) is able to deal with marketing-related trade-off problems. The Analytical Hierarchy Process (AHP) serves to structure portfolio decisions in hierarchical representations including different options and different objectives for the evaluation of the options (Davies, 1994). The AHP was used to provide support in ‘lease versus buy’ decisions in industrial purchasing (Vargas and Saaty, 1981), new product screening (Calantone, Di Benedetto et al., 1999), marketing mix strategy, new product development (Wind and Saaty, 1980), and advertising budget optimisation (Mazanec, 1986). Although the process simplifies cognitive demands on the decision makers by using pairwise comparisons of options (Davies, 2001), researchers have challenged the theoretical soundness of the Analytical Hierarchy Process. According to Dyer (1990), for example, the AHP can lead to arbitrary, rather than systematic rankings of decision alternatives.
Finally, models based on multiple attribute utility theory (Keeney and Raiffa, 1976) can capture trade-offs between conflicting objectives in a theoretically consistent way. These conflicting objectives might include growth of market share, short-term profitability, image effects or the reduction of risk. Using this approach, Phillips and Bana e Costa (2007) combine simple preference modelling with communication-enhancing decision conferencing (Phillips, 2006) for an efficient allocation of resources and strategic group alignment. They are therefore in particular suitable for the Marketing Strategy Conferencing approach, as introduced below. Major drawbacks of multiple criteria models include difficult judgments on the part of the decision makers, in particular when weighting dimensions.
Table 1 provides an overview of the four approaches to allocate resources in marketing- related decisions, as discussed above.
- Models can be complicated to understand (‘Black-box’
problem) Precise recommendations on how
to spend resources, in particular when only monetary dimensions matter
- Linear Programming Models (reviewed by Richardson, 2004)
- Approach can lead to inconsistent results (Dyer, 1990)
Pair-wise comparisons facilitate easy managerial judgements - Analytical Hierarchy Process
(Saaty, 1977, 1980)
- Oversimplification - Very generic insights
into efficient allocation of resources
- Problems with definitions of categories, cut-off points and weights of dimensions High-level overview of the
strategic positioning of different products/SBU, etc.
- BCG Growth/Share Matrix (Henderson, 1979) - Directional Policy Matrix
(Shell, 1975) - Business Profile Matrix
(Wright, 1978) Simultaneous analysis of
several resource allocation options, usually related to market attractiveness (external) and competitive capabilities (internal) Matrix-based
Strategic Approaches
- Managerial judgments can be difficult, in particular when weighting criteria - Complicated algebra
(‘black-box’ problems) - Lack of interactive
component to create strategic consensus and commitment to implementation - Approaches are partly
arbitrary
- Approaches rely on false assumptions
Major Drawbacks Resource Allocation Frameworks for Marketing Decisions
Consistent integration of financial and non-financial objectives;
emphasis on strategic consensus finding through visual group decision support
Precise calculations on how much and where to spend marketing resources
Time saving ‘just-enough’
approaches
Major Advantages - Affordability approach
- Objective and task method - Percentage-of-sales approach - Competition matching approach
(see Lilien and Little, 1976;
Dalrymple and Thorelli, 1984;
Piercy, 1986; Lilien and Rangaswamy, 2003; Dibb et al., 2006)
Simple approaches without extensive quantitative analyses
‘Rule-of-thumb’
Approaches (Heuristics)
- Multiple-Criteria Decision Analysis (Keeney and Raiffa, 1976; Phillips and Bana e Costa, 2006) Decision models with a special
emphasis on including managerial judgments to allocate marketing resource efficiently
Decision Modelling Approaches
- Allocating Resources for Profits - APRO (Thomas et al., 2004) - Maximising customer equity, i.e.
customer life time value as resource allocation criterion (Blattberg and Deighton, 1996, Rust et al., 2004; Venkatesan and Klumar, 2004)
Analysis of marketing-mix related resources based on complex statistical modelling (usually regression analyses) Statistical
Analyses
Examples Core Concept
Table 1 – Various Resource Allocation Frameworks for Marketing Decisions
Despite the availability of an array of different methodologies to set marketing priorities and allocate resources accordingly, several impediments hindering effective marketing resource allocation remain.
Impediments Hindering Effective Marketing Resource Allocation
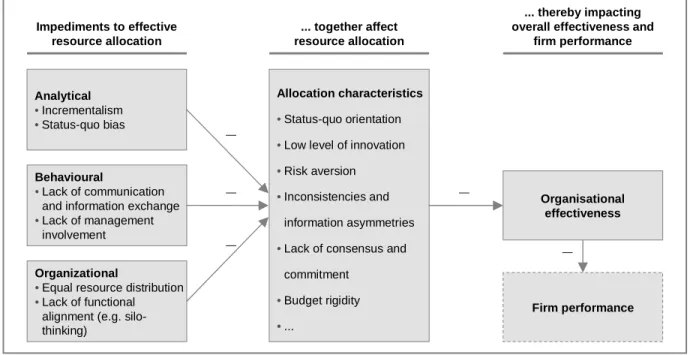
In the following section, we use the analytical, behavioural and organisational marketing planning dimensions of Piercy and Morgan (1990) to classify current impediments to the effective setting of strategic marketing priorities. Figure 1 displays some of these existing impediments.
Analytical
•Incrementalism
•Status-quo bias
Behavioural
•Lack of communication and information exchange
•Lack of management involvement
Organizational
•Equal resource distribution
•Lack of functional alignment (e.g. silo- thinking)
Impediments to effective resource allocation
Organisational effectiveness
Firm performance
_ _
_
Allocation characteristics
•Status-quo orientation
•Low level of innovation
•Risk aversion
•Inconsistencies and information asymmetries
•Lack of consensus and commitment
•Budget rigidity
•...
... together affect resource allocation
... thereby impacting overall effectiveness and
firm performance
_
_
Figure 1 – Impediments for Effective Allocation of Marketing Resources
Analytical Impediments
Analytical impediments refer to the lack of analytical capabilities when allocating marketing resources. When changing budgets or during annual planning procedures, the most common pitfall is
‘incrementalism’ - changing budgets only marginally in a mechanical process in relation to the status quo (Piercy, 1986; Piercy and Morgan, 1990). In these cases, ‘historical precedent’ is the basis for marketing budgeting rather than strategic marketing opportunities (Dalrymple and Thorelli, 1984).
The resulting lack of innovation and strategic enhancement, potentially hampering organizational performance, is partly driven by the quest to outfox individual incentive schemes (Hope and Fraser, 2003), as well as the general bias in decision-making towards the status quo (Hartman, Doane et al., 1991; Masatlioglu and Ok, 2004; Burmeister and Schade, 2007). Typical results are investments in ‘established’, less risky marketing activities at the expense of new ones (Bonoma and Crittenden, 1988) .
Behavioural Impediments
Besides these analytical shortcomings, in particular the lack of vertical communication, lack of strategic consensus and lack of commitment to implementation can be several motivational reasons for ineffective strategic resource allocation in the marketing domain. Behavioural impediments include, among others, planning recalcitrance, short-term and inward looking orientation (Piercy and Morgan, 1994).
Lack of vertical communication across hierarchies in strategy development processes can lead to inferior strategies (Wooldridge and Floyd, 1990), which in turn can result in lower organisational performance (Floyd and Wooldridge, 1997; Noble and Mokwa, 1999). More involvement in marketing strategy development, on the other hand, can lead to an enhanced search for more alternatives and more diverse information (Collier et al., 2004). This accounts in particular for the involvement of middle management (Wooldridge and Floyd, 1990; Floyd and Wooldridge, 1992; Dutton, Ashford et al., 1997;
Floyd and Wooldridge, 1997) and the enabling of dissent rather than consent (Dooley and Fryxell, 1999). Involvement can also lead to the better alignment of groups through shared strategic understanding and a greater commitment to a joint way forward (Phillips and Bana e Costa, 2007).
Insufficient involvement (Wooldridge and Floyd, 1990) or internal communication efforts (Dibb, 1997) can thereby lead to a lack of strategic consensus on marketing priorities. In this context, the area of marketing is in particular suitable for the creation of strategic consensus, due to its
the separation between formulating marketing strategies, for example, through structured annual planning and implementation, can be driver for a lack of commitment to the implementation of marketing strategies (Bonoma, 1984; Bonoma and Crittenden, 1988; Piercy, 1990; Piercy and Morgan, 1990; Cespedes and Piercy, 1996; Harris, 1996b; Harris, 1996a; Noble and Mokwa, 1999; Lane and Clewes, 2000; Thomas, 2002).
Organisational Impediments
Finally, organisational impediments – the lack of organisational structures for effective allocation of resources – can hinder the effective setting of marketing priorities.
Viewed from a top-down perspective, organisations tend to distribute resources equally among their departments or organisational units, rather than applying transparent criteria to allocate resources efficiently (Fox, Bardolet et al., 2005). Similar to the ‘common’s dilemma’ (Hardin, 1968), the overall result for the organisation can be inefficient, even if every unit is using their resources efficiently.
Quick-growing business units, for example, can be short on resources whilst ‘cash cows’ use too much money.
Viewed from a bottom-up perspective, another consequence of the organisational department structure can be ‘silo-thinking’ when developing and executing marketing strategies (McDonald, 1992;
Dibb and Simkin, 2000; Dibb, 2002). Business units, for example, sometimes tend to develop their marketing strategies focusing solely on their own product line, rather than the company as a whole.
Marketing departments, on the other hand, fail to communicate ‘laterally’ with other departments (Simkin, 1996, Dibb and Simkin, 2000).This can partly be attributed to the missing formalisation of cross-functional integration which can diminish consensus commitment (Menon et al., 1999) as well as decrease organisational performance (Krohmer, Homburg et al., 2002).
The Marketing Strategy Conferencing Approach (MSC), as outlined in the next section, addresses some of these impediments. In the following section, we introduce MSC, applied to two cases for the pharmaceutical company, Schering Argentina and discuss some of its shortcomings.
Marketing Strategy Conferencing
Marketing Strategy Conferencing is an analytic-interactive approach to identify strategic marketing priorities. The objectives when applying the method are twofold: first, to provide an insight into an efficient allocation of marketing-mix related resources through a consistent comparison of different marketing initiatives (analytical side). Second, MSC provides an effective discussion framework to arrive at a strategic consensus on marketing priorities (interactive side).
Multi-criteria Decision Modelling – The Analytical Side
The analytical side of the approach builds on a multi-criteria decision model. The building blocks of the model are individual marketing activities, such as different loyalty programmes, customer service programmes or advertising campaigns. Marketeers analyse each activity based on several benefit and risk dimensions as well as on monetary costs. The approach incorporates financial and non- financial benefits, such as the estimated impact of the activity on sales volume, its impact on market share, the extent to which the activity enhances corporate image or customer satisfaction.
A multi-attribute utility model then serves to collapse these multiple dimensions into a single risk-adjusted benefit value (Keeney and Raiffa, 1976). If the benefit criteria are constructed preference- independently – i.e. if the decision makers can judge the benefit of an activity on one criterion independently of the impact on another criterion – an additive aggregation of the benefit values is feasible. Following the assessments of all activities on all criteria and the weighting of the criteria to each other, the aggregated benefit value for each marketing activity can be calculated with the standard additive value model
V
i =∑ wjv
ij .
vij thereby represents the value associated with the consequence of option i on criterion j, and wj represents the weight assigned to criterion j. The total value score for one option can be calculated as the sum of the weighted scores on each of the individual criteria. For a more detailed explanation of the technical details, see Phillips and Bana e Costa (2007).
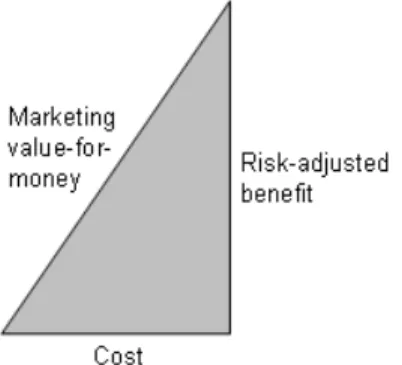
Cost, benefit and risk criteria then serve to determine a ‘marketing value-for-money triangle’
for each activity, as outlined in Figure 2. The slope of the triangle indicates the resource efficiency of each activity: the steeper the slope, the better the benefit-cost ratio of a single activity.
Figure 2 – The Marketing Value-for-money Triangle
The marketing value-for-money of each activity now serves to prioritise strategic marketing activities.
Those which lead to a high risk-adjusted benefit with comparatively low costs (steep triangle) should have investment priority over those with lower marketing value-for-money.
Strategy Conferencing – The Interactive Side
Although priorities might be analytically easy to set, a generation of commitment to related action might prove difficult. Addressing this problem, the decision modelling can facilitate effective vertical and horizontal communication across hierarchies and departments, in order to create strategic consensus on marketing priorities. An impartial facilitator guides a group of key decision makers through the evaluation process.
Schuman and Rohrbaugh (1991) define decision conferences as ‘designed for groups that need to reach a consensus about a complex, unstructured problem for which there is no ‘formula’ or objective solution...’ (p. 148/149). The objectives of a decision conference are thereby to create a shared understanding of the issues at stake, to develop a sense of common purpose and to gain commitment to a joint way forward (Phillips, 2007). Usually, the on-the-spot modelling is done within the framework of an intensive two-day meeting (McCartt and Rohrbaugh, 1995) or over a longer time period, a process called ’decision conferencing‘ (Phillips and Bana e Costa, 2007).
As the primary purpose of a decision conference is often not to make decisions, but to explore strategic priorities and to contribute to strategic consensus, we will call these meetings ‘Strategy Conferences’. In the two applications of MSC, outlined below, we carried out the approach within a time frame of several weeks. After a joint kick-off meeting with top-level management, smaller teams started with the collection of expert knowledge and data at the bottom of the hierarchy. This information – incorporated into the decision model – was then checked with the department heads and finally discussed at the next level, the Executive Board. As key stakeholders were engaged in developing the model, the system served to combine the strategic vision of Schering Argentina´s top- level management effectively with the operational knowledge of its middle managers.
Background to the Schering Cases
The pharmaceutical company Schering has a longstanding history in Argentina. The first subsidiary dates back to 1926. Focusing mainly on hormonal contraceptives, diagnostic imaging and special therapeutics for multiples sclerosis and oncology, Schering Argentina produces and markets pharmaceuticals. While the market prospects originally appeared promising in Argentina, the last few decades have seen producers and suppliers of generic products starting to challenge Schering in its
business segments. The economic crises of 2001/2002 in Argentina further increased the pressure on the company’s departments to control costs and maximise the effectiveness of activities.
In 2005, a new CEO took office. Initiating strategic re-thinking within the company, he strived to restore the alignment of the local marketing and corporate strategies. In addition, this re-alignment aimed to prevent silo-thinking, as the local business units had developed a great sense of autonomy over the years, resulting in a lack of cross-unit collaboration.
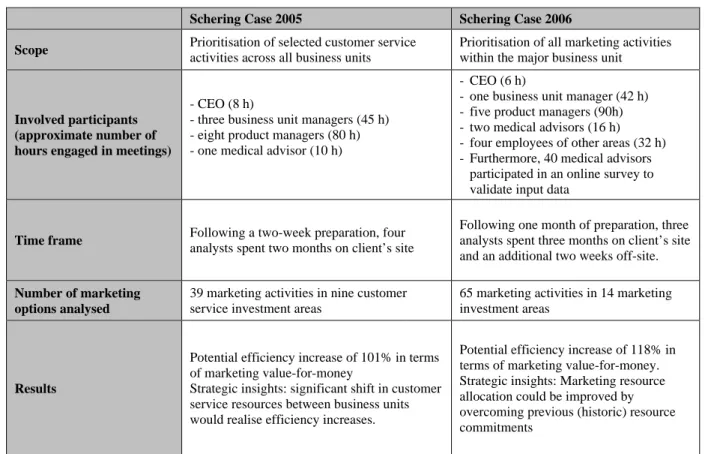
During the research project MARA 2005 (Schilling and Schaub, 2007), we applied MSC for an analysis of Schering’s customer service activities across all departments. A follow-up study in 2006, carried out by the Fundación MARA, analysed a more diversified marketing portfolio, considering a larger budget. Table 2 provides an overview of these two applications of MSC at Schering Argentina.
Schering Case 2005 Schering Case 2006
Scope Prioritisation of selected customer service activities across all business units
Prioritisation of all marketing activities within the major business unit
Involved participants (approximate number of hours engaged in meetings)
- CEO (8 h)
- three business unit managers (45 h) - eight product managers (80 h) - one medical advisor (10 h)
- CEO (6 h)
- one business unit manager (42 h) - five product managers (90h) - two medical advisors (16 h) - four employees of other areas (32 h) - Furthermore, 40 medical advisors participated in an online survey to validate input data
Time frame Following a two-week preparation, four analysts spent two months on client’s site
Following one month of preparation, three analysts spent three months on client’s site and an additional two weeks off-site.
Number of marketing options analysed
39 marketing activities in nine customer service investment areas
65 marketing activities in 14 marketing investment areas
Results
Potential efficiency increase of 101% in terms of marketing value-for-money
Strategic insights: significant shift in customer service resources between business units would realise efficiency increases.
Potential efficiency increase of 118% in terms of marketing value-for-money.
Strategic insights: Marketing resource allocation could be improved by overcoming previous (historic) resource commitments
Table 2 – Overview of Marketing Strategy Conferencing at Schering Argentina 2005
and 2006
The Modelling Process
For both cases, we constructed marketing activity portfolios, which consisted of a variety of investment areas with several investment options. In 2005, the areas only included customer service activities. Currently performed service activities, as well as new activities, which we generated interactively with the Schering employees, served as investment options. In order to generate new activities, we asked the managers to imagine options without thinking of budget constraints, i.e.
unaffected by associated costs, previous failures, technical or commercial feasibility. Figure 3 displays the portfolio of the Schering 2005 case. The black boxes at the bottom are the labels for the different investment areas, in this case, connected to several product lines. The shaded boxes above refer to the currently performed marketing activities, the blank boxes to the possible new marketing activities.
Modifications in the nurse service net for one business area or different advertising campaigns, are examples of these options.
Figure 3 – Marketing Activities Attributed to Investment Areas of the Schering 2005 (* refers to sanitised investment areas)
As the analysis proved useful, Schering Argentina decided to repeat the approach in 2006 within one business unit. This time, we focused on the company’s largest business unit and increased the scope of the analysis by including all activities that the business unit directed externally and potential activities that the company could carry out. As a result, the budget in question increased to almost three times the amount we considered in 2005.
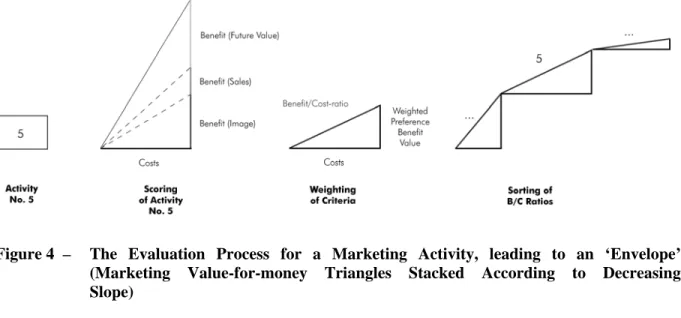
Having created the marketing activity portfolios, decision makers scored in both cases each option on each criterion. In 2005, for example, impact on sales volume, on the company image, and on
‘future value’ (long-term impact) served, besides monetary costs, as measurement criteria. Following the scoring, the weighting procedure allowed the company to calculate the marketing value-for-money
for each activity. Figure 4 shows the creation of the marketing value-for-money triangle. Having carried out all assessments and assigned weights, the model calculated a marketing benefit value for each activity and then prioritised all activities according to their benefit-to-cost ratio.
Figure 4 – The Evaluation Process for a Marketing Activity, leading to an ‘Envelope’
(Marketing Value-for-money Triangles Stacked According to Decreasing Slope)
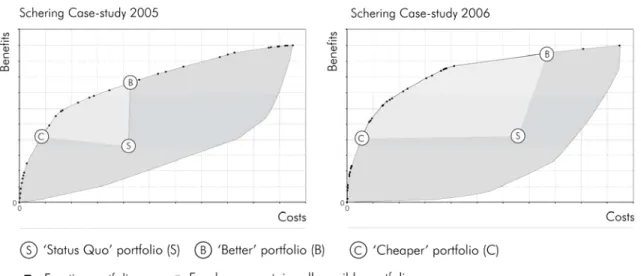
After calculating the marketing value-for-money for each activity, we were able construct efficient marketing portfolios. Considering, for example, 39 options as analysed in 2005, more than 2.5 million combinations of different activities are feasible. All combinations of activities comprise a benefit and a cost figure. Figure 5 depicts these values as ‘envelopes’ for the 2005 and 2006 case. The grey-shaded areas contain all benefit-cost combinations of possible portfolios. The black dots on the upper frontier indicate the most efficient of these portfolios. They result in a certain budget in the highest marketing value-for-money.
Figure 5 – Portfolio Values for Schering 2005 (left) and Schering 2006 (right). ‘S’ indicates the cost and benefit values for the current allocation of resources. ‘B’ refers to a better allocation of resources (similar costs, more benefits). ‘C’ refers to a cheaper allocation (similar benefits, less costs)
This figure serves to identify potential improvements in resource efficiency compared to the status quo of the marketing budget distributions (‘S’ in Figure 5). Portfolio suggestions that result in similar or lower costs, but which provide substantially more benefit than the status quo, are indicated with a ‘B’ in Figure 5. The point ‘C’ displays portfolios with a similar benefit level as the status quo, but with substantially reduced costs. These increases in efficiency can usually be realised by re- allocating resources in two ways. First, within an investment area, resources can be shifted from inefficient existing activities to more efficient new activities and, second, from areas with lower marketing value-for-money options to areas with higher marketing priority.
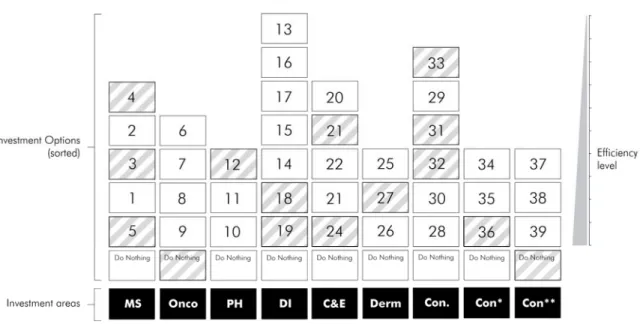
To analyse these trade-offs interactively with the decision makers, we used a portfolio software, enabling general management to discuss possible re-allocation of resources. Figure 6 shows one of these outcomes. The marketing activities in each area are sorted according to decreasing value- for-money (high efficiency activities are displayed at the bottom of each area). Using these outcomes, the managers were able to compare the efficiency of existing and new marketing activities. As
highlighted in Figure 6, several new activities are more efficient than existing ones – indicating a need to shift resources to the new activities.
Figure 6 – Portfolio of Schering 2005 case, sorted according to marketing value-for- money (activities at the bottom are the most efficient)
In the 2005 case, we identified a 101% potential efficiency increase, in 2006 an improvement potential of 118%, compared to the status quo allocation. Both efficiency increases could be realised by shifting resources to more efficient activities within each area as well as by decreasing spending in some areas, whilst increasing spending in others. As the input data for the model relies on several estimations and assumptions, the potential efficiency increases are approximations. The approach therefore does not aim to calculate the precise total marketing value-for-money for different portfolios, but rather aims to provide strategic insights into a better allocation of resources.
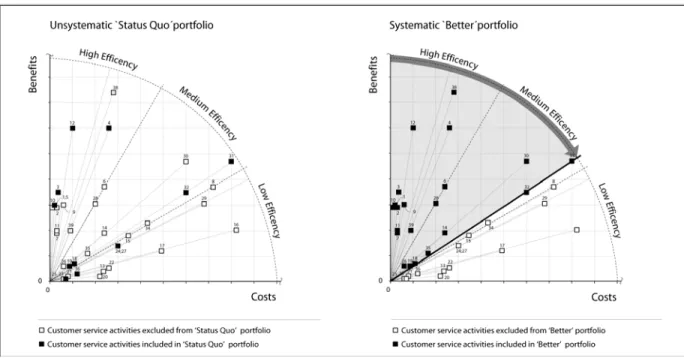
Whilst the envelopes in Figure 5 represent a top-level view on values of different portfolios, the included or excluded activities cannot be identified. To provide a further discussion device, we
developed a way to depict the individual efficiency of each marketing activity. Figure 7 displays each activity with its cost estimate and overall benefit value. Again, the axes reflect benefit and cost values, with the slope of the line connecting the origin and the activity now indicating the efficiency for that activity (Junghänel, 2005). Figure 7 (left) indicates status quo activities with black boxes and possible new activities with white boxes. Activities with the best marketing value-for-money (‘High Efficiency’
section) result in relative high benefits with lower costs. Using such visualisation, one can easily identify the sources of underperformance of the status quo allocation in year 2005. As the status quo activities are distributed across the high, medium, and low efficiency areas, they cannot reach the efficiency level of the ‘B’ portfolio, as shown in Figure 7 (right). In this case, the portfolio consists of the most efficient activities – rigidly chosen by moving down along the arrow like a ‘wiper’ with a fixed point in the origin towards the cost axis. In both graphs, the wiper stops at the budget constraint that ‘separates‘ included from excluded activities. We did not include any of the activities below the shaded area (right graph) in the portfolio as their efficiency remained too low.
Figure 7 – ‘Wiper’ Display of the Marketing Value-for-money of the Customer Service Activities from the Schering Case 2005 (adopted from Junghänel, 2005)
Additionally, managers can use this illustration to identify activities whose efficiency ratio lies close to the ‘cut-off’ line. These activities are rather sensitive to changes in scores and weights or changes in the budget constraint. As such, they qualify for deeper analysis or further validation of input data. It is highly improbable, on the other hand, that a highly efficient activity will drop out of the proposed portfolio due to a slight change in scores or weights. Further analysis of these activities is therefore often not necessary. Phillips (1984) calls these just-enough models ‘requisite’, as – contrary to other management science models – they focus modelling effort on the most relevant parts of the analysis. A time-efficient analysis, appropriate for the decision problem, is the result.
The two applications of Marketing Strategy Conferencing resulted in several insights for Schering Argentina. In 2005, the models offered an insight into the efficient re-allocation of marketing resources from one of the business units to new and quick-growing businesses. In 2006, results stimulated a critical analysis of historically established, and thus little-questioned, activities. Both results led to a significant re-allocation of resources. As the modelling results built on a transparent combination of data and judgement from Schering employees, the recommendation was owned by the managers and thus accepted and implemented. A sustainable strategic consensus on marketing priorities beyond departmental ‘silo-thinking’ was the consequence.
Drawbacks of marketing strategy conferences
While marketing strategy conferences are usually beneficial for strategy implementation, they do also have some drawbacks. As most salient disadvantage of the approach, strategic marketing decisions are strongly based on the preferences and estimates of a specific group of decision makers. It can therefore be difficult to communicate the results of a Marketing Strategy Conference to individuals not involved in the process. False consensus seeking is thereby one particularly important threat to high qualitative decisions with Marketing Strategy Conferences.
If the group is too homogenous and insufficiently critical of underlying assumptions of the organisation and the marketing strategy, insufficient identification of fundamental values, poor research of information or selective information processing (Ross and Staw, 1986; Keeney, 1992) can be the consequence. In addition, as strategic marketing decisions usually have to be taken in the face of uncertainty, overconfidence can be a source for false consensus when strategic marketing priorities have to be set. In the face of uncertainty, groups tend to overestimate their abilities in accurately assessing probabilities systematically (Hoelzl and Rustichini, 2005). One way to overcome this can be to invite an external ‘domain expert’ to the marketing strategy conference. This individual should have sufficient content knowledge and experience in the issue discussed – possibly based on benchmark analyses within the industry – to challenge the group’s traditional views and to simulate critical thinking about the issues at stake.
Conclusion
In this paper, we have introduced Marketing Strategy Conferencing as an approach to set strategic marketing priorities and allocate resources accordingly. The analytical component of the system – built on a decision model – permits an analysis of trade-offs between different types of strategic marketing initiatives. The interactive component of the approach – facilitated group meetings with on-the-spot model building and exploration – contributes towards finding a strategic consensus on marketing activities and creating commitment to action.
We designed the system to overcome some analytical, behavioural and organisational impediments to effective marketing resource allocation. First, the generative approach, when creating new marketing activities, helps to overcome incrementalism when setting marketing priorities. Second, by constructing a portfolio with consistent marketing value-for-money evaluations of each activity, managers can turn a departmental silo-perspective into holistic lateral thinking, enabling them to allocate resources company-wide as efficiently as possible. Third, the participatory decision process of
Marketing Strategy Conferencing enhances communication across departments and hierarchies, thus contributing towards creating a strategic consensus on marketing priorities.
By addressing these impediments, we aim to stimulate more applied research at the interface of decision analysis and strategic marketing. Further research can, for example, show if these methods are perceived as more effective than existing ways of setting marketing priorities. For such an effectiveness analysis, frameworks to analyse decision processes can be appropriate (see, for example, Matheson and Matheson, 2001; Rohrbaugh, 2005; Schilling, Oeser et al., 2007). Furthermore, the inclusion of outside experts in Strategic Decision Conferences has not yet been analysed systematically. In particular, the advancement of information technology and simple graphical visualisation – essential for top- management applications – can aid marketeers in increasing the quality of marketing decisions. These new developments form the basis for further stimulation of research at the interface between marketing and decision analysis.
Bibliography
Alpar, P. (1991), “Knowledge-based modelling of marketing managers’ problem solving behaviour“, International Journal of Research in Marketing, Vol. 8, pp. 5-16.
Baker, M. J. (2000), Marketing Strategy and Management, London: Macmillan Press.
Blattberg, R. C. and J. Deighton (1996), “Manage Marketing by the Customer Equity Test“, Harvard Business Review, Vol. 74, No. 4, pp. 136–144.
Bonoma, T. V. (1984), “Making your marketing strategy work“, Harvard Business Review, Vol. 62, No. 2, pp. 69-76.
Bonoma, T. V. and V. L. Crittenden (1988), “Managing Marketing Implementation“, Sloan Management Review, Vol. 29, No. 2, pp. 7-14.
Brown, R. (1991), “Making the product portfolio a basis for action“, Long Range Planning, Vol. 24, No. 1, pp. 102-110.
Burmeister, K. and C. Schade (2007), “Are entrepreneurs' decisions more biased? An experimental investigation of the susceptibility to status quo bias”, Journal of Business Venturing, Vol. 22, No. 3, pp. 340-362.
Calantone, R. J., C. A. Di Benedetto, et al. (1999), “Using the analytic hierarchy process in new product screening“, Journal of Product Innovation Management, Vol. 16, pp. 65- 76.
Cespedes, F. V. and N. F. Piercy (1996), “Implementing Marketing Strategy“, Journal of Marketing Management, Vol. 12, No. 1-3, pp. 135-160.
Chien, T. W., Lin, V. Tan, B. and Lee, W.C. (1999), “A neural networks-based approach for strategic planning“, Information and Management, Vol. 35, pp. 357-364.
Chiu, C. (2002), “A case-based customer classification approach for direct marketing“, Expert Systems with Applications, Vol. 22, No. 2, pp. 163-168.
Collier, N., F. Fishwick, et al. (2004), “Managerial Involvement and Perceptions of Strategy Process“, Long Range Planning, Vol. 37, No. 1, pp. 67-83.
Dalrymple, D. J. and H. B. Thorelli (1984), “Sales Force Budgeting“, Business Horizons, Vol.
27, No. 4, pp. 31-36.
Davies, M. A. P. (1994), “Using the AHP in Marketing Decision-making“, Journal of Marketing Management, Vol. 10, No. 1-3, pp. 57-73.
Davies, M. A. P. (2001), “Adaptive AHP: a review of marketing applications with extensions“, European Journal of Marketing, Vol. 35, No. 7/8, pp. 872-893.
Day, G. S. (1977), “Diagnosing the Product Portfolio“, Journal of Marketing, Vol. 41, No. 2, pp. 29-38.
Dhalla, N. K. a. Y., S. (1976), “Forget the product life cycle concept!“, Harvard Business Review, Vol. 54, No. 1, pp. 102-113.
Dibb, S. (1997), “How marketing planning builds internal networks“, Long Range Planning, Vol. 30, No. 1, pp. 53-63.
Dibb, S. (2002), “Marketing Planning Best Practice“, Marketing Review, Vol. 2, No. 4, pp. 1- 20.
Dibb, S. and L. Simkin (2000), “Pre-empting implementation barriers: Foundations, processes and actions – the need for internal relationships“, Journal of Marketing Management, Vol. 16, No. 5, pp. 483-503.
Dibb, S., L. Simkin, et al. (2006), Marketing - Concepts and Strategies, Boston: Houghton
Mifflin.
Dooley, R. S. and G. E. Fryxell (1999), “Attaining decision quality and commitment from dissent: The moderating effects of loyalty and competence in strategic decision making team“, Academy of Management Journal, Vol. 42, No. 4, pp. 389-402.
Dutton, J., S. Ashford, et al. (1997), “Reading the wind: How middle managers assess the context for selling issues to top managers“, Strategic Management Journal, Vol. 18, No. 5, pp. 407-423.
Dyer, J. S. (1990), “Remarks on the Analytic Hierarchy Process“, Management Science, Vol.
36, No. 3, pp. 249-258.
Eliashberg, J., S. Swami, et al. (2002), “Implementing and Evaluating SilverScreener: A Marketing Management Support System for Movie Exhibitors“, Interfaces, Vol. 31, No. 3, pp. S108-127.
Floyd, S. W. and B. Wooldridge (1992), “Middle management involvement in strategy and its association with strategic type: A research note“, Strategic Management Journal, Vol.
13, Special issue: Strategy Process: Managing Corporate Self-Renewal, pp. 153-167.
Floyd, S. W. and B. Wooldridge (1997), “Middle Management’s Strategic Influence and Organizational Performance“, Journal of Management Studies, Vol. 34, No. 3, pp.
465-485.
Fox, C. R., D. Bardolet, et al. (2005), Partition dependence in decision analysis, managerial decision making, and consumer choice. In: R. Zwick and A. Rapoport, Experimental Business Research. Volume III, The Netherlands: Dordrecht: Kluwer.
Golpayegani, S. A. H. and B. Emamizadeh (2007), “Designing work breakdown structures using modular neural networks“, Decision Support Systems, Vol. 44, pp. 202-222.
Hardin, G. (1968), “The tragedy of the commons“, Science, Vol. 162, pp. 1243-1248.
Harris, L. C. (1996a), “The anti-planner's tactics to thwart planning initiation“, Journal of Strategic Marketing, Vol. 4, No. 4, pp. 239-254.
Harris, L. C. (1996b), “The impediments to initiating planning“, Journal of Strategic Marketing, Vol. 4, No. 2, pp. 129-142.
Hartman, R., M. Doane, et al. (1991), “Consumer Rationality and the status quo“, Quarterly Journal of Economics, Vol. 106, No. 1, pp. 141-162.
Henderson, B. D. (1979), Henderson on Corporate Strategy, Boston: ABT Books.
Hillier, F. S. and G. L. Lieberman (2005), Introduction to Operations Research, Boston:
McGraw Hill.
Hoelzl, E. and A. Rustichini (2005), “Overconfident: Do You Put Your Money On It? “, Economic Journal, Vol. 115, No. 503, pp. 305-318.
Hope, J. and R. Fraser (2003), “New ways of setting rewards: The beyond budgeting model“, California Management Review, Vol. 45, No. 4, pp. 104-119.
Junghänel, S. (2005). Marketing budgeting and the across-departmental value trade-off problem: A Marketing Decision Support System based on Multiple-Criteria Decision Analysis, Technical University Berlin.
Keeney, R. L. and H. Raiffa (1976), Decisions With Multiple Objectives: Preferences and Value Trade-offs, New York: John Wiley.
Kotler, P. and K. L. Keller (2006), Marketing Management, Upper Saddle River: Prentice Hall.
Krohmer, H., C. Homburg, et al. (2002), “Should marketing be cross-functional? Conceptual
development and international empirical evidence “, Journal of Business Research,
Kuehn, A. A. (1965), Models for the Budgeting of Advertising. In: P. Langhoff, Models, Measurement and Marketing, Englewood Cliffs: Prentice Hall, pp. 125-142.
Kuo, R. J. and K. C. Xue (1998), “A decision support system for sales forecasting through fuzzy neural networks with asymmetric fuzzy weights“, Decision Support Systems, Vol. 24, pp. 105-126.
Lane, S. and D. Clewes (2000), “The implementation of marketing planning: a case study in gaining commitment at 3M (UK) Abrasives“, Journal of Strategic Marketing, Vol. 8, No. 3, pp. 225-239.
Levy, J. B. and E. Yoon (1995), “Modelling global market entry decision by fuzzy logic with an application to country risk assessment.“, European Journal of Operations Research, Vol. 82, No. 1, pp. 53-78.
Li, S. (2005), “A Web-enabled hybrid approach to strategic marketing planning: Group Delphi plus a Web-based expert system “, Expert Systems with Applications, Vol. 29, No. 2, pp. 393-400.
Li, S., R. Kinman, et al. (2000), “Computer-based support for marketing strategy development:
review and questionnaire survey“, European Journal of Marketing, Vol. 34, No. 5/6, pp. 551-576.
Lilien, G. L. and A. Rangaswamy (2003), Marketing Engineering - Computer Assisted Marketing Analysis and Planning, Upper Saddle River, New Jersey: Pearson Eduacation.
Lin, C. H. and P. J. Hsieh (2004), “A fuzzy decision support system for strategic portfolio management“, Decision Support Systems, Vol. 38, No. 3, pp. 383-398.
Little, J. and L. Lodish (1969a), “A Media Planning Calculus“, Operations Research, Vol. 17, pp. 1-35.
Little, J. D. C. (1976), “Models and Managers: The Concept of A Decision Calculus“, Management Science, Vol. 16, No. 6, pp. B466-B485.
Little, J. D. C. and L. M. Lodish (1969b), “A media planning calculus“, Operations Research, Vol. 17, No. 1, pp. 1-35.
Lodish, L. M. (1971), “CALLPLAN: An interactive salesman’s call planning system“, Management Science, Vol. 18, No. 4, Part 1, pp. 25-40.
Lodish, L. M. (2001), “Building Marketing Models that Make Money“, Interfaces, Vol. 31, No. 3, pp. 45-55.
Lodish, L. M., E. Curtis, et al. (1988), “Sales force sizing and deployment using a decision calculus model at Syntex Laboratories“, Interfaces, Vol. 18, No. 1, pp. 5-20.
Masatlioglu, Y and E. A. Ok (2004), “Rational choice with status quo bias”, Journal of Economic Theory, Vol. 121, No. 1, pp. 1-29.
Matheson, D. and J. Matheson (2001), “Smart Organizations Perform Better“, Research Technology Management, Vol. July/August, pp. 49-54.
Mazanec, J. A. (1986), “A Decision Support System for Optimizing Advertising Policy of a National Tourist Office - Model Outline and Case Study“, International Journal of Research in Marketing, Vol. 3, No., pp. 63-77.
McCartt, A. T. and J. Rohrbaugh (1995), “Managerial Openness to Change and the Introduction of GDSS: Explaining Initial Success and Failure in Decision Conferencing“, Organization Science, Vol. 6, No. 5, pp. 569-583.
McDonald, M. (1992), “Ten barriers to marketing planning“, Journal of Business and
Industrial Marketing, Vol. 7, No. 1, pp. 5-18.
McDonald, M. and H. Wilson (1990), “State-of-the-Art Developments in Expert Systems and Strategic Marketing Planning“, British Journal of Management, Vol. 1, No., pp. 159- 170.
Menon, A., Bharadwaj, S. G., Adidam, P. T. and Edison, S. (1999), “Antecedents and Consequences of Marketing Strategy Making: A Model and a Test“, Journal of Marketing, Vol. 63, No. 2, pp. 18-40.
Metaxiotis, K. and J. Psarras (2003), “Expert systems in business: applications and future directions for the operations researcher“, Industrial Management & Data, Vol. 103, No. 5-6, pp. 361-368.
Mintzberg, H. (1994), “The Rise and Fall of Strategic Planning“, Harvard Business Review, Vol. Jan/Feb, pp. 107-114.
Mintzberg, H., B. Ahlstrand, et al. (1998), Strategy Safari: A Guided Tour Through The Wilds Of Strategic Management, New York: Free Press.
Montgomery, D. B. and G. L. Urban (1969), Management Science in Marketing, Englewood Cliffs, N.J.: Prentice-Hall.
Morrison, A. and R. Wensley (1991), “Boxing up or Boxed in?: A Short History of the Boston Consulting Group Share/Growth Matrix“, Journal of Marketing Management, Vol. 7, No. 2, pp. 105-129.
Nguyen, D. (1985), “An analysis of optimal advertising under uncertainty“, Management Science, Vol. 31, No. 5, pp. 622-634.
Noble, C. and M. Mokwa (1999), “Implementing marketing strategies: developing and testing managerial theory“, Journal of Marketing, Vol. 63, No. 4, pp. 57-73.
Phillips, L. D. (1984), “A Theory of Requisite Decision Models“, Acta Psychologica, Vol. 56, pp. 29-48.
Phillips, L. D. (2007), Decision Conferencing. In: W. Edwards, J. Ralph F. Miles and D. v.
Winterfeldt, Advances in Decision Analysis, Cambridge: Cambridge University Press.
pp. 1-43
Phillips, L. D. and C. Bana e Costa (2007), “Transparent prioritisation, budgeting and resource allocation with multi-criteria decision analysis and decision conferencing“, Annals of Operations Research, Vol. 154, pp. 51-68.
Piercy, N. (1986), Marketing budgeting: a political and organisational model, Dover, New Hampshire: Croom Helm Ltd.
Piercy, N. (1990), “Marketing Concepts and Actions: Implementing Marketing-led Strategic Change“, European Journal of Marketing, Vol. 24, No. 2, pp. 24-42.
Piercy, N. F. (2002), Market-Led Strategic Change - A Guide to Transform the Process of Going to Market, Oxford: Elsevier Butterworth Heinemann.
Piercy, N. F. and N. A. Morgan (1990), “Organizational Context and Behavioral Problems as Determinants of the Effectiveness of the Strategic Marketing Planning Process“, Journal of Marketing Management, Vol. 6, No. 2, pp. 127-144.
Piercy, N. F. and N. A. Morgan (1994), “The Marketing Planning Process: Behavioral Problems Compared to Analytical Techniques in Explaining Marketing Planning Credibility“, Journal of Business Research, Vol. 29, No., pp. 167-178.
Poh, H. L. (1994), “A neural network approach for decision support,“, International Journal
of Applied Expert Systems, Vol. 2, No. 3, pp. 196-216.
Rapert, M., A. Velliquette, et al. (2002), “The strategic implementation process - Evoking strategic consensus through communication“, Journal of Business Research, Vol. 55, No. 4, pp. 301-310.
Reinartz, W., J. Thomas, et al. (2005), “Balancing Acquisition and Retention Resources to Maximize Customer Profitability“, Journal of Marketing, Vol. 69, No. 1, pp. 63-79.
Richardson, R. J. (2004), “A Marketing Resource Allocation Model“, Journal of Business &
Economic Studies, Vol. 10, No. 1, pp. 43-53.
Rohrbaugh, J. (2005), Assessing the Effectiveness of Group Decision Processes. In: S.
Schuman, The IAF Handbook of Group Facilitation, San Francisco: Jossey-Bass. pp.
449-456
Rust, R. T., K. N. Lemon, et al. (2004), “Return on Marketing: Using Customer Equity to Focus Marketing Strategy“, Journal of Marketing, Vol. 68, No. 1, pp. 109-127.
Saaty, T. L. (1977), “A scaling method for priorities in hierarchical structures“, Journal of Mathematical Psychology, Vol. 15, No., pp. 234-281.
Saaty, T. L. (1980), The Analytic Hierarchy Process, New York: McGraw-Hill.
Schilling, M., N. Oeser, et al. (2007), “How Effective are Decision Analyses? Measuring Decision Process and Group Alignment Effects.“, Decision Analysis, Vol. 4, No. 4, pp.
227-242
Schilling, M. and C. Schaub (2007). The MARA Projects: Using Decision Analysis to Create Group Alignment and Commitment in Organizations B. Decision Institute Working Paper II/2007. Berlin, Decision Institute.
Schuman, S. P. and J. Rohrbaugh (1991), “Decision conferencing for systems planning“, Information and Management, Vol. 21, No. 3, pp. 147-159.
Simkin, L. (1996), “People and Processes in Marketing Planning: The Benefits of Controlling Implementation“, Journal of Marketing Management, Vol. 12, No. 5, pp. 375-390.
Sull, D. N. (2007), “Closing the gap between strategy and execution“, MIT Sloan Management Review Vol. 48, No. 4, pp. 30-38.
Thomas, J. S., W. Reinartz, et al. (2004), “Getting the Most out of All Your Customers“, Harvard Business Review, Vol. 82, No. 7/8, pp. 116-123.
Thomas, L. C. (2002), “The nature and dynamics of counter-implementation in strategic marketing: a propositional inventory“, Journal of Strategic Marketing, Vol. 10, pp.
189-204.
Urban, G. L. (1970), “SPRINTER Mod III: A model for analysis of frequently purchased consumer goods“, Operations Research, Vol. 18, No. 5, pp. 805-854.
Vargas, L. G. and T. L. Saaty (1981), “Financial and intangible factors in fleet lease or buy decision“, Industrial Marketing Management, Vol. 10, No., pp. 1-10.
Venkatesan, R. and V. Kumar (2004), “A Customer Lifetime Value Framework for Customer Selection and Resource Allocation Strategy“, Journal of Marketing, Vol. 68, No. 4, pp.
106-125.
Wensley, R. (1981), “Strategic Marketing: Betas, Boxes, or Basics“, Journal of Marketing, Vol. 45, No. 3, pp. 173-182.
Wind, Y. and V. Mahajan (1981), “Designing product and business portfolios“, Harvard Business Review, Vol. 59, No. 1, pp. 155-165.
Wind, Y. and T. L. Saaty (1980), “Marketing Applications of the Analytic Hierarchy
Process.“, Management Science, Vol. 26, No. 7, pp. 641-658.
Wooldridge, B. and S. W. Floyd (1990), “The strategy process, middle management involvement, and organizational performance“, Strategic Management Journal, Vol.
11, No. 3, pp. 231-241.