Valid gene expression
normalization by RT-qPCR in studies on hPDL fibroblasts
with focus on orthodontic tooth movement and periodontitis
Christian Kirschneck
1, Sarah Batschkus
2, Peter Proff
1, Josef Köstler
3, Gerrit Spanier
4&
Agnes Schröder
1Meaningful, reliable and valid mRNA expression analyses by real-time quantitative PCR (RT-qPCR) can only be achieved, if suitable reference genes are chosen for normalization and if appropriate RT-qPCR quality standards are met. Human periodontal ligament (hPDL) fibroblasts play a major mediating role in orthodontic tooth movement and periodontitis. Despite corresponding in-vitro gene expression studies being a focus of interest for many years, no information is available for hPDL fibroblasts on suitable reference genes, which are generally used in RT-qPCR experiments to normalize variability between samples. The aim of this study was to identify and validate suitable reference genes for normalization in untreated hPDL fibroblasts as well as experiments on orthodontic tooth movement or periodontitis (Aggregatibacter actinomycetemcomitans). We investigated the suitability of 13 candidate reference genes using four different algorithms (geNorm, NormFinder, comparative ΔC
qand BestKeeper) and ranked them according to their expression stability. Overall PPIB (peptidylprolyl isomerase A), TBP (TATA-box-binding protein) and RPL22 (ribosomal protein 22) were found to be most stably expressed with two genes in conjunction sufficient for reliable normalization. This study provides an accurate tool for quantitative gene expression analysis in hPDL fibroblasts according to the MIQE guidelines and shows that reference gene reliability is treatment-specific.
Orthodontics and periodontology are specialties of dentistry tending to the treatment of misaligned teeth/jaws and bacterially induced inflammation of the periodontal tissues (periodontitis), respectively, with several inter- active associations existing
1. In orthodontics mechanical forces applied to the teeth result in tensile and pressure zones within the periodontal ligament (PDL)
2. PDL fibroblasts react to this mechanical strain with an increased synthesis of proinflammatory enzymes, cytokines and chemokines
2–4, triggering osteoclastogenesis. Bacterial tox- ins from periodontal pathogens in periodontitis, such as the gram-negative Aggregatibacter actinomycetemcomi- tans (Agac), the key pathogen in aggressive periodontitis
5, can in a similar way stimulate PDL fibroblasts, which are thus essential both for mediating orthodontic tooth movement and bacterial periodontitis.
Real-time quantitative PCR (RT-qPCR) and DNA microarray analysis are the methods of choice to analyse transcription of cellular genes
6,7. In contrast to microarray analysis, which allows expression profiling of a high number of genes, RT-qPCR enables a precise quantification of gene expression differences in physiological, pathological and various experimental states
8–10. However, a reliable RT-qPCR setup is necessary to achieve valid results. To improve quality and reproducibility of RT-qPCR experiments, Bustin et al. published the MIQE guide- lines
11in 2009, detailing the minimum information for publication of quantitative real-time PCR experiments. A view in current literature shows that many gene expression studies did not perform, consider or report important
1
Department of Orthodontics, University Medical Centre of Regensburg, Regensburg, D-93053, Germany.
2
Department of Orthodontics, University of Goettingen, Goettingen, D-37075, Germany.
3Institute of Microbiology and Hygiene, University Medical Centre of Regensburg, Regensburg, D-93053, Germany.
4Department of Cranial and Maxillo-Facial Surgery, University Medical Centre of Regensburg, Regensburg, D-93053, Germany. Correspondence and requests for materials should be addressed to C.K. (email: christian.kirschneck@ukr.de)
Received: 31 August 2017 Accepted: 24 October 2017 Published: xx xx xxxx
OPEN
www.nature.com/scientificreports/
aspects such as RNA integrity, qPCR-efficiency, primer specifity or secondary structure analyses of primers and amplicons, thus limiting their scientific validity and reliability
6,7,12. This is particularly the case in the field of den- tistry, with RT-qPCR studies on cells of teeth and the surrounding periodontal tissue continuously increasing, particularly in orthodontics
12–18and periodontology
19–24.
In RT-qPCR absolute quantification of gene expression is prone to errors due to intra- or interkinetic var- iations as well as variations in yield and efficiency during RNA isolation, reverse transcription and qPCR
8,25. Therefore relative gene expression is usually calculated by normalization of a target gene expression to one or more reference genes
7, which mostly regulate basic cellular functions and are deemed to be stably expressed in different experimental conditions as well as cell and tissue types
7,26,27. But “perfect” reference genes do not exist
6,7,28,29. Various studies have shown that the stability of reference genes can vary considerably between cell types, different tissues and even experimental conditions in the same specimen
6,7,28. Thus an individual validation of suitable reference genes is required to allow a valid interpretation of relative gene expression data
8,25. Otherwise relative gene expression of target genes may be over- or underestimated or even contrary to the expression actu- ally occurring
30. For various human cell types, tissues and experimental conditions valid reference genes have been identified
27,31–34. However, no valid reference genes for gene expression studies on hPDL fibroblasts have been published so far despite many studies investigating periodontitis and orthodontic tooth movement using this cell type
3,12–23,35. In most cases reference genes were not validated and normalization was performed using only one gene.
In the present study we wanted to introduce the MIQE guidelines
11to in-vitro experiments in the field of dentistry and to identify the ideal number and type of reference genes for qPCR gene expression studies on hPDL fibroblasts, particularly in experiments on orthodontic tooth movement and periodontitis, by determining the relative expression stability of 13 commonly used reference genes using four mathematical algorithms (geNorm
29, NormFinder
36, BestKeeper
37, comparative ΔC
q31). In addition, we investigated the conformity and thus reliability of these algorithms for bioinformatical analyses of reference gene stability.
Results
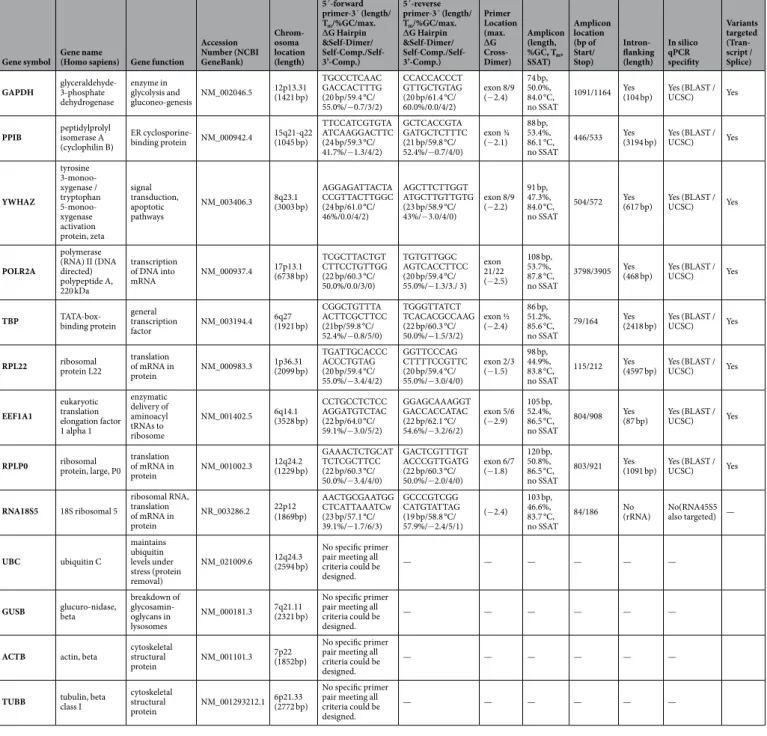
In silico analysis of primer and amplicon quality and suitability. We selected 13 candidate refer- ence genes based on their frequent usage for normalization in gene expression studies with differing functions in cell metabolism to minimize co-regulation (Table 1)
7. All primers were newly designed by the authors with NCBI PrimerBLAST
38according to the MIQE guidelines
11,39–41(Supplementary Table 1) to minimize risk of bias. Intron-flanking primer pairs to prevent a co-amplification of genomic DNA could be designed for all can- didate reference genes except RNA18S5 as well as sufficient absence of hairpin structures and self-/cross-dimer formation confirmed at annealing temperature ( ∆ G ≥ −3,5 kcal/mol
41, BeaconDesigner ™ Free Edition, Premier BioSoft International, Palo Alto, CA, USA) (Supplementary Data 1). Target amplicon sequences were chosen to range from 60 to 150 bp with a GC content of 35–65% (Table 1) and no secondary structures were found at annealing temperature
41(60 °C, Supplementary Data 1), determined by UNAFold (Integrated DNA Technologies Inc., Coralville, IA, USA). In silico specifity of constructed primers was corroborated by PrimerBLAST
38and cross-checked using the UCSC Genome Browser (University of California, CA, USA) (Supplementary Data 1).
Using NCBI PrimerBLAST
38and PrimerCheck (SpliceCenter of Genomics and Bioinformatics Group, LMP, CCR, NCI), we could confirm that primers also targeted possible splicing and transcript variants (except for RNA18S5), whereas no pseudogenes, retropseudogenes or other homologs were found to be amplified (Table 1, Supplementary Data 1), except for RNA18S5 (co-amplification of RNA45S5). For four of the 13 to be investi- gated candidate reference genes (UBC, GUSB, ACTB, TUBB), it was not possible to design a specific primer pair meeting all specified quality criteria
11,39–41, which is why they were exempted from further qPCR analy- sis (Table 1). A commercially available, non-intron-flanking primer pair for TUBB (PPH17836A-200, Qiagen, Hilden, Germany), however, was tested alongside the custom primers to comparatively assess primer specifity and relative gene expression stability.
Primer specifity, RT-qPCR efficiencies and C
qexpression levels. Primer specifity was confirmed by melting curve analysis (Fig. 1a, Supplementary Data 3) and agarose gel electrophoresis, which showed a single band at the expected molecular amplicon weight per primer pair (Fig. 1b). Primer (factor-specific) and ampli- fication (sample-specific) efficiencies ranged from 91.7% to 100.3% (E
P, Table 2, Supplementary Data 4) and 87.3% to 113.4% (E
A, Table 2) with a minimum coefficient of determination in the linear dynamic range (LDR) of 0.9949. The highest SD of the arithmetic mean of C
qof the three technical replicates among all samples (n = 18) for each candidate gene was 0.53 C
q(EEF1A1) with a mean SD of 0.08–0.28 for the individual candidate reference genes (technical reliability, Table 2). In addition biological variation of C
qvalues was limited within experimen- tal groups for each gene with SD ranging from 0.05 to 0.22 (Supplementary Table 3), except for YWHAZ and RNA18S5 (SD 0.31–0.62). C
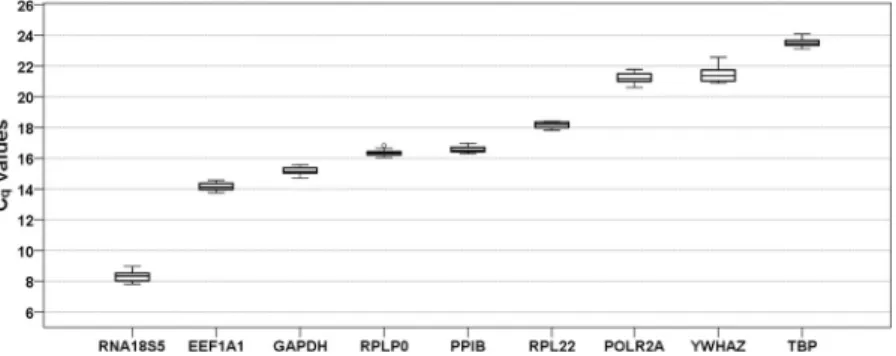
qvalues of the investigated reference genes, which inversely correspond to the initial amount of cDNA template, ranged from 8.30 to 23.52 cycles (Fig. 2, Supplementary Table 3) with lowest values observed for RNA18S5 and highest for POLR2A, YWHAZ and TBP. Specifity, efficiencies and C
qexpression lev- els for the commercially available primer pair for TUBB are given in Supplementary Data 5.
Optimal number of reference genes for normalization. geNorm analysis revealed that the use of two reference genes for normalization in RT-qPCR was adequate for studies in hPDL fibroblasts in all experimental conditions (Fig. 3a). Average pairwise variation V
n/V
n+1after inclusion of a third reference gene was below 0.15 for all tested conditions (Fig. 3a).
Relative stability of candidate reference genes. With geNorm the most stably expressed reference
genes for the pooled/overall conditions were found to be PPIB and TBP (Table 3, Fig. 3b). When we analysed the
conditions for experimental orthodontic tooth movement and for periodontitis separately with geNorm, PPIB and RPL22 were most stable in orthodontic setups, whereas TBP and PPIB were most stably expressed in experi- ments on periodontitis (Agac toxins, Table 3). NormFinder confirmed geNorm findings and also identified RPL22 and PPIB as most stable genes in combined control and compressive force conditions and PPIB and TBP for combined control and Agac toxin treatment as well as overall combined experimental conditions (Table 3). The comparative Δ C
qmethod
31was also in line with geNorm and NormFinder (Table 3). In contrast, the BestKeeper algorithm
37suggested RNA18S5 and YWHAZ for compressive force experiments, POLR2A and TBP for Agac toxins and RNA18S5 and TBP for combined experiments as the most stable reference genes (Table 3). Mean SD of mean C
qwas ≤ 1 for each gene, as required for stable reference genes. For the three experimental groups (con- trol, compressive orthodontic force, Agac toxins) separate stability rankings were also calculated and are given in Supplementary Table 4. When also considering RT-qPCR data obtained from the commercially available primer pair on TUBB, no influence on the top-ranking, most stable genes was detected (Supplementary Data 5).
Gene symbol Gene name
(Homo sapiens) Gene function
Accession Number (NCBI GeneBank)
Chrom- osoma location (length)
5´-forward primer-3´ (length/
Tm/%GC/max.
∆G Hairpin
&Self-Dimer/
Self-Comp./Self- 3’-Comp.)
5´-reverse primer-3´ (length/
Tm/%GC/max.
∆G Hairpin
&Self-Dimer/
Self-Comp./Self- 3’-Comp.)
Primer Location (max.
∆G Cross- Dimer)
Amplicon (length,
%GC, Tm, SSAT)
Amplicon location (bp of Start/
Stop)
Intron- flanking (length)
In silico qPCR specifity
Variants targeted (Tran- script / Splice) GAPDH glyceraldehyde-
3-phosphate dehydrogenase
enzyme in glycolysis and
gluconeo-genesis NM_002046.5 12p13.31 (1421 bp)
TGCCCTCAAC GACCACTTTG (20 bp/59.4 °C/
55.0%/−0.7/3/2)
CCACCACCCT GTTGCTGTAG (20 bp/61.4 °C/
60.0%/0.0/4/2)
exon 8/9 (−2.4)
74 bp, 50.0%, 84.0 °C, no SSAT
1091/1164 Yes (104 bp) Yes (BLAST /
UCSC) Yes
PPIB peptidylprolyl isomerase A (cyclophilin B)
ER cyclosporine-
binding protein NM_000942.4 15q21-q22 (1045 bp)
TTCCATCGTGTA ATCAAGGACTTC (24 bp/59.3 °C/
41.7%/−1.3/4/2)
GCTCACCGTA GATGCTCTTTC (21 bp/59.8 °C/
52.4%/−0.7/4/0) exon ¾ (−2.1)
88 bp, 53.4%, 86.1 °C, no SSAT
446/533 Yes
(3194 bp) Yes (BLAST /
UCSC) Yes
YWHAZ
tyrosine 3-monoo- xygenase / tryptophan 5-monoo- xygenase activation protein, zeta
signal transduction, apoptotic pathways
NM_003406.3 8q23.1 (3003 bp)
AGGAGATTACTA CCGTTACTTGGC (24 bp/61.0 °C/
46%/0.0/4/2)
AGCTTCTTGGT ATGCTTGTTGTG (23 bp/58.9 °C/
43%/−3.0/4/0)
exon 8/9 (−2.2)
91 bp, 47.3%, 84.0 °C, no SSAT
504/572 Yes
(617 bp) Yes (BLAST /
UCSC) Yes
POLR2A
polymerase (RNA) II (DNA directed) polypeptide A, 220 kDa
transcription of DNA into
mRNA NM_000937.4 17p13.1
(6738 bp)
TCGCTTACTGT CTTCCTGTTGG (22 bp/60.3 °C/
50.0%/0.0/3/0)
TGTGTTGGC AGTCACCTTCC (20 bp/59.4 °C/
55.0%/−1.3/3./ 3) exon 21/22 (−2.5)
108 bp, 53.7%, 87.8 °C, no SSAT
3798/3905 Yes (468 bp) Yes (BLAST /
UCSC) Yes
TBP TATA-box-
binding protein general transcription
factor NM_003194.4 6q27
(1921 bp)
CGGCTGTTTA ACTTCGCTTCC (21bp/59.8 °C/
52.4%/−0.8/5/0)
TGGGTTATCT TCACACGCCAAG (22 bp/60.3 °C/
50.0%/−1.5/3/2) exon ½ (−2.4)
86 bp, 51.2%, 85.6 °C, no SSAT
79/164 Yes
(2418 bp) Yes (BLAST /
UCSC) Yes
RPL22 ribosomal protein L22
translation of mRNA in
protein NM_000983.3 1p36.31 (2099 bp)
TGATTGCACCC ACCCTGTAG (20 bp/59.4 °C/
55.0%/−3.4/4/2)
GGTTCCCAG CTTTTCCGTTC (20 bp/59.4 °C/
55.0%/−3.0/4/0)
exon 2/3 (−1.5)
98 bp, 44.9%, 83.8 °C, no SSAT
115/212 Yes
(4597 bp) Yes (BLAST /
UCSC) Yes
EEF1A1
eukaryotic translation elongation factor 1 alpha 1
enzymatic delivery of aminoacyl tRNAs to ribosome
NM_001402.5 6q14.1 (3528 bp)
CCTGCCTCTCC AGGATGTCTAC (22 bp/64.0 °C/
59.1%/−3.0/5/2)
GGAGCAAAGGT GACCACCATAC (22 bp/62.1 °C/
54.6%/−3.2/6/2)
exon 5/6 (−2.9)
105 bp, 52.4%, 86.5 °C, no SSAT
804/908 Yes
(87 bp) Yes (BLAST /
UCSC) Yes
RPLP0 ribosomal protein, large, P0
translation of mRNA in
protein NM_001002.3 12q24.2 (1229 bp)
GAAACTCTGCAT TCTCGCTTCC (22 bp/60.3 °C/
50.0%/−3.4/4/0)
GACTCGTTTGT ACCCGTTGATG (22 bp/60.3 °C/
50.0%/−2.0/4/0)
exon 6/7 (−1.8)
120 bp, 50.8%, 86.5 °C, no SSAT
803/921 Yes
(1091 bp) Yes (BLAST /
UCSC) Yes
RNA18S5 18S ribosomal 5
ribosomal RNA, translation of mRNA in protein
NR_003286.2 22p12 (1869bp)
AACTGCGAATGG CTCATTAAATCw (23 bp/57.1 °C/
39.1%/−1.7/6/3)
GCCCGTCGG CATGTATTAG (19 bp/58.8 °C/
57.9%/−2.4/5/1) (−2.4)
103 bp, 46.6%, 83.7 °C, no SSAT
84/186 No
(rRNA) No(RNA45S5 also targeted) —
UBC ubiquitin C
maintains ubiquitin levels under stress (protein removal)
NM_021009.6 12q24.3 (2594 bp)
No specific primer pair meeting all criteria could be designed.
— — — — — —
GUSB glucuro-nidase, beta
breakdown of glycosamin- oglycans in lysosomes
NM_000181.3 7q21.11 (2321 bp)
No specific primer pair meeting all criteria could be designed.
— — — — — —
ACTB actin, beta cytoskeletal structural
protein NM_001101.3 7p22
(1852bp)
No specific primer pair meeting all criteria could be designed.
— — — — — —
TUBB tubulin, beta class I
cytoskeletal structural
protein NM_001293212.1 6p21.33 (2772 bp)
No specific primer pair meeting all criteria could be designed.
— — — — — —
Table 1. RT-qPCR gene, primer and target/amplicon information for the 13 investigated candidate references genes. ER = endoplasmic reticulum; T
m= melting temperature of primer/specific qPCR product (amplicon);
%GC = guanine/cytosine content; bp = base pairs; Comp. = Complementarity; SSAT = secondary structure at
annealing temperature.
www.nature.com/scientificreports/
Conformity of mathematical algorithms for reference gene stability analysis. Bivariate correla- tions of the pooled/overall (n = 18) gene ranking of the individual algorithms are presented in Fig. 4. geNorm, NormFinder and comparative Δ C
qshowed significant and pronounced gene ranking correlations. By contrast BestKeeper ranking did not correlate significantly with the other three tested algorithms (Fig. 4).
Discussion
In general, PPIB, TBP and RPL22 performed best as reference genes with the highest stability values and good
primer and amplification efficiency and reliability throughout for all experimental conditions and algorithms
(mostly ranking top three). In addition, these genes have different cellular functions thus avoiding co-regulation
7.
PPIB is a protein binding cyclosporine in the endoplasmic reticulum, which plays a major role in the folding of
collagen type I
42and was recently found to be associated pathological conditions, such as osteogenesis imperfecta
43,
which may also affect the periodontal apparatus. In contrast, TBP is a TATA-box-binding protein, which is required
for the initiation of transcription by RNA polymerase II
44, and RPL22 is a ribosomal protein
45,46, which is involved in
the control of morphogenesis by regulating Smad2 mRNA splicing
47. Only subtle differences in their relative stability
were detected among the three genes. A notable exception is RPL22 in experiments with Agac toxins (periodontitis),
ranked as more unstable by all algorithms, indicating a regulation by Agac toxins. Also in orthodontic experiments
BestKeeper found RNA18S5 and YWHAZ to be more stable than RPL22, TBP and PPIB. RNA18S5 and YWHAZ,
Figure 1. Specifity of RT-qPCR amplification as determined by (a) melting curve analysis and (b) agarose
gel electrophoresis of RT-qPCR products. For each candidate reference gene/primer pair we found a single
fluorescent band at the expected amplicon size. bp = base pairs. Gene names see Table 1. All RT-qPCR products
were run concurrently and adjacently on the same gel, which was recorded with the gel documentation system
Genoplex 2 (VWR International GmbH, Darmstadt, Germany) and its software GenoCapture (version 7.01,
Synoptics Ltd., Cambridge, UK - automatic exposure, exposure time 80 ms, no binning, transillumination) as
secure gel data (*.sgd) and exported as TIF image, which was inverted and cropped to encompass the relevant
gel area. The uncropped original gel is provided as Supplementary Figure 2.
however, are not suited as reference genes for hPDL fibroblasts, as discussed later. In a previous animal study on Fisher344 rats
10, we also found PPIB to be one of the two most stably expressed reference genes for a conglomerate of dental-periodontal tissue. The second most stable reference gene identified (YWHAZ), however, did not perform well in the present study, which could be attributable to the difference in species.
Based on the results of this study, PPIB and RPL22 or TBP are thus recommended to be used in cell cul- ture experiments with hPDL fibroblasts isolated from young and healthy donors treated with compressive force, as they are the most stably expressed reference genes under these conditions. PPIB and TBP are most stably expressed in hPDL fibroblasts stimulated with Agac toxins and should therefore be used for in vitro experiments on periodontitis. Other pre-existing pathological conditions such as osteogenesis imperfecta as well as the age of hPDL donors may also affect the performance of candidate reference genes
7,48. The results of this study can thus only be safely generalized to hPDL cells from young and generally healthy donors, whereas different gene stability rankings may be expected for hPDL cells from older donors or during pathological conditions, as evidenced by the observed reduced stability of RPL22 in experimental periodontitis.
For evaluation of reference gene stability, four algorithms were used. geNorm
29calculates the average pairwise C
qvariation of a one candidate reference gene with all other genes, which is given as expression stability M. The conceptual idea behind geNorm is the supposed constancy of the expression ratio of two ideal (stable) reference genes in all samples and experimental conditions
29. Genes with higher M values are associated with a greater average pairwise variation in gene expression and should thus be excluded for normalization, since they indicate expression ratio inconstancy and thus expression instability
29.
Despite generally increased normalization reliability
7, the usage of a plethora of reference genes is time- and cost-demanding. Thus it is neither practical nor common to use more reference genes than necessary
49. A reliable identification of the minimally necessary number of reference genes without risking distinct bias on target gene expression is therefore essential and could be achieved with the geNorm algorithm by calculating the average pairwise variation between normalization factors of n and n + 1 candidate genes (V
n/V
n+1)
29. Since variation was not substantial after addition of a third reference gene (cut-off value V ≤ 0.15), no additional stabilizing effect was achieved for normalization, which is why two reference genes should be sufficient for normalization throughout
29.
Gene symbol Slope Primer efficiency
E
P[%] (2
EP
/100%) Coefficient of
determination R
2Intraassay reliability SD of
mean of C
q* (mean, min./max.)Amplification Efficiency E
A[%] (2
EA
/100%)
GAPDH
−3.48093.8 (1.916) 0.9998 0.12 0.03/0.24 91.1 (1.880)
PPIB
−3.50992.7 (1.902) 0.9996 0.13 0.01/0.29 90.6 (1.874)
YWHAZ
−3.48893.5 (1.912) 0.9993 0.11 0.03/0.32 91.3 (1.883)
POLR2A
−3.52092.3 (1.897) 0.9984 0.17 0.04/0.35 87.3 (1.832)
TBP
−3.53891.7 (1.888) 0.9974 0.11 0.02/0.27 89.7 (1.862)
RPL22
−3.40396.7 (1.955) 0.9949 0.13 0.02/0.33 90.1 (1.868)
EEF1A1
−3.315100.3 (2.004) 0.9951 0.28 0.19/0.53 89.5 (1.860)
RPLP0
−3.50992.7 (1.902) 0.9992 0.17 0.05/0.36 87.8 (1.838)
RNA18S5
−3.319100.1 (2.002) 0.9974 0.08 0.03/0.20 113.4 (2.195)
Table 2. Primer efficiency (factor-specific) and coefficients of determination derived from a standard curve for each primer pair (6x log
10dilution of cDNA stock solution, random untreated sample) as well as technical repeatability (intraassay reliability, n = 18) and amplification efficiency (sample-specific), calculated using LinRegPCR software (http://LinRegPCR.HFRC.nl; n = 18 in triplets).
*Of three technical replicates (triplet) among all biological replicates (n = 18). CI = confidence interval.
Figure 2. Expression levels of candidate reference genes across all experimental groups (n = 18). Values are presented as quantification cycle (C
q, mean of triplicate technical replicates) as second derivative maximum of the fluorescence curve and are inversely proportional to the initial amount of cDNA. Genes are ordered from left (highest expression) to right (lowest expression) according to their mean C
qvalues. Gene names see Table 1.
Boxplots show median, interquartile range (box) and data range (whiskers).
www.nature.com/scientificreports/
The NormFinder algorithm
36determines intra- and intergroup variation, creating a combined stability value for each candidate reference gene using a model-based approach
36with lower stability values associated with higher expression stability. The comparative Δ C
qmethod compares the relative expression of gene pairs within each biological replicate and ranks reference genes according to the mean standard deviation of the mean ∆C
qdifferences of the respective gene from all other genes assessed with a lower SD indicating a more stable gene expression
31. The underlying conceptual idea is that if Δ C
qvalues between two assessed genes show variation between different samples, the expression level of one or both genes is bound to vary
31. By performing repeated pairwise comparisons for all candidate gene combinations, the gene pairs with least variability and thus highest stability can be determined
31.
BestKeeper
37determines stability based on the standard deviation (SD) of C
qmeans of each candidate refer- ence gene as well as Pearson’s correlation coefficient r by pairwise bivariate correlations of C
qvalues of each gene with a “BestKeeper Index” as geometric mean of the individual C
qvalues of all reference genes with SD ≤ 1 (genes with SD > 1 are excluded as unsuitable/unstable). Higher r values, indicating a higher contribution of the respec- tive gene to the “Index”, can thus be interpreted as more stably expressed genes.
The different stability values for individual candidate reference genes show that both orthodontic force appli-
cation as well as bacterial Agac toxins have a distinct influence on the gene expression of basic cell metabolism,
confirming that complex cellular-biological processes occur during both conditions directly affecting basic cell
metabolism at a transcriptional level
2,3,5,10. Interestingly, some of the more popular reference genes used previ-
ously, particularly in orthodontic and periodontitis experiments on hPDL fibroblasts
12–17, performed with lower
stability than anticipated. These include traditional and often used reference genes such as β -actin
33(ACTB),
glucuronidase beta (GUSB), ubiquitin C (UBC) and tubulin beta class I (TUBB), for which no specific primer pair
could be constructed according to the MIQE guidelines
11. Several of them are commercially available, but these
primers not in line with MIQE guidelines, as was the case with the comparatively tested primer pair for TUBB,
which was gene-specific, but not intron-spanning/-flanking, allowing a co-amplification of genomic DNA, if no
Figure 3. GeNorm expression stability analysis of the nine candidate reference genes, for which specific
primers could be constructed. (a) Optimal number of reference genes for hPDL RT-qPCR data normalization
in orthodontic studies (compressive orthodontic force vs. untreated control, n = 12), studies on periodontitis
(Agac toxins vs. untreated control, n = 12) and pooled/overall (n = 18). (b) Average expression stability values of
overall (pooled) specimens derived by stepwise exclusion of the least stable reference gene across all specimens
and experimental conditions (n = 18). A smaller M value indicates a more stable gene expression. Gene names
see Table 1.
DNAse treatment is performed. Since sequences of these commercially available primers are often not published for corroboration, other problems such as secondary structure formation of primers and amplicons at annealing might be present as well, which is why we chose to exclude these genes and primers in our principal analysis.
Furthermore the frequently used reference genes 18S-rRNA (RNA18S5)
8, POLR2A
15–17,50and GAPDH
13,14also showed limited expression stability. Thus the usage of these common reference genes should be reconsidered in future gene expression studies on hPDL fibroblasts. In addition, both RNA18S5 and EEF1A1 show quite high absolute expression levels, which could pose a problem in relative quantification, since the expression levels of reference genes should approximate those of target genes for reliable results
7. The usage of ribosomal RNA genes as reference has also been discouraged due to various other associated problems
7. EEF1A1 did perform well in gene rankings for individual experimental groups, but showed both the highest technical as well as biological variation among all genes tested. YWHAZ also showed high biological variation and reduced stability, limiting its suitability.
The results indicate that RNA samples were of sufficient quality for RT-qPCR analysis. High intraassay and biological reliability as well as sufficient precision of the obtained data
39could be confirmed. Protein-free and intact RNA were indicated by purity and integrity assessment of total RNA. If protein contamination is present, it could result in an inhibition of the reverse transcription and qPCR reaction, thus leading to biased C
qvalues
40. Primer efficiency (from standard curve
11,37) ranged between 91.7% and 100.3% and amplification efficiency (from individual kinetic curves
51, LinRegPCR
52–54) between 83.2% and 119.3%. Thus formation of primer dimers, which can cause an efficiency beyond 100%
39, was mostly at an acceptable level. Only for RNA18S5 we found primer and amplification efficiencies over 100%. This overestimation of efficiency can most likely be attributed to inhibitor
Rank
Total (of 4 methods) geNorm NormFinder comparative deltaC
qBestKeeper
Ranking
order Rank
sum Ranking
order Stability
value (M) Ranking order
Stability value (
ρig/
σi
) Standard
error Ranking order
Stability value (mean SD of mean
∆Cq
) Ranking
order Stability value (r)
SD (
+/
−C
q) CV (%
C
q) hPDL untreated + compressive orthodontic force (experiments on orthodontic tooth movement, n = 12)
1.) RPL22 6 RPL22 0.219 RPL22 0.035 0.027 RPL22 0.232 RNA18S5 0.910 0.259 3.110
2.) PPIB 11 PPIB 0.232 PPIB 0.072 0.024 PPIB 0.246 YWHAZ 0.887 0.373 1.728
3.)
TBP 13 TBP 0.245 TBP 0.085 0.026 TBP 0.260 RPL22 0.842 0.121 0.6654.) RNA18S5 19 RPLP0 0.255 RPLP0 0.110 0.029 RPLP0 0.268
TBP 0.808 0.202 0.8605.) RPLP0 19 EEF1A1 0.269 EEF1A1 0.131 0.033 EEF1A1 0.282
PPIB 0.756 0.187 1.1286.) EEF1A1 23 RNA18S5 0.305 RNA18S5 0.154 0.037 RNA18S5 0.311 POLR2A 0.660 0.357 1.681
7.) YWHAZ 29 GAPDH 0.316 GAPDH 0.182 0.042 GAPDH 0.334 RPLP0 0.419 0.098 0.601
8.) GAPDH 30 POLR2A 0.346 POLR2A 0.207 0.047 POLR2A 0.373 EEF1A1 0.388 0.114 0.814
9.) POLR2A 30 YWHAZ 0.385 YWHAZ 0.238 0.053 YWHAZ 0.416 GAPDH
−0.1390.117 0.776
hPDL untreated
+Agac toxins/bacterial lysate (experiments on periodontitis, n
=12)
1.) PPIB 6 PPIB 0.179 PPIB 0.037 0.022 PPIB 0.189 POLR2A 0.840 0.176 0.836
2.) TBP 8 TBP 0.186 TBP 0.046 0.021 TBP 0.196 TBP 0.761 0.121 0.518
3.) POLR2A 14 EEF1A1 0.191 POLR2A 0.085 0.024 EEF1A1 0.196
PPIB 0.717 0.099 0.6024.) EEF1A1 15 POLR2A 0.212 GAPDH 0.086 0.024
RPL22 0.222GAPDH 0.683 0.159 1.044
5.) GAPDH 22 RPLP0 0.213 EEF1A1 0.086 0.024 RPLP0 0.224 RNA18S5 0.643 0.269 3.261
6.)
RPL22 23 RPL22 0.213 RPL22 0.102 0.026POLR2A 0.225 EEF1A1 0.641 0.167 1.170
7.) RPLP0 24 GAPDH 0.216 RPLP0 0.109 0.028 GAPDH 0.226 RPLP0 0.562 0.172 1.049
8.) RNA18S5 29 RNA18S5 0.339 RNA18S5 0.208 0.046 RNA18S5 0.347
RPL22 0.557 0.164 0.9029.) YWHAZ 36 YWHAZ 0.399 YWHAZ 0.260 0.057 YWHAZ 0.425 YWHAZ 0.266 0.318 1.488
hPDL pooled/overall (experiments on orthodontic tooth movement and periodontitis n = 18)
1.) PPIB 6 PPIB 0.241 PPIB 0.062 0.021 PPIB 0.254 RNA18S5 0.781 0.266 3.199
2.) TBP 8 TBP 0.249 TBP 0.073 0.021 TBP 0.263 TBP 0.751 0.173 0.735
3.)
RPL22 14 RPL22 0.250 RPL22 0.085 0.022 RPL22 0.263 PPIB 0.699 0.158 0.9554.) RPLP0 19 RPLP0 0.271 RPLP0 0.122 0.026 RPLP0 0.287 POLR2A 0.638 0.280 1.320
5.) POLR2A 22 EEF1A1 0.303 EEF1A1 0.161 0.031 EEF1A1 0.313 YWHAZ 0.638 0.381 1.777
6.) EEF1A1 23 POLR2A 0.317 POLR2A 0.168 0.032 POLR2A 0.340 RPL22 0.596 0.141 0.776
7.) RNA18S5 23 GAPDH 0.335 RNA18S5 0.182 0.034 RNA18S5 0.350 RPLP0 0.429 0.149 0.913
8.) YWHAZ 31 RNA18S5 0.341 GAPDH 0.187 0.035 GAPDH 0.353 EEF1A1 0.399 0.181 1.277
9.) GAPDH 32 YWHAZ 0.440 YWHAZ 0.280 0.049 YWHAZ 0.472 GAPDH 0.206 0.189 1.245
Table 3. Reference gene stability ranking for hPDL experiments on orthodontic tooth movement (compressive orthodontic force vs. untreated control), experiments on periodontitis (Agac, toxins/bacterial lysate vs. untreated control) and pooled/overall experimental conditions as calculated by the algorithms geNorm, NormFinder, comparative Δ Cq and BestKeeper. A higher rank denotes lower expression stability C
q= quantification cycle;
SD = standard deviation; CV = coefficient of variation; r = Pearson’s correlation coefficient.
www.nature.com/scientificreports/
traces in the RNA sample, which were further diluted for efficiency analyses, as well as the very low C
qvalues for RNA18S5, which make RNA18S5 an unsuitable reference gene, since absolute expression of reference genes should be similar to that of target genes
7,10. Amplification efficiencies distinctly below 90% for POLR2A and RPLP0 also indicate limited suitability of these genes for normalization. Primer specifity as confirmed in silico and in vitro successfully prevented the co-amplification of pseudo-genes and homologues.
Although various studies on other tissues and species also used several algorithms to assess reference gene stability
52,55,56, others only considered one or two algorithms
27,34. We thus comparatively examined the various available statistical stability algorithms regarding their conformity to determine, whether the combined usage of several algorithms has advantages in reference gene stability determination. Our study showed a significant and high correlation between geNorm, NormFinder and comparative Δ C
qalgorithms as confirmed by the similar stability rankings of genes observed, which indicate that these could be used interchangeably. However, no signif- icant correlations were found with the BestKeeper algorithm. Several reasons for this discrepancy of BestKeeper rankings to the rankings produced by the other algorithms can be assumed. BestKeeper was not particularly created to produce rankings of reference genes, but rather focuses on general suitability in a sequential two-step assessment (standard deviation of mean C
qand then correlation coefficient r). The three similarly performing algorithms are based on either performing pairwise comparisons of individual candidate reference genes with linear quantities (geNorm)/raw Δ C
qvalues (comparative Δ C
qmethod), ranking genes according to their expres- sion profile similarity
36, or a model-based approach using linear quantities (NormFinder), which is considered more robust, since it is less influenced by co-regulation of candidate reference genes
36. By contrast, BestKeeper performs correlations of candidate genes with a single “BestKeeper Index”, identical for all correlations and not created from all candidate genes, but a selection hereof, pre-excluding those with higher C
qstandard deviations than 1. Furthermore BestKeeper is based on raw C
qvalues instead of linear quantities, which are used by geNorm and NormFinder.
Conclusion
Using four different mathematical algorithms (geNorm, NormFinder, comparative Δ C
qand BestKeeper) PPIB,
TBP and RPL22 were identified as the most stable, reliable and suitable reference genes for normalization in
relative RT-qPCR gene expression studies on human periodontal ligament fibroblasts, particularly in studies
on orthodontic tooth movement (PPIB/RPL22) and periodontitis (Aggregatibacter actinomycetemcomitans,
PPIB/TBP). Two reference genes were found to be sufficient for reliable normalization throughout. Many tra-
ditional and frequently used reference genes such as RNA18S5, POLR2A or GAPDH showed limited suitability
and should be avoided in future experiments. The same is true for reference genes, for which no specific primers
Figure 4. Correlation matrix of the stability values of the four different algorithms used for reference gene
evaluation (geNorm, NormFinder, BestKeeper, comparative ΔC
q). Scatterplots visualize bivariate correlations
of the overall stability values of the nine assessed candidate reference genes as computed by two different
algorithms including a linear regression line. r = Pearson’s correlation coefficient; **p ≤ 0.01.
could be designed according to pre-specified quality criteria as described by the MIQE guidelines (ACTB, GUSB, UBC, TUBB). BestKeeper produced distinctly different stability rankings compared to the other algorithms, thus suggesting a rank-sum approach for stability evaluation.
Materials and Methods
In vitro cell culture experiments. Primary human periodontal ligament (hPDL) fibroblasts were culti- vated from periodontal connective tissue isolated from the middle root section of human teeth free of decay, which had been freshly extracted for medical reasons at the authors’ dental facility. A pool of hPDL cell lines from four different patients was used (1 male, 3 female, age: 16–23 years). Collection and usage of hPDL fibro- blasts from discarded patient biomaterial were approved by the ethics committee of the University of Regensburg, Germany (approval number 12-170-0150), and all experiments were carried out in accordance with the relevant guidelines and regulations. Informed consent was obtained from all participants and/or their legal guardian/s.
Tissue samples were grown in 6-well cell-culture-plates until proliferation of adherently growing hPDL fibro- blasts under normal cell culture conditions (37 °C, 5% CO
2, water-saturated) in full media consisting of DMEM high glucose (D5796, Sigma–Aldrich ® , Munich, Germany), 10% FCS (P30–3306, PAN-Biotech, Aidenbach, Germany), 1% L-glutamine (SH30034.01, GE-Healthcare-Europe, Munich, Germany), 100 µM ascorbic acid (A8960, Sigma-Aldrich ® ) and 1% antibiotics/antimycotics (A5955, Sigma-Aldrich ® ). hPDL fibroblasts were identified by their spindle-shaped morphology and hPDL-specific marker gene expression
12,57,58(Supplementary Table 5 and Supplementary Fig. 1). Until use they were then frozen in liquid nitrogen (90% FCS, 10% DMSO, freezing 1 °C/minute).
hPDL fibroblasts of the 6
thpassage
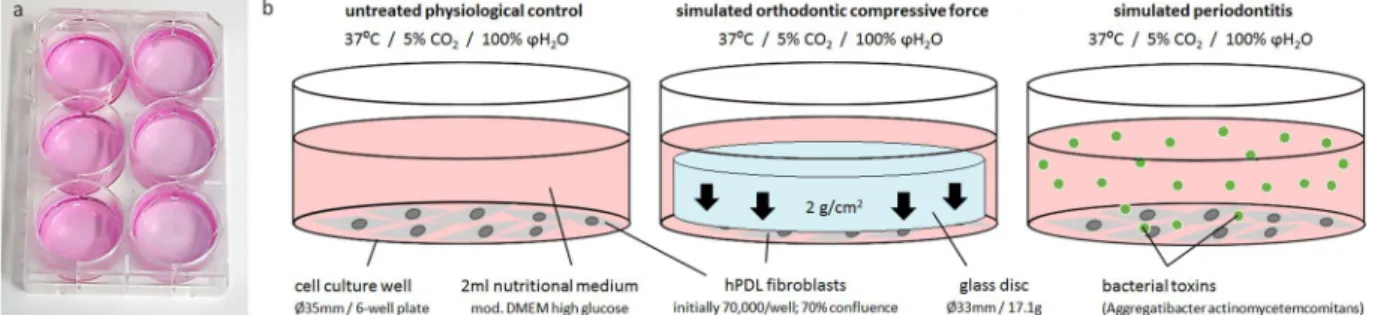
24, quantified with Beckman Coulter Counter Z2 ™ (Beckman Coulter GmbH, Krefeld, Germany) according to the manufacturer’s recommendations, were randomly seeded onto 6-well cell-culture-plates at an initial density of 70,000 cells per well (Fig. 5a). We prepared three different experimental groups at 70% confluency (Fig. 5b) (37 °C, 5% CO
2, 100% water-saturated, 2 ml DMEM/well) with 6 biological replicates (samples) each:
• Untreated (physiological conditions, n = 6) - incubated for 48 h;
• Compressive orthodontic force (n = 6) - mechanical stimulation for 24 h (2 g/cm
2pressure, sterilized glass plate of defined weight and size) according to Kanzaki et al.
3and Kirschneck et al.
15,16after a pre-incubation phase of 24 h;
• Periodontitis (n = 6) - according to Proff et al.
17, hPDL fibroblasts were incubated for 48 h with bacterial lysate of heat-inactivated Aggregatibacter actinomycetemcomitans (Agac, 10
7cells/ml, DSM11123, German Collection of Microorganisms and Cell Cultures, Braunschweig, Germany), which was prepared as described before
12,17.
Isolation and purity assessment of total RNA. After washing the hPDL fibroblasts twice with phosphate-buffered saline, total RNA was extracted by applying peqGOLD TriFast ™ (1 ml/well, PEQLAB-Biotechnology GmbH, Erlangen, Germany) and further processing according to the manufacturer’s instructions
10,15,16. No DNAse treatment was performed, as all used primers were intron-flanking. We eluted the resulting RNA pellet in nuclease-free water (25 µl, T143, Carl-Roth GmbH, Karlsruhe, Germany) with immediate cooling on ice. To assess purity and quantity of the eluted total RNA, we determined optical density (OD) photometrically at 280 nm and 260 nm (NanoDrop ND-2000, Thermo-Fisher Scientific Inc., Waltham, MA, USA) with 1 OD
260nmequalling 40 ng/µl total RNA
10. An OD
260nm/280nmratio of >1.8 was considered protein-free RNA
27,40. Mean concentration of extracted RNA (n = 18) was calculated from its optical density at 260 nm obtained with NanoDrop as 358.2 ng/µl (SD 104.7/Min. 218.6/Max. 495.4 - divergent results in capillary electrophoresis, Supplementary Data 2) with a mean NanoDrop OD
260nm/280nmratio of 1.90 (SD 0.03/Min. 1.82/
Figure 5. Experimental setup for the hPDL fibroblast experiments. (a) 6-well cell culture plate with untreated controls and simulated periodontitis (left side) as well as simulated orthodontic compressive force (right side).
(b) Experimental conditions tested (physiological cell culture conditions): untreated physiological controls
(adherently growing hPDL cells at 70% confluence in full medium), simulated orthodontic compressive
force of 2 g/cm
2applied by a 17.1 g glass disc, simulated periodontitis by adding bacterial lysate (toxins) of
Aggregatibacter actinomycetemcomitans to the medium.
www.nature.com/scientificreports/
Max. 1.96).We measured RNA integrity with an Agilent 2100 Bioanalyzer (Agilent Technologies Inc. Santa Clara, CA, USA) according to the manufacturer’s protocol. RIN values ranged from 9.50 to 10 (mean 9.85, SD 0.15) indicating absence of RNA degradation
59(Supplementary Data 2). Integrity of total RNA was confirmed by the non-proprietary 28 S/18 S ratio of ribosomal RNA in gel electrophoresis, which ranged from 1.6 to 1.8 (mean 1.71, SD 0.09; Supplementary Data 2). Reverse transcription negative control (-RT) and negative NTC reactions confirmed sufficient absence of genomic DNA, contamination and primer dimers with measured C
qvalues sub- stantially higher than those of target samples (Supplementary Table 1).
Reverse transcription (cDNA synthesis). To synthesize cDNA, we transcribed a standardized quan- tity of 1 µg RNA per sample using a random hexamer primer (0.1 nmol, 1 µl, SO142, Life Technologies GmbH, Darmstadt, Germany), an oligo-dT18 primer (0.1 nmol, 1 µl, SO131, Life Technologies), 5 × M-MLV-buffer (4 µl, M1705, Promega, Fitchburg, WI, USA) and dNTP mix (40 nmol, 1 µl–10 nmol/dNTP, Roti ® -Mix PCR3, L785.2, Carl-Roth GmbH) ad 20 µl nuclease-free H
2O (T143, Carl-Roth GmbH). After incubation (3 min, 70 °C) the mix- ture was quickly cooled on ice. We then added reverse transcriptase (200 U, 1 µl, M1705, Promega) and an RNase inhibitor (40 U, 1 µl, EO0381, Life Technologies), continued incubation (37 °C, 60 min) and heat-inactivated the reverse transcriptase (95 °C, 2 min). To minimize experimental variations, synthesis of cDNA, which was stored at −20 °C until use, was performed concurrently for all samples.
Quantitative real-time polymerase chain reaction (RT-qPCR). Primer design was based on the official gene nucleotide sequences from the NCBI Nucleotide database (GeneBank, National Centre for Biotechnology Information, Bethesda MD, USA). They were constructed with NCBI PrimerBLAST
38considering the final concentration of qPCR components according to optimized criteria
11,39–41. Primers received no termi- nal or other modifications and were synthesized and purified by Eurofins MWG Operon LLC (Huntsville, AL, USA; High Purity Salt Free Purification HPSF ® ). For qPCR amplification we used a Mastercycler ® ep realplex-S thermocycler (Eppendorf AG, Hamburg, Germany) in conjunction with 96 well PCR plates (TW-MT, 712282, Biozym Scientific GmbH, Hessisch Oldendorf, Germany) and BZO Seal Filmcover sheeting (712350, Biozym Scientific GmbH). Into each well SYBR ® Green JumpStart ™ Taq ReadyMix ™ (7.5 µl, Sigma–Aldrich ® , S4438),
consisting of Tris–HCl (20 mM, pH 8.3), KCl (100 mM), MgCl
2(7 mM), dNTPs (0.4 mM per dATP, dCTP, dGTP, dTTP), stabilizers, Taq-DNA-polymerase (0.05 U/µl), JumpStart ™ Taq antibody and SYBR ® Green I, as well as the respective cDNA solution (1.5 µl, dilution 1:10) and the respective primer pair (7.5 pmol, 0.75 µl–3.75 pmol/
primer) were pipetted ad 15 µl nuclease-free H
2O (T143, Carl-Roth GmbH). We amplified the cDNA in triplets (three technical replicates) per candidate reference gene and biological replicate (sample) and on the same qPCR plate in 45 cycles (initial heat activation 95 °C/5 min, per cycle 95 °C/10 s denaturation, 60 °C/8 s annealing, 72 °C/8 s extension, Supplementary Data 3), resulting in 6 (samples) × 3 (experimental conditions) × 3 (technical replicates) analysed PCR reactions (C
qvalues) per candidate reference gene. At the end of each extension step SYBR ® Green I fluorescence was measured at 521 nm.
Amplification and primer efficiency and validation. RT-qPCR efficiency over all samples (n = 18)
37was calculated both sample-specific
51(amplification efficiency E
A, LinRegPCR software
53,54,60, http://LinRegPCR.
HFRC.nl) and factor-specific (primer efficiency E
P61) according to the MIQE guidelines
11,39,40. For primer effi- ciency determination a 6x log
10serial dilution series of a random cDNA sample (untreated group) was ampli- fied in triplet (three technical replicates per dilution level) for each candidate reference gene and the limit of detection (LOD) as the highest dilution, at which 95% (all three) of the technical replicates are detectable, was determined. Standard curves were created by linear regression of the resulting C
qvalues with the relative cDNA dilution (Supplementary Data 4) within the linear dynamic range (LDR) and the corresponding coefficients of determination r
2as well as qPCR primer efficiencies (E
P) derived from the slope of the standard curve: E
P= (10
−1/slope