the CERN SPS 1
P. Seyboth
Max-Plank-Institut f urPhysik, Munih,Germany
Jan Kohanowski University, Kiele,Poland
(for the NA49 and NA61 ollaborations)
Abstrat
The study of entral ollisions of heavy nulei at CERN SPS energies
by NA49providedevideneforthe onsetofdeonnementaround30AGeV.
Theoretialonsiderationspreditaritialpointofstronglyinteratingmat-
teraessibleintheSPSenergyrange. Asearhfortheexpetedutuations
has not yetfound onvining signals. The strategy and plansfor the ontin-
uation of this programat the SPS by NA61 with lighter nulei is disussed.
1 Introdution
Relativistiheavy-ionollisionshavebeenwidelyusedtostudytheproperties
of matter at extreme temperatures and densities. Under suh onditions
quantum hromo dynamis (QCD) predits a phase transition between a
hadron gas and a state of quasifree quarks and gluons, the quark gluon
plasma (QGP). Exploration of the phase diagram of strongly interating
matter (Fig. 1(left))remains of fundamentalinterest.
Motivated by the preditions of the StatistialModelof the Early Stage
(SMES) [1℄ an energy san of nuleus-nuleus ollisions was performed by
the NA49 experiment at the CERN SPS in order to loate the the onset of
deonnement. Finalresults from these studies[2, 3℄willbesummarized.
QCDsuggests that the phase boundarybetween QGP and hadrons is of
rst order athigh baryondensity, ends ina ritial point (see Fig. 1 (left)),
andthenturnsintoarapidrossoveratlowbaryondensity[4℄. Intheviinity
of the ritial point large utuationsare expeted [5,6, 7℄as illustrated by
Fig. 1 (right). The status of the searh for suh utuations at the SPS by
the NA49experimentwillbereviewed. Finally,thestrategyand plansofthe
NA61 experiment[8℄for theontinuationof this programwith lighter nulei
will bedisussed.
1
Talk atVIth Workshop onPartileorrelationsand Femtosopy2010, Kiev.
(MeV) µB
500 1000
T (MeV)
0 100 200
hadrons
quark gluon plasma
chemical freeze-out SIS, AGS SPS (NA49) RHIC
E
M
color super- conductor
Figure 1: Left: Phase diagram of strongly interating matter with loa-
tions of freeze-outof the hadronomposition (asdetermined fromstatistial
model ts [9, 10℄) in entral Pb+Pb (Au+Au) ollisions at RHIC (star),
SPS (squares), AGS and SIS (triangles). The shaded band indiates the
rst order phase boundary and E its ritial endpoint as estimated by lat-
tie QCD [4℄. Right: Shemati plot of the intensity of average transverse
momentum (
p
T
) and multipliity (!) utuations near the ritial point.
The baryohemial potential
B
dereases with inreasing beam energy, the
freeze-outtemperatureT inreaseswithdereasingsizeoftheollidingnulei.
2 Onset of deonnement in the SPS energy
range
The energy dependene ofvarioushadronprodutionproperties were shown
to indiate when the produed matter droplet initially reahes deonne-
ment [1℄. Rapid hanges were found near 30A GeV in the energy san of
entral Pb+Pb ollisions whih overed SPS beam energies of 20A, 30A,
40A, 80A, and 158A GeV ( p
s
NN
= 6.3, 7.6, 8.7, 12.3 and 17.3 GeV). The
inrease of the pion yield per partiipating nuleon learly steepens in the
SPS energy region (see Fig. 2 (left)). In a statistial model senario this
an beinterpreted asan inrease of the eetive degrees of freedom[1℄ by a
fator 3 [2℄, onsistent with the ativation of quark-gluon degrees of free-
dom. The energy dependene of the ratio of the total number of produed
s and squarks (as dedued from strange partile yields) to pions is plotted
in Fig. 2 (right). It exhibits a sharp peak at low SPS energy with a fall-o
1/2) F (GeV
0 5 10 15
〉wN〈/〉π〈
5 10 15 20 25
NA49 AGS RHIC FIT
p+p p p+
(GeV) sNN
1 10 102
sE
0 0.1 0.2 0.3
SMES HGM
RQMD UrQMD HSD
Figure 2: Left: Totalpion yieldhi divided by the number of wounded nu-
leonshN
W
iversus ollisionenergyinentralPb+PbandAu+Au ompared
top+p ollisions(theFermi variableFs 0:25
NN GeV
0:5
isused). Right: Ratio
E
S
=(hKi+hi)=hioftotal numberofstrangenessarrierstopionsversus
ollision energy.
to a lower plateau value onsistent with the expetation for a deonned
phase (dash-dotted urve [1℄). The desribed features are neither seen in
p+p ollisions (open dots) nor in purely hadroni model alulations using
mirosopi transport models (UrQMD [11℄ and HSD [12℄) or the statistial
hadrongas model(HGM[13℄). Extensionsofthe HGM[10℄ provideabetter
desription of the data with a hypothetial exponential high mass hadron
spetrum whih an beonsidered equivalent todeonnement.
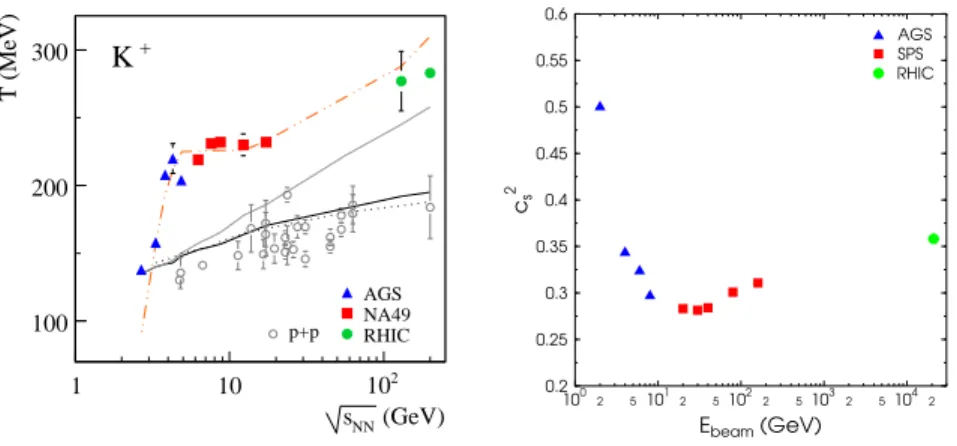
A phase transition is expeted to also manifest itself in the momentum
distributionsandorrelationsofproduedpartiles[14℄. Aplotoftheinverse
slopeparameterT oftheinvarianttransversemassdistributionofK +
mesons
at midrapidity is shown in Fig. 3 (left). One observes a steep rise at low
energies turning into a plateau at SPS energies whih is not found in p+p
reations. This feature, also found for pions, protons and antiprotons [2℄,
annot be desribed by available hadroni models and suggests the onset
of the phase transition with hadronisation through an intermediate mixed
phase. Amirosopi modelinorporatingarst ordertransition[15℄ an in
fat reprodue the measurements (dash dotted urve). The softness of the
equation of statenear the onset of deonnement is alsoseen asaminimum
in the sound veloity
s
(see Fig. 3 (right)) derived from the width of pion
rapidity distributionsusing the Landau hydrodynamial model[16℄.
(GeV) sNN
1 10 102
T (MeV)
100 200 300 K +
AGS NA49 p+p RHIC
1002 51012 51022 5103 2 51042
Ebeam(GeV) 0.2
0.25 0.3 0.35 0.4 0.45 0.5 0.55 0.6
cs2
RHIC SPS AGS
Figure 3: Left: Inverse slope parameter T of the invariant transverse mass
distributionofK +
mesonsversusollisonenergy. SquaresymbolsshowNA49
results and are ompared to measurements at lower and higher energies.
Open irles showmeasurements inp+preations. The urves showvarious
model preditions (see text). Right: Sound veloity
s
in the reball as
determinedfromthewidthofthepionrapiditydistributionusingtheLandau
hydrodynamimodel[16℄ versus energy.
Insummary,theobserved energydependeneofhadronprodutionprop-
ertiesinentralollisionsofheavynuleishowsanomaliesatlowSPSenergies
whiharemostnaturallyexplainedbytheonsetofdeonnementintheearly
stage of the produed reball forbeam energies of about 30A GeV.
3 Searh for the ritial point of strongly in-
terating matter at the SPS
The preseneofthe preditedritialpointisexpeted toleadtoaninrease
of event-by-event utuationsofmanyobservables [5,6,7℄providedthat the
freeze-out of the measured hadrons ours lose toits loation inthe phase
diagramand that the evolution of the nal hadronphase does not erase the
utuation signals. As seen in Fig. 1 (left), freeze-out at SPS energies does
ourlosetothepreditedphaseboundaryandtheritialpoint. Thesizeof
ritialutuationsdependsontheorrelationlength,whihdivergesinthe
idealase[5℄. However, duetothenitesize(radiusabout7fm)andlifetime
(few fm/) of the system reated in ollisions of heavy nulei, orrelation
[MeV/c] TpΦ
-5 0 5
10 all charged
fluct. at CP2 (Pb+Pb)=3 fm ξ
(Pb+Pb)=6 fm ξ
[MeV/c] TpΦ
0 5 10 15
all charged fluct. at CP1
=3 fm ξ
=6 fm ξ
[MeV]
Tchem
140 160 180 200
ω
1 1.5
all charged
fluct. at CP2 (Pb+Pb)=3 fm ξ
(Pb+Pb)=6 fm ξ
[MeV]
µB
200 300 400 500
ω
1 1.5 2
all charged fluct. at CP1
=3 fm ξ
=6 fm ξ
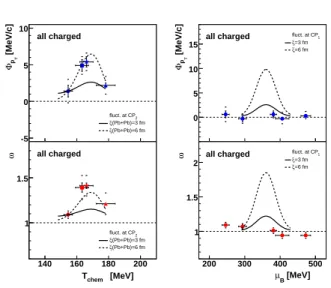
Figure4: Flutuationmeasures
p
T
ofaverage transverse momentum and !
the saled variane of the multipliity distributionversus freeze-outtemper-
ature T and baryohemial potential
B
measured by NA49. Dashed and
solid lines indiate the estimated eets of the ritial point for two values
of the orrelation length .
lengthsareexpetedtoremainbelowabout6fm[6,7℄. TheNA49andNA61
experiments follow the strategy of hanging the energy and size of nulei in
order to san the phase diagram and lookfor a maximum in utuationsas
experimental signature for the ritial point (see Figs. 1 and 9 (right)). In
the following, measurements from NA49 at the SPS will be disussed and
ompared to theoretial expetations and to resultsfrom RHIC.
Partilemultipliityutuationsare haraterizedbythe saledvariane
! of the multipliity distribution, while hp
T
i utuations an be quantied
by the
p
T
measure. System size and energy dependene of ! [17, 18℄ and
p
T
[19, 18℄ are shown in Fig. 4. Results for dierent energies and nulear
masses are plotted as funtion of baryohemial potential
B
and tempera-
ture T
hem
extrated from the hadron gas model ts to partile yields (see
above). Experimentalresultsforthe
B andT
hem
dependene areompared
to the estimated eet of the ritial point [6℄ for two hypothetial loa-
tions: CP1 (T = 147 MeV,
B
= 360 MeV) and CP2 (T = 178 MeV,
B
= 250 MeV) respetively. No indiations of a maximum is observed in the
energy dependene. However, apeakonsistent with theoretial preditions
[MeV]
Tchem
130 140 150 160 170 180 190 200 210 [MeV/c](3) TpΦ
-20 -10 0 10
20 neg. charged Pb+Pb, Si+Si, C+C, p+p forward rapidity azimuth. angle restricted
[MeV]
µB
200 250 300 350 400 450 500 [MeV/c](3) TpΦ
-20 -10 0 10
20 neg. charged 7.2% central Pb+Pb forward rapidity azimuth. angle restricted
Figure 5: Third moment (3)
p
T
of average transverse momentum utuations
versus T (left) and
B
(right) for negatively harged partiles. (NA49 pre-
liminary)
may develop in the T
hem
dependene at the highest SPS energy for olli-
sions of lighter nulei. Higher moments ofutuations are expeted toshow
larger eets [6℄, but are unfortunately also more sensitive to experimental
bakground. Figure 5 shows measurements of the third moment (3)
p
T [20℄
of hp
T
i utuations for negatively harged hadrons (providing the leanest
trak sample). No evident maximum isobserved.
[MeV]
Tchem
130 140 150 160 170 180 190 200 210 [mradians]φΦ
-20 0 20 40
p+p C+C Si+Si Pb+Pb < 1.5 GeV/c - +
0.005 < pT
< 2.6) π < 5.5 (1.1 < y* 4.0 < yπ azimuth. angle restricted
[MeV]
µB
200 250 300 350 400 450 500 [mradians]φΦ
0 20 40
negatively charged positively charged < 1.5 GeV/c
0.005 < pT < 2.6 π 1.1 < y*
- 0.5 beam < y* p y*
azimuth. angle restricted
Figure 6:
measure of utuations of the average azimuthal angle versus
T (left)and
B
(right)fornegatively(blueupperpoints)andpositively(red
lowerpoints) harged partiles. (NA49preliminary)
Event-by-event utuations of azimuthal angle are believed to be sensi-
tivetoplasmainstabilities[21℄,utuationsof elliptiow[22℄aswellasthe
pendene ofazimuthal angleutuationsare plotted inFig.7. Afeatureless
energy dependene is observed whereas a weak indiation of a maximum is
visible inthe nulear size dependene.
(GeV) sNN
10 102
) (%)π (K/dynσ
0 2 4 6 8 10
NA49 data STAR data UrQMD - NA49 acc.
UrQMD - STAR acc.
HSD
(GeV) sNN
10 102
) (%)π (p/dynσ
-10 -5 0 5 10
NA49 data STAR preliminary UrQMD - NA49 acc.
UrQMD - STAR acc.
(GeV) sNN
10 102
(K/p) (%)dynσ
-10 -5 0 5 10
NA49 (K/p) preliminary STAR (K/p) preliminary STAR (p/K) preliminary UrQMD - NA49 acc.
UrQMD - STAR acc.
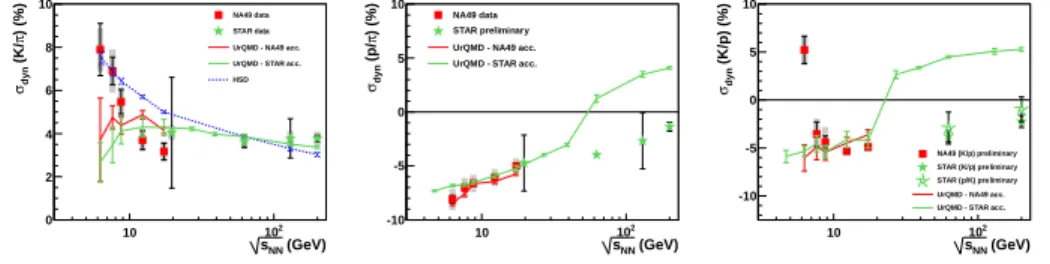
Figure7: Flutuationsofpartileratiosmeasuredby
dyn
forK/ (left),p/
(enter) and K/p (right)inentralollisions of Pb+Pb (NA49squares) and
Au+Au (STAR stars) ollisions. Curves show modelpreditions.
Event-by-event utuations of partile ratios may also be sensitive to
phase transitions and the ritial point. Results fromNA49 for the measure
dyn
=sign(
2
data
2
mix )
p
j 2
data
2
mix
j are shown in Fig. 7 and ompared
to measurements from the STAR experiment. Here 2
data
and 2
mix
are the
widthsofdistributionsofpartileratiosforreal andmixedevents,wherethe
latter estimate the statistial bakground. K/ utuations (Fig. 7 (left))
exhibitastrongrisetowardsthelowestSPSenergy. Thishasbeeninterpreted
as a onsequene of the dereasing partilemultipliities[25℄. However, the
hadroni model alulations do not provide unambiguous onrmation. On
the other hand, the rise may be related to the onset of deonnement sine
the ratio of yields of kaons to pions hanges. For the p/ ratio (Fig. 7
(enter)) oneobserves negative valuesof
dyn
whihan be explainedby the
eet of nuleonresonanesassuggested by theUrQMD modelalulations.
Thevaluesof
dyn
forthe K/pratio(Fig.7(right))hangesignastheenergy
dereases. ThisresultmayberelatedtotheorrelationoeÆientC
BS whih
is smaller inthe hadron phase than inthe QGP [26℄.
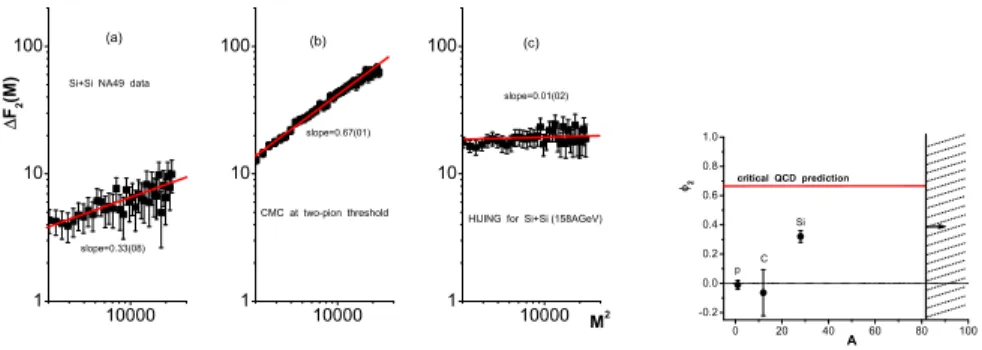
Atthe ritialpointloaldensityutuationswith power-lawsingularity
are expeted both in onguration and momentum spae [27℄ and should
appear both for baryoni density and the eld. Critial utuations
are predited to be observable as intermitteny behaviour of the fatorial
moments of the density of low-mass +
pairs in transverse momentum
spae: F
2
(M) / M 2
2
. Results for entral Si+Si ollisions at top SPS
energy are plotted in Fig. 8 (left). There is a lear intermitteny signal in
10000 1
10 100
10000 1
10 100
10000 1
10 100
M 2 slope=0.01(02)
(c)
HIJING for Si+Si (158AGeV) slope=0.67(01)
(b)
F2
(M)
CMC at two-pion threshold
slope=0.33(08) (a)
Si+Si NA49 data
0 20 40 60 80 100 -0.2
0.0 0.2 0.4 0.6 0.8 1.0
critical QCD prediction
Si
C
p
2
A
Figure 8: Left: fatorial moments F
2
for low-mass +
pairs in entral
Si+Si ollisionsat158A GeVfor data (a), simulationof ritialutuations
(b) and the HIJING model (). Right: intermitteny index
2
for various
ollisions studiedby NA49.
the data (a), somewhat weaker than in a simulation of ritial behaviour
(b), while there is no signal in a typial hadroni model (). As shown in
Fig. 8 (right)the eet disappears for smallersystems.
In summary,there is noonvining evidenefor the ritial pointas yet,
but several interesting indiations strongly motivate the ontinuation of the
searh.
4 Continuation of the searh for the ritial
point by experiment NA61 at the SPS
TheNA61/SHINEexperiment[8℄willontinuetheprogramofNA49withthe
mainaimofsearhingfortheritialpointandstudyingindetailtheonsetof
deonnement by performing a two dimensional san of the phase diagram
in T,
B
(see Fig. 9 (right)). This will be ahieved by varying ollision
energy(13A-158AGeV)andsizeoftheollidingsystems(p+p,p+Pb,B+C,
Ar+Ca, Xe+La). In additionto these main objetives, the experiment will
measure the energydependene ofthe nulearmodiationfator ofhighp
T
partile produtionatthe SPS and obtain preisiondata onhadron spetra
in hadron-nuleus ollisions for the T2K neutrino experiment, and for the
Pierre Auger Observatoryand KASCADE osmi-ray experiments.
Severalupgradesofthedetetor apparatusinheritedfromNA49areom-
pleted or in progress (see Fig. 9 (left)). In 2007, a forward Time-of-Flight
system wasonstruted in order toextend the aeptane for partileswith
(MeV) µB
200 300 400 500 600
T (MeV)
100 120 140 160 180 200
CP
NA49 top
SPS low
SPS p+p
C+C Si+Si Pb+Pb
NA61 future data
p+p
B+C Ar+Ca Xe+La
158A GeV 13A GeV
NA61 collected data
2009/2010
Figure9: Left: layoutofexperimentNA61/SHINEattheCERNSPS.Right:
san ofthe phasediagramby varying ollisionenergy (
B
)andsize ofollid-
ing nulei (T). Squares show the freeze-outpointsovered by NA49, irles
indiate the planned measurements of NA61. The estimated loation of the
ritial point isshown by the triangle.
momenta< 3GeV=. In 2008, the DAQ system and the TPC readoutele-
tronis were replaed resulting in an inrease of the data taking rate by a
fator of 10. In 2011, anew ProjetileSpetator Detetorwillbeompleted
to replaethe NA49 Forward Calorimeter. It willprovidesingle nuleon en-
ergy resolution whih willbe essential for the utuation studies. For2011,
the H2beam linewillbeonvertedintoafragmentseparatortoallowtorun
with lowmass ions (boron) in parallelwith the LHC Pb program.
The rst part of the system size and energy san program, namely p+p
ollisions at 13, 20, 30, 40, 80 and 158 GeV/ beam energy were/will be
reordedin2009,2010and2011. B+C,Ar+CaandXe+Larunsareforeseen
for 2011, 2013 and 2014, respetively.
5 Conlusion
The energy dependene of hadron prodution properties are most naturally
explained by the onset of deonnement in the SPS energy range. So far
only a tantalising indiationbut no onvining evidene has been found for
the ritial point of strongly interating matter. A vigorous experimental
program is ontinuing the searh: NA61/SHINE at the SPS, the STAR ex-
periment at RHIC, and future planned failities MPS at NICA (2016) and
CBM at FAIR (2017/2019).
[1℄ Gazdziki M. and Gorenstein M. // Ata Phys. Polon. B. 1999. V.30
P2705.
[2℄ AltC.etal.(NA49Collaboration)//Phys.Rev.C.2008.V.77P.024903.
[3℄ Gazdziki M., Gorenstein M. and Seyboth P. // preprint 2010.
arXiv:1006.1765.
[4℄ Fodor Z. and Katz S. // J. HighEnergy Phys. 2004. V.0404 P.50.
[5℄ Stephanov M., Rajagopal K. and Shuryak E. // Phys. Rev. D. 1999.
V.60 P.114028.
[6℄ Stephanov M. // Phys. Rev. Lett. 2009. V.102 P.032201 // Stephanov
M. // private ommuniation 2009.
[7℄ Berdnikov B. and Rajagopal K. //Phys. Rev. D. 2000. V.61 P.105017.
[8℄ Antoniou et al. (NA61 Collaboration) // proposal CERN-SPSC-2006-
034/P-330 and addenda.
[9℄ Beattini F. et al. // Phys. Rev. C. 2004. V.69 P.024905; Beattini F.
et al.// Phys. Rev. C. 2006. V.73P.044905.
[10℄ AndroniA.,Braun-MunzingerP.andStahelJ.//Phys.Lett.B.2009.
V.673 P.142.
[11℄ Bass S.et al.// Prog. Part. Nul.Phys. 1998. V.41P.225.
[12℄ Cassing W. et al. //Nul. Phys. A. 2000.V.674 P.249.
[13℄ Cleymans J. and Redlih K. // Phys. Rev. C. 1999. V.60 P.054908;
Braun-Munzinger P. et al.// Nul.Phys. A. 2002. V.697 P.902.
[14℄ van Hove L. // Phys. Lett. B. 1982. V.89 P.253; Gorenstein M. et al.
// Phys. Lett. B. 2003. V.567 P.175.
[15℄ Hama S. et al.// Braz.J. Phys. 2004. V.34 P.322.
[16℄ Petersen H. and Bleiher M. //Pro. of Si. 2006. CPOD2006P.25.
[17℄ C. Alt et al.Alt C. et al. (NA49 Collaboration) // Phys. Rev. C. 2008.
V.78 P.034914.
arXiv:0907.4101.
[19℄ Antii T. et al. (NA49 Collaboration) // Phys. Rev. C. 2009. V.79
P.044904.
[20℄ Mrowzynski S. //Phys. Lett. B. 1999. V.465 P.8.
[21℄ Mrowzynski S. //Phys. Lett. B. 1993. V.314 P.118.
[22℄ Mrowzynski S. and Shuryak E. // Ata Phys. Polon. B. 2003. V.314
P.4241.
[23℄ Cetner T. and Grebieszkow K. (NA49 Collaboration) //preprint 2010.
arXiv:1008.3412.
[24℄ Alt C. et al. (NA49 Collaboration) // Phys. Rev. C. 2009. V.79
P.044910; Antii C. et al. (NA49 Collaboration) 2
// preprint 2011.
arXiv:1101.3250.
[25℄ Koh V. and Shuster T. //Phys. Rev. C. 2010.V.81 P.034910.
[26℄ Koh V. //Phys. Rev. Lett. 2005. V.95P.182301.
[27℄ Antoniou N. et al. (NA49 Collaboration) //Nul.Phys.A.2005. V.761
P.149.
[28℄ Antii T. et al. (NA49 Collaboration) // Phys. Rev. C. 2010. V.81
P.064907.
2
UrQMD alulationsat p
s
NN
>20 GeV were providedbyHuiWang,MSU