RWI – Leibniz-Institut für Wirtschaftsforschung
FDZ Data description:
„Survey on marginally employed workers and their employers (MinijobsNRW)“
Lukas Hörnig
Sandra Schaffner
Herausgeber:
RWI – Leibniz-Institut für Wirtschaftsforschung Hohenzollernstraße 1–3 | 45128 Essen, Germany
Postanschrift:
Postfach 10 30 54 | 45030 Essen, Germany
Fon: +49 201–81 49-0 | E-Mail: rwi@rwi-essen.de www.rwi-essen.de
Vorstand
Prof. Dr. Dr. h. c. Christoph M. Schmidt (Präsident) Prof. Dr. Thomas K. Bauer (Vizepräsident)
Dr. Stefan Rumpf
© RWI 2020
Der Nachdruck, auch auszugsweise, ist nur mit Genehmigung des RWI gestattet.
RWI Datenbeschreibung
Schriftleitung: Prof. Dr. Dr. h. c. Christoph M. Schmidt
Gestaltung: Daniela Schwindt, Magdalena Franke, Claudia Lohkamp
FDZ Data description:
„Survey on marginally employed workers and their employers (MinijobsNRW)“
Lukas Hörnig Sandra Schaffner
RWI – Leibniz-Institut für Wirtschaftsforschung
FDZ Data description:
„Survey on marginally employed workers and their employers (MinijobsNRW)“
Lukas Hörnig
Sandra Schaffner
List of contents
Abstract ... 4
1 Background ... 5
2 Survey Design and Representativeness ... 7
3 Data Access ... 14
4 References ... 15
List of tables and figures
Figure 1 Wage Distribution of Survey Respondents in 2012 and 2016 ... 6Figure 2 Development of marginal employment in the commercial sector ... 7
Table 1 Marginally Employed Workers in North-Rhine Westphalia, Germany and the survey ... 8
Table 2 Overview on Employee-Survey 2016 – original variables ... 9
Table 3 Overview on Employee-Survey 2016 – generated variables ... 11
Table 4 Overview on Employer-Survey 2016 ... 12
Abstract
Marginal employment, so-called Minijobs, represent a significant part of the dependent employ- ment in Germany. In 20121 and 2016 the RWI conducted a survey and interviewed marginally em- ployed workers and employers with marginally employed workers in North Rhine-Westphalia. The results of the survey allow to draw conclusions for the structure of the employees, the motivations of the employees and the employers and the perception of rights like the continued payment of wages and maternity leave.
The data is available for academic research as a Scientific-Use-File from the FDZ Ruhr at RWI.
JEL: J21, J30, J81, J83, L20, C30
Keywords: marginal employment, Germany, survey data, minimum wage
1 The earlier data version was described by Schaffner and Treude (2014). This text is by its nature following the previous description.
1 Background
There have been several reforms on marginal employment in Germany. The most extensive reform took place in 1999. A fix threshold for Germany was introduced and for the first-time employers have had to pay contributions to the health and pension insurance. Since then, data on marginal employ- ment have been collected. After the establishment of the Marginal Employment Centre (Minijob- Zentrale) in 2003, the numbers of Minijobs increased rapidly until 2004. However, a decrease fol- lowed up to 2006. Overall, there was an increase of 10.5% between 2003 and 2006 (Greve, Pfeiffer
& Vennebusch 2007). In the period between 2004 and 2017, the number of Minjobs has declined from 6.8 million to 6.7 million (-1.7 %), which represents a rather small change (Minijob-Zentrale 2017). In June 2018, there were 6.8 million marginally employed workers in the commercial sector and about 311,000 in private households (7.1 million in total; Minijob-Zentrale 2018).
Marginal employment is characterized by a low monthly income of maximum 450 Euro (400 Euro before January 1st, 2013). In this range of income, there is no obligation for social security contribu- tions, so that there are no contributions to the statutory health-, unemployment- and nursing care- insurance. However, the employers pay lump-sum contributions to the health- and pension-insur- ance and for the income taxes (in sum more than 30 percent) for their marginal employees. Until December 31st, 2012, employees were exempt from mandatory pension insurance contributions but had the opportunity to pay them voluntarily and receive the respective insurance points. Since Jan- uary 2013 employees are obligated to make contributions to the pension insurance but can apply for exemption from these payments.
Marginal employment is not restricted to firms but also commonly used by private households. The work is mostly limited to services close to the households (haushaltsnahe Dienstleistungen). Most of these employees are maids, like cleaners. Private households pay lower fixed contributions than commercial employers do.
Like other employees, marginally employed workers have a claim for paid holidays, continued re- muneration in case of illness and maternity leave. If the regular full-time or part-time employees of a firm have a claim for holiday pay or Christmas bonuses, the marginal employed have it too. In addition, employment protection is the same.
Since 1999, there have been crucial changes in the labour market environment. First, (regular) employment stagnated and decreased until 2006 and has been growing since then. Second, several labour market reforms, known as Agenda 2010, were implemented in the early 2000s. It covered the liberalization of temporary work and Minijobs. Furthermore, the social and unemployment benefits were combined into a new system of benefits. Third, on 1st January 2015 a statutory minimum wage of 8.50 Euro (9.35 Euro since 1st January 2020) has been introduced. Figure 1 gives a first glimpse of how this introduction affected the wage distribution of the marginally employed workers. The min- imum wage was binding leading to a wage increase of many workers. However, from this graph conclusions about job losses cannot be drawn.
Figure 1
Wage Distribution of Survey Respondents in 2012 and 2016 For workers receiving less than 30 € per hour
Source: Bachmann et al. (2014a) and Bachmann et al. (2017a), own illustration.
In assignment of the Ministry of Labour, Integration and Social Affairs of the State of NRW, a study has been initiated to gauge the extent of marginal employment in North Rhine-Westphalia (hence- forth NRW). It is a follow up of a survey and study conducted in 2012. The survey focuses on margin- ally employed workers, employers of marginally employed workers and their respective reasoning.
Moreover, the study explores how the situation of marginally employed workers has developed in terms of hourly wage, labour rights and the transition to regular employment (RWI 2013). There is a special interest of whether and to which extent changes in the framework and policy measures in- fluence the situation of marginally employed individuals.
2 Survey Design and Representativeness
Each in September 2012 and in June 2016 a group of 25,000 marginally employed workers have been randomly selected out of all marginally employed workers from the German statutory pension insurance Westphalia and Rhineland (Deutsche Rentenversicherung henceforth DRV). The sample was restricted to workers up to the age of 60. Additionally, 10,000 employers in 2012 and in 2016 have been selected. Half of the respective sample was conducted in Rhineland and half in Westpha- lia. The pension insurance cannot distinguish between private households and commercial firms.
Therefore, the structure of the sample is completely random regarding the type of employer.
All selected employees and employers received the questionnaire by post from the respective DRV.
The respondents had the opportunity to fill out the paper questionnaire or to answer the questions in an online survey, which included the same questions. The questionnaire of the marginally em- ployed workers comprises 32 questions and the employer questionnaire 12 questions.
1,861 employers (1,261 in 2012) and 2,275 (2,198 in 2012) marginally employed workers took part in the survey. The response rate is higher in the employer survey (18.6% in 2016), which could possibly result from the much shorter questionnaire. For both groups, the response rate increased between 2012 and 2016.
Based on the response rates, it is not possible to make statements about the representativeness of the survey. The sample is drawn from all marginally employed workers in NRW, because the re- spondents have been chosen out of the data of the DRV Rhineland and Westphalia. That is why NRW will be compared with Germany hereinafter. Furthermore, we will compare the characteristics of the participants with the aggregated data of the Minijob-Zentrale.
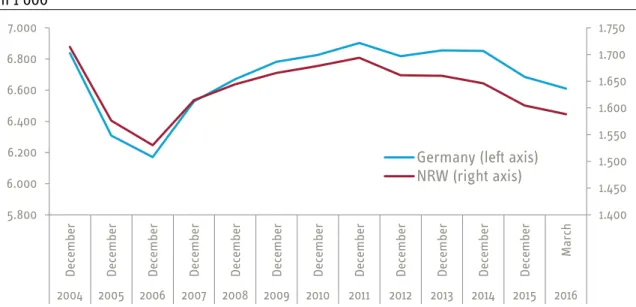
Figure 2 shows the development of marginal employment in the commercial sector for both NRW in red and Germany in blue. The share of marginally employed workers is somewhat higher in NRW than in Germany overall. In the third quarter of 2012, 92.9 of thousand residents were marginally employed in commercial enterprises and 3.65 in private households. In whole Germany there were only 82.93 marginally employed per 1.000 residents in commercial enterprises and 2.95 in private households (DRV 2012). The development over time in NRW is comparable to the overall development in Germany as observable in the figure below.
Figure 2
Development of marginal employment in the commercial sector in 1 000
1.400 1.450 1.500 1.550 1.600 1.650 1.700 1.750
5.800 6.000 6.200 6.400 6.600 6.800 7.000
ember ember ember ember ember ember ember ember ember ember ember ember March
Germany (left axis) NRW (right axis)
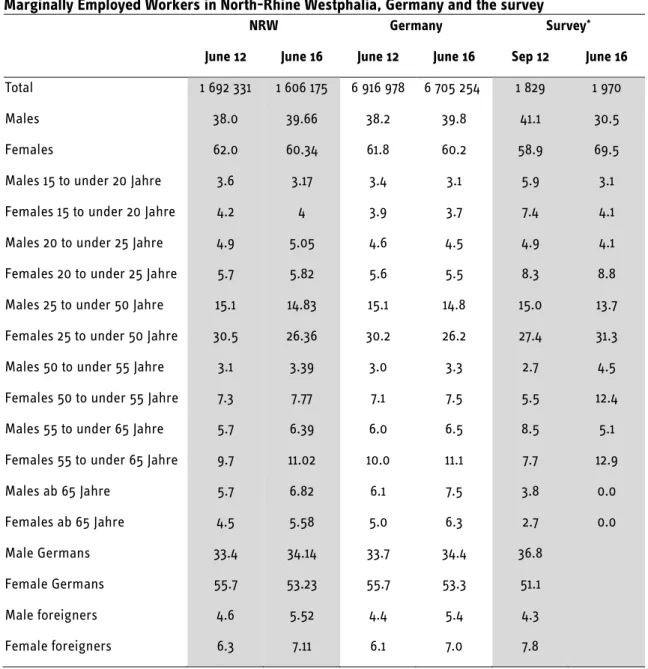
Table 1 gives an overview about the structure of the marginally employed in Germany, NRW and the survey. Marginally employed workers in NRW are quite similar to those in all Germany regarding age and gender. The same is true for the comparison of the survey with the basic population. Due to these findings we restrain from the construction of weighting factors.
Table 1
Marginally Employed Workers in North-Rhine Westphalia, Germany and the survey
NRW Germany Survey*
June 12 June 16 June 12 June 16 Sep 12 June 16
Total 1 692 331 1 606 175 6 916 978 6 705 254 1 829 1 970
Males 38.0 39.66 38.2 39.8 41.1 30.5
Females 62.0 60.34 61.8 60.2 58.9 69.5
Males 15 to under 20 Jahre 3.6 3.17 3.4 3.1 5.9 3.1
Females 15 to under 20 Jahre 4.2 4 3.9 3.7 7.4 4.1
Males 20 to under 25 Jahre 4.9 5.05 4.6 4.5 4.9 4.1
Females 20 to under 25 Jahre 5.7 5.82 5.6 5.5 8.3 8.8
Males 25 to under 50 Jahre 15.1 14.83 15.1 14.8 15.0 13.7
Females 25 to under 50 Jahre 30.5 26.36 30.2 26.2 27.4 31.3
Males 50 to under 55 Jahre 3.1 3.39 3.0 3.3 2.7 4.5
Females 50 to under 55 Jahre 7.3 7.77 7.1 7.5 5.5 12.4
Males 55 to under 65 Jahre 5.7 6.39 6.0 6.5 8.5 5.1
Females 55 to under 65 Jahre 9.7 11.02 10.0 11.1 7.7 12.9
Males ab 65 Jahre 5.7 6.82 6.1 7.5 3.8 0.0
Females ab 65 Jahre 4.5 5.58 5.0 6.3 2.7 0.0
Male Germans 33.4 34.14 33.7 34.4 36.8
Female Germans 55.7 53.23 55.7 53.3 51.1
Male foreigners 4.6 5.52 4.4 5.4 4.3
Female foreigners 6.3 7.11 6.1 7.0 7.8
Source: Minijob-Zentrale (2016) and own calculation based on Bachmann et al. (2014b) and Bach- mann et al. (2017b). – * Only those counted, who make statements on gender, year of birth, and nation- ality; Missings were excluded - Total in numbers, the subgroups are shares in percentage.
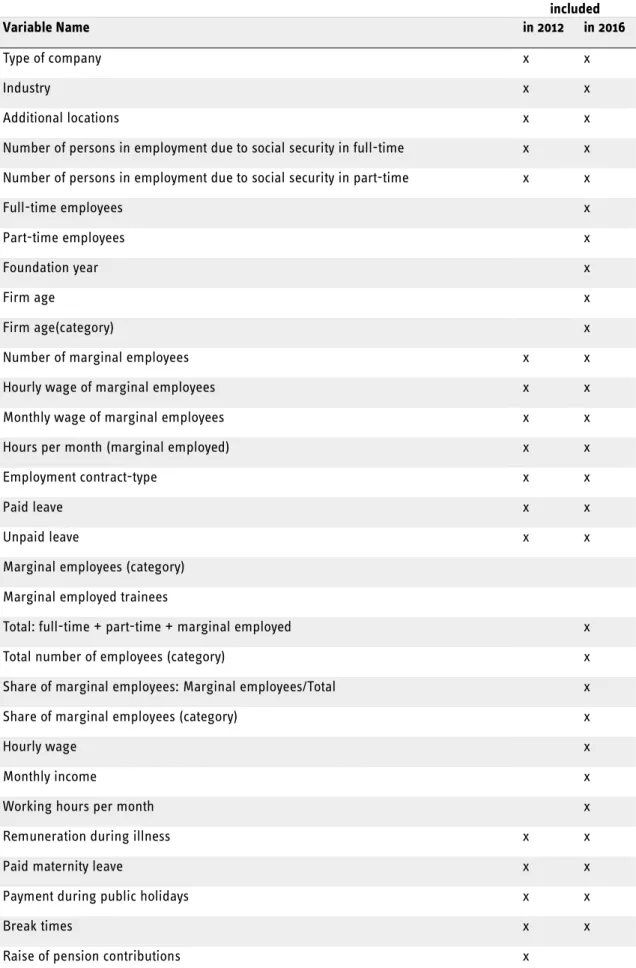
The following tables give an overview about the included variables in both surveys and their con- sistency with the surveys from 2012. Table 2 lists the original variables of the Employee Survey 2016 and whether they were already included in the first survey. Table 3 repeats this with the variables which were generated by the data processors, and not directly given by the respondents. Finally, Table 4 shows the variables of the Employer Survey 2016 and its consistency with 2012.
Table 2
Overview on Employee-Survey 2016 – original variables
included
Variable Name in 2012 in 2016
Online/Paper x x
Gender x x
Year of birth x x
Schooling x x
Professional degree x x
Living with partner x x
Employment status partner x x
Total number of persons in household x x
Children in household x x
Actuality of Minijob at 15.05.2016 x
Beginning of Minijob x x
Minijob - Paid hours per month x x
Minijob - Unpaid hours per month x x
Monthly income x x
Reason for taking up Minijob x x
Desired hours x x
Type of contract x x
Paid leave x
Unpaid leave x
Remuneration during illness x
Paid maternity leave x
Payment during public holidays x
Break times x
One the job training x
Holiday pay, Christmas bonus x x
Exemption from pension insurance x
Proposal to exempt from pension insurance by employer x
To get informed about additional services of Minijobs x
Kind of employer x x
Employees in organization x x
Number of marginal employees x x
Future x x
Employment status in addition to Minijob x x
Hours per week in part-time/ full-time job x x
Minijobs before current Minijob x
Ever worked in full-time or part-time job? x
Ever worked in full-time job? -Total number of years x
Total number of years in full-time or part-time job in last 5 x
Monthly income x x
German nationality x x
Born in Germany x x
Parents were born in Germany x x
Source: own processing.
Table 3
Overview on Employee-Survey 2016 – generated variables
included
Variable Name in 2012 in 2016
Hourly wage x
Monthly income x x
Paid working hours x
Number of unpaid working hours x
Unpaid working hours x
Total number of working hours cont. x
Total number of working hours x
Age x
Age by category x
Duration of Minjob (in months) x
Duration of Minijob (in years) x
Duration of Minijob (month categories) x
Number of marginal employees x x
Migrant background x
Benefit receipt x
Additional benefits x x
Government benefits x
Main task x
Number of Minijobs x
Severe disability x
Second Minijob x
Source: own processing.
Table 4
Overview on Employer-Survey 2016
included
Variable Name in 2012 in 2016
Type of company x x
Industry x x
Additional locations x x
Number of persons in employment due to social security in full-time x x Number of persons in employment due to social security in part-time x x
Full-time employees x
Part-time employees x
Foundation year x
Firm age x
Firm age(category) x
Number of marginal employees x x
Hourly wage of marginal employees x x
Monthly wage of marginal employees x x
Hours per month (marginal employed) x x
Employment contract-type x x
Paid leave x x
Unpaid leave x x
Marginal employees (category) Marginal employed trainees
Total: full-time + part-time + marginal employed x
Total number of employees (category) x
Share of marginal employees: Marginal employees/Total x
Share of marginal employees (category) x
Hourly wage x
Monthly income x
Working hours per month x
Remuneration during illness x x
Paid maternity leave x x
Payment during public holidays x x
Break times x x
Raise of pension contributions x
One the job training x x
Employment reasons x x
Convert marginal employment to employment due to social security x x
Number of conversions x x
Income limit increase x
Online survey x
Knowledge statutory benefits x
Exemption from compulsory pension insurance x
Converted employments, if feasible x
Wages of Minijobs increased x
Working time of Minijobs decreased x
Number Minijobs decreased x
Other benefits of Minijobs were reduced x
Minijob replaced by Midijob x
No changes compared to autumn of 2014 x
Minijob replaced by part-time job x
Minijob replaced by full-time job x
Industry with transitional arrangement x
Marginal employees are now employees subject to social security x
Other x
Online x
Source: own processing.
3 Data Access
The data are available to researchers for non-commercial use. The datasets are available as Sci- entific Use Files (SUF). The data can be obtained as a Stata® datasets (.dta) or csv files. Data access to both versions requires a signed data use agreement. Both versions are restricted to non-com- mercial research and only researchers of scientific institutions are eligible to apply for data access.
The SUF may be used at the workplace of the users. Data access is provided by the Research Data Centre Ruhr at the RWI – Leibniz-Institute for Economic Research (FDZ Ruhr am RWI). Data access can be applied for online at http://fdz.rwi-essen.de/application.html. The application form includes a brief description and title of the project, potential co-operation partners, information on the ap- plying department, expected duration of data usage as well as further participants in the project.
Data users shall cite the datasets properly with the respective DOIs. The DOIs are permanent and unique identifier for objects such as articles or data records. Unlike internet addresses (URLs), which can change, it is permanent and not affected by such changes.
The data set used is of great importance for the replicability of research results. For this reason, the data used should be clearly identified and cited in every scientific analysis. The FDZ Ruhr offers the necessary prerequisites for this by awarding DOIs. These are already used for publications as well as data sets.
The citations of the different scientific use file data sets are
Bachmann, Ronald; Bömer, Miriam; Frings, Hanna; Dürig, Wolfgang; Höckel, Lisa Sofie et. al.
(2017): Minijobs NRW: Employer and Employee Survey. Employees. 2016. RWI-Minijobs NRW. Ver- sion: 1. RWI – Leibniz-Institut für Wirtschaftsforschung. Dataset. https://doi.org/10.7807/MjAn:2016:V1
Bachmann, Ronald; Bömer, Miriam; Frings, Hanna; Dürig, Wolfgang; Höckel, Lisa Sofie et. al.
(2017): Minijobs NRW: Employer and Employee Survey. Employers. 2016. RWI-Minijobs NRW. Ver- sion: 1. RWI – Leibniz-Institut für Wirtschaftsforschung. Dataset. https://doi.org/10.7807/MjAg:2016:V1
Bachmann, Ronald; Ehlert, Christoph; Flake, Regina; Frings, Hanna; Schaffner, Sandra et. al.
(2014): Minijobs NRW: Employer and Employee Survey. Employee. RWI-Minijobs NRW. Version: 1.
RWI – Leibniz-Institut für Wirtschaftsforschung. Dataset. https://doi.org/10.7807/MjAn:2012:V1
Bachmann, Ronald; Ehlert, Christoph; Flake, Regina; Frings, Hanna; Schaffner, Sandra et. al.
(2014): Minijobs NRW: Employer and Employee Survey. Employer. RWI-Minijobs NRW. Version: 1.
RWI – Leibniz-Institut für Wirtschaftsforschung. Dataset. https://doi.org/10.7807/MjAg:2012:V1
4 References
Bachmann, Ronald; Bömer, Miriam; Frings, Hanna; Dürig, Wolfgang; Höckel, Lisa Sofie et. al.
(2017): Minijobs NRW: Employer and Employee Survey. Employees. 2016. RWI-Minijobs NRW. Ver- sion: 1. RWI – Leibniz-Institut für Wirtschaftsforschung. Dataset. https://doi.org/10.7807/MjAn:2016:V1
Bachmann, Ronald; Bömer, Miriam; Frings, Hanna; Dürig, Wolfgang; Höckel, Lisa Sofie et. al.
(2017): Minijobs NRW: Employer and Employee Survey. Employers. 2016. RWI-Minijobs NRW. Ver- sion: 1. RWI – Leibniz-Institut für Wirtschaftsforschung. Dataset. https://doi.org/10.7807/MjAg:2016:V1
Bachmann, Ronald; Ehlert, Christoph; Flake, Regina; Frings, Hanna; Schaffner, Sandra et. al.
(2014): Minijobs NRW: Employer and Employee Survey. Employee. RWI-Minijobs NRW. Version: 1.
RWI – Leibniz-Institut für Wirtschaftsforschung. Dataset. https://doi.org/10.7807/MjAn:2012:V1 Bachmann, Ronald; Ehlert, Christoph; Flake, Regina; Frings, Hanna; Schaffner, Sandra et. al.
(2014): Minijobs NRW: Employer and Employee Survey. Employer. RWI-Minijobs NRW. Version: 1.
RWI – Leibniz-Institut für Wirtschaftsforschung. Dataset. https://doi.org/10.7807/MjAg:2012:V1 Deutsche Rentenversicherung Knappschaft-Bahn-See / Minijob-Zentrale (ed.) (2012): IV. Quartal 2012. Aktuelle Entwicklungen im Bereich der geringfügigen Beschäftigung. Quartalsbericht.
Deutsche Rentenversicherung Knappschaft-Bahn-See / Minijob-Zentrale (ed.) (2016): 1. Quartal 2016. Aktuelle Entwicklungen im Bereich der geringfügigen Beschäftigung. Quartalsbericht.
Greve, Georg; Pfeiffer, Roman; Vennebusch, Thorsten (2007): Minijob-Zentrale - Entwicklung und Status quo der geringfügigen Beschäftigung. RV aktuell Nr. 3. Available under https://www.minijob- zentrale.de/DE/02_fuer_journalisten/02_berichte_trendreporte/sonstige/PDF-2_Entwicklung_Mini- jobs.pdf?__blob=publicationFile&v=2. Last access March 23, 2020.
Minijob-Zentrale (2016), Sonderauswertungen aus der Statistik der Minijob-Zentrale. Minijob- Zentrale, Essen.
Minijob Zentrale (2017): Quartalsbericht. Available under https://www.minijob-zent- rale.de/DE/02_fuer_journalisten/02_berichte_trendreporte/quartalsberichte_archiv/2017/3_2017_ent- wicklung.pdf?__blob=publicationFile&v=1. Deutsche Rentenversicherung Knappschaft-Bahn-See.
Last access March 23, 2020.
Minijob Zentrale (2018): Aktuelle Entwicklungen im Bereich der Minijobs. 2. Quartalsbericht 2018.
Deutsche Rentenversicherung Knappschaft-Bahn-See. Available under https://www.minijob-zent- rale.de/DE/02_fuer_journalisten/02_berichte_trendreporte/quartalsberichte_ar-
chiv/2018/2_2018_1.html?nn=700302. Last access March 23, 2020.
RWI (2013): Studie zur Analyse der geringfügigen Beschäftigungsverhältnisse. RWI Projektberichte.
Available under http://www.rwi-essen.de/media/content/pages/publikationen/rwi-projektber- ichte/PB_Analyse-der-Minijobs.pdf. Last access March 24, 2020.
Das RWI wird vom Bund und vom Land Nordrhein-Westfalen gefördert.
Leibniz-Institut für Wirtschaftsforschung