Name der promotionsführenden Einrichtung
Improvement and validation of a computer model for the thermo-mechanical fuel rod behavior during reactivity transients in nuclear reactors
Titel der wissenschaftlichen Abhandlung
Lars Holt
Vorname und Name
Vollständiger Abdruck der von der promotionsführenden Einrichtung Fakultät für Maschinenwesen
der Technischen Universität München zur Erlangung des akademischen Grades eines Doktor-Ingenieurs
genehmigten Dissertation.
Vorsitzende/-r: Prof. Dr.-Ing. Thomas F. Sattelmayer
Prüfende/-r der Dissertation:
1. Prof. Rafael Macián-Juan, Ph.D.
2. Prof. Dr. rer. nat. Hans-Josef Allelein (RWTH Aachen)
Die Dissertation wurde am 06.10.2016 bei der Technischen Universität München eingereicht und durch die promotionsführende Einrichtung
Fakultät für Maschinenwesen am 11.04.2017 angenommen.
„Aus der Kraft zu träumen, zu zweifeln und querzudenken erwachsen die Kreativität, die wissenschaftliche Potenz und der Erfindungsreichtum […]. Aber diese eher subjektive und nicht direkt messbare Gabe oder Leidenschaft für Innovationen wird [ab und zu] zugunsten der objektiv messbaren Umsetzung von Effizienz, Kontrolle und Verwaltung vernachlässigt.“
Stephan Grünewald
„Innovation hat so viele Barrieren zu durchbrechen, so viele Hürden zu überspringen und ein komplexes Gewusel von ‚unerwarteten‘ Problemen zu lösen, dass ein Innovator sehr viel Herzblut für
‚sein Baby‘ aufbringen muss, um die Last allein […] tragen zu können.“
Gunter Dueck
For my family
Abstract
This work deals with specific improvements and validation of the TRANSURANUS fuel performance code for the analysis of reactivity initiated accidents (RIA) as well as the development of a general coupling interface between TRANSURANUS and thermal hydraulics and/or reactor dynamics core analysis codes. TRANSURANUS is a best estimate fuel performance code which can be used for operational as well as accidental analysis.
Nuclear safety analysis has to demonstrate that the RIA safety criteria which limit the maximum fuel enthalpy increase, the maximum fuel temperature, and the departure from nucleate boiling (DNB) / the maximum clad surface temperature are ensured. Today’s safety analysis is based on reactor dynamics codes and thermal hydraulics codes containing simplified fuel behaviour models applying a set of conservative initial and boundary conditions. Subsequent calculations with a fuel performance code complete the safety analysis. The coupling with DYN3D enhances the level of confidence of accident analysis by simultaneous interaction of great degree in detail in fuel performance, thermal hydraulics and neutron kinetics modelling. It allows a more realistic modelling of transients in comparison with usual practise.
Because the RIA version of the fuel performance code TRANSURANUS is still under development it has to undergo additional evaluation. Thence its performance was evaluated thanks to participation in the OECD/NEA RIA Fuel Codes Benchmark for highly irradiated fuel rods (2011-2012). The TRANSURANUS results showed a (very) good agreement in comparison with other codes in terms of injected energy, variation of enthalpy, central fuel temperature, maximum fuel temperature and radial location of the maximum fuel temperature.
Nevertheless, the results also indicated that the code doesn’t comprise a fission gas behaviour model and cladding material properties capable for RIA conditions. Furthermore, the TRANSURANUS thermal hydraulics covers heat regimes observed before DNB only.
A part of the work was devoted to the improvement of the modelling of the Xe depletion in the high burnup structure (HBS) in TRANSURANUS to allow a more accurate RIA safety analysis. This work was performed during a research stay at JRC-ITU in Karlsruhe. It resulted in a properly described Xe depletion, which in turn will lead to a more precise modelling of the transient fission gas release during RIA. The influence of local burn-up and irradiation temperature on the Xe concentration were investigated using a multi-physics approach. The
temperature influence was modelled by means of the temperature dependent effective burn- up. Good agreement was found between the modelled temperature threshold for the effective burn-up (1049 ± 17 °C) and the experimental temperature threshold for distinguishing between un- and restructured fuel in the High Burnup Rim Project (HBRP), irradiated in the Halden reactor. The new model was integrated in the TRANSURANUS code.
Moreover, in this work the benefit and potential of replacing a simplified fuel behaviour model in reactor dynamics codes for the RIA analysis were analysed and demonstrated. The overall interaction between neutron kinetics, thermal hydraulics and detailed fuel behaviour modelling has been rarely analysed in the open literature so far. Thence a general TRANSURANUS coupling interface was developed to enable the coupling of the fuel performance code with thermal hydraulics system, sub-channel thermal hydraulics, CFD and reactor dynamics codes. A variety of features ensure the generality, e.g. the application at either fuel assembly or fuel rod level. As first application of this interface, the reactor dynamics code DYN3D was coupled at assembly level in order to describe the fuel behaviour in more detail. For the two-way coupling approach, TRANSURANUS replaces the call of the simplified DYN3D fuel behaviour model, and is part of the iteration process in each time-step in DYN3D. Results of the coupled code system are shown for two RIA scenarios in a PWR.
For a control rod ejection, it appeared that for all burn-up levels the two-way coupling approach systematically leads to higher maximum values of both the node fuel enthalpy (max.
difference of 46 J/g) and the node centreline fuel temperature (max. difference of 180.7 K), compared to DYN3D standalone best estimate calculations. The differences could be explained by the more detailed TRANSURANUS modelling of fuel thermal conductivity, radial power density profile and heat transfer in the gap. Since in this scenario no DNB occurred and the fuel enthalpy increases were relatively small, the impact of a great degree in online fuel behaviour modelling on the thermal hydraulics and neutron kinetics behaviour was very limited.
To analyse this feedback more precisely, a boron dilution transient with occurrence of DNB was determined based on boron concentrations from the Rossendorf Coolant Mixing (ROCOM) model facility. The results showed that the thermal hydraulics can already be strongly affected in fresh fuel assemblies, i.e. film boiling appeared in one node with the two- way coupling approach in spite of no film boiling appearing with the one-way coupling approach. For nodes with film boiling occurring in both coupling approaches, the two-way approach determined always higher peak values for both the node average fuel enthalpy and
the node clad surface temperature. Therefore, the coupled code system can potentially improve the assessment of safety criteria, at a reasonable computational cost.
Keywords: Nuclear fuel; reactor safety analysis; RIA; OECD RIA Fuel Codes Benchmark;
fuel performance modelling; high burn-up structure; Xe depletion; general TRANSURANUS coupling interface; code coupling; DYN3D-TRANSURANUS; control rod ejection; boron dilution transient.
Contents
List of Figures i
List of Tables vii
List of Abbreviations ix
Nomenclature xii
Latin variables ... xii
Greek variables ... xiv
1 Introduction 1 1.1 Background ... 1
1.2 Research objectives and stages ... 6
1.3 Thesis outline ... 9
1.4 Verification and validation... 10
2 Literature review 12 2.1 Characteristics of the high burnup structure (HBS) ... 12
2.2 Fuel rod behaviour and cladding failure during RIA ... 14
2.2.1 Early phase during RIA (Pre-DNB) ... 15
2.2.2 Late phase during RIA (Post-DNB) ... 16
2.3 State-of-the-art modelling in fuel performance codes for RIA ... 19
2.3.1 Range of application ... 20
2.3.2 Geometrical representation ... 21
2.3.3 Clad tube representation ... 24
2.3.4 Pellet-clad contact modelling ... 25
2.3.5 Ongoing model developments regarding TRANSURANUS ... 26
2.4 State-of-the-art modelling of fuel behaviour in RIA licensing calculations ... 28
2.4.1 Overview about traditional licensing approach ... 28
2.4.2 General features of the reactor dynamics code DYN3D ... 31
2.4.3 Fuel behaviour modelling in the reactor dynamics code DYN3D ... 32
2.5 Trend toward coupled code systems with detailed fuel behaviour modelling ... 35
3 OECD RIA Fuel Codes Benchmark for highly irradiated fuel rods 39
3.1 Experimental data ... 39
3.2 Generation of TRANSURANUS inputs ... 43
3.2.1 Pre-irradiation in power reactor ... 44
3.2.2 Refabrication in hot cells and RIA transient in research reactor ... 48
3.3 Analysis of TRANSURANUS results ... 51
3.3.1 Spectrum of fuel performance codes ... 51
3.3.2 Use of input data (comparison to other fuel performance codes) ... 52
3.3.3 Thermal behaviour (comparison to other fuel performance codes) ... 54
3.3.4 Mechanical behaviour (comparison to other fuel performance codes) ... 58
3.4 Summary and recommendations for future work ... 64
4 Improved modelling of high burnup structure in the TRANSURANUS code 66 4.1 Experimental data of high burn-up fuel (High Burnup Rim Project) ... 67
4.2 Temperature dependent modelling of the Xe depletion ... 69
4.2.1 New standalone Xe depletion model ... 69
4.2.2 Implementation of the Xe depletion model in TRANSURANUS ... 71
4.3 Results of the sensitivity analysis ... 72
4.3.1 Impact of threshold burn-up ... 72
4.3.2 Impact of threshold temperature ... 74
4.3.3 Impact of Xe yield ... 75
4.4 Summary and recommendations for future work ... 76
5 Development of the general TRANSURANUS coupling interface 78 5.1 Main features ... 79
5.1.1 One-way and two-way coupling ... 79
5.1.2 Flexibility in time-step length and numerical stability ... 80
5.1.3 Freely selectable level of detail in fuel behaviour modelling ... 80
5.1.4 Pre- and post-calculations with TRANSURANUS standalone ... 81
5.1.5 Automatic switch from steady-state to transient conditions ... 81
5.1.6 Parallelization ... 81
5.1.7 Further features ... 82
5.2 Applicability for various scenarios ... 83
5.3 General guidelines for applications ... 84
5.3.1 TRANSURANUS input ... 84
5.3.2 Modifications in the code coupled to TRANSURANUS ... 85
5.3.3 Maintenance of the code system ... 88
5.4 Summary and recommendations for future work ... 89
6 Application of the new code system DYN3D-TRANSURANUS for RIA 91 6.1 Description of the new code system DYN3D-TRANSURANUS ... 91
6.2 Variants of the code system differing in detail of fuel behaviour modelling ... 95
6.3 Specification of simulated RIA scenarios for German PWR ... 96
6.3.1 Control rod ejection ... 97
6.3.2 Boron dilution transient ... 98
6.4 Results and discussion ... 99
6.4.1 Pre-calculations for critical boron concentration ... 99
6.4.2 Comparison of DYN3D standalone and two-way coupling approach ... 100
6.4.2.1 Analysis of differences in global and local parameters ... 100
6.4.2.2 Impact of fuel thermal conductivity ... 105
6.4.2.3 Impact of power density profile ... 107
6.4.2.4 Impact of heat transfer in gap ... 108
6.4.2.5 Impact of all three factors ... 110
6.4.3 Comparison of one-way and two-way coupling approach ... 110
6.4.3.1 Analysis of differences in feedback on neutron kinetics ... 110
6.4.3.2 Analysis of differences in feedback on thermal hydraulics ... 115
6.5 Computational costs ... 123
6.6 Outlook on DYN3D-TRANSURANUS ... 125
6.7 Summary and recommendations for future work ... 126
7 Summary and conclusion 128
8 Bibliography 132
Acknowledgements 145
Publications 149
i
List of Figures
Figure 1: Most thresholds are within the upper shaded area. The two lower shaded zones represent the envelope of conservative calculations for actual PWR cores. As seen, the core enthalpy can exceed the lower failure thresholds – i.e. for cases with large oxidation and brittle cladding. [23] ... 5 Figure 2: Simplified flow structure of research objectives and stages (*due to participation
in the OECD RIA Fuel Codes Benchmark in 2011/2012) ... 6 Figure 3: SEM images of the high burnup structure (HBS). Left, subdivided grains due to
restructuring; right, view in a HBS pore surrounded by subdivided grains [33] 12 Figure 4: Possible mechanisms for fuel and cladding damage under RIA [45] ... 15 Figure 5: PCMI failure mode observed in the NSRR test VA-1 (PWR, 71 MWd/kgU,
cladding ZIRLO™) [47] ... 16 Figure 6: Boiling crisis mechanism in stationary and transient conditions (based on visual
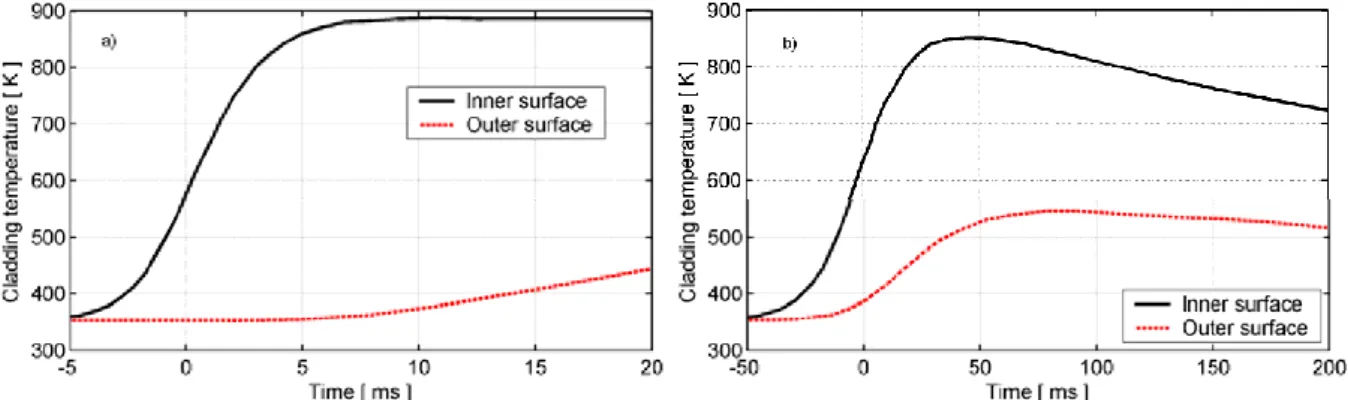
observation in NSRR tests performed under subcooled pool boiling conditions) [54] ... 19 Figure 7: Clad inner and outer temperatures calculated by the Japanese fuel performance
code RANNS for the NSRR RIA test FK-10 (peak power at 0 s). Left, experimental pulse width of 5.2 ms; right, larger pulse of 40 ms. [3, 70] ... 24 Figure 8: External (a) and internal (b) coupling methodology according to neutron
kinetics/reactor dynamics code and thermal hydraulics system code in core wide analysis (red arrows denote data exchange) [3] ... 36 Figure 9: Stages of the fuel rod in a complex irradiation experiment compared to its
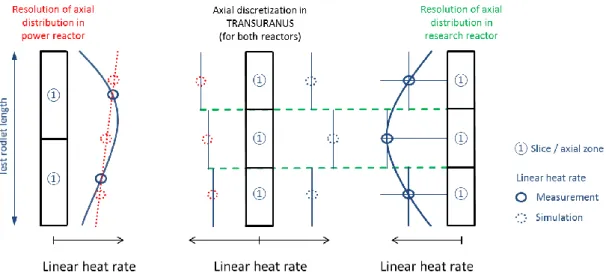
simulation in TRANSURANUS (individual figures taken from [125]) ... 43 Figure 10: First methodology to combine different axial resolutions/discretisations in power
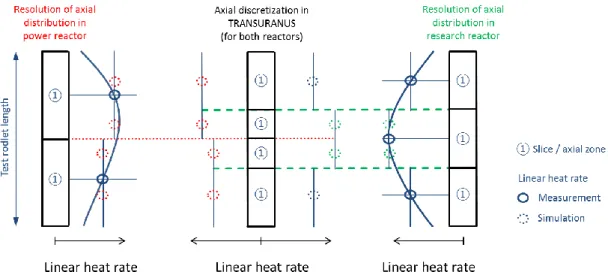
reactors and research reactors (example on linear heat rate with resolution of two locations in power reactor and three locations in research reactor) ... 46 Figure 11: Second methodology to combine different axial resolutions/discretisations in
power reactors and research reactors (example on linear heat rate with resolution of two locations in power reactor and three locations in research reactor) ... 47
ii
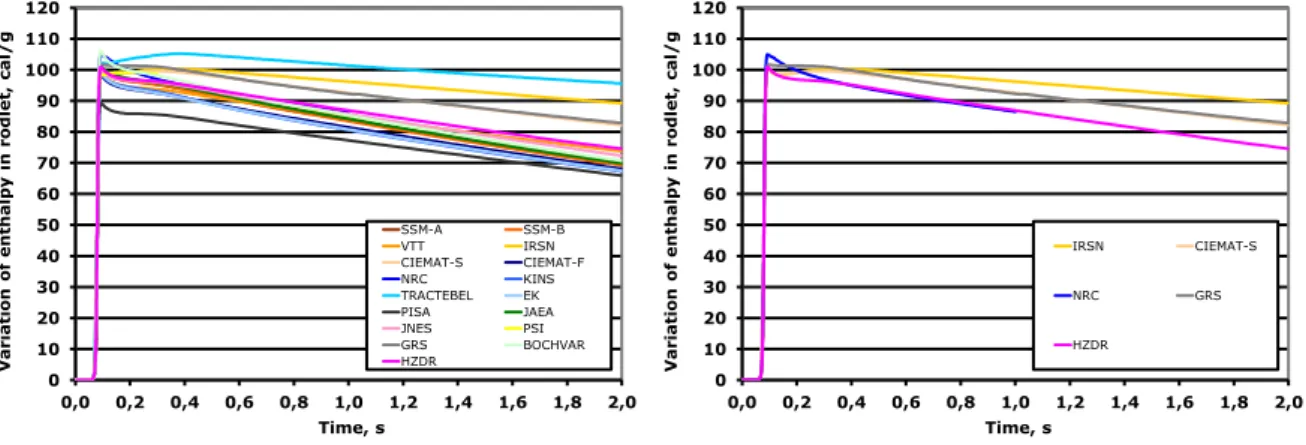
Figure 12: Node linear heat rate over time (benchmark case #1). Left, during pre-irradiation in the power reactor [25]; right, during RIA test CIP0-1 in the research reactor CABRI (extracted from TRANSURANUS (HZDR) results). ... 50 Figure 13: Energy deposited over time in the whole rodlet (benchmark case #1) [25] ... 53 Figure 14: Gap width over time at peak power node (benchmark case #3) [25] ... 54 Figure 15: Variation of enthalpy over time in the whole rodlet with respect to initial
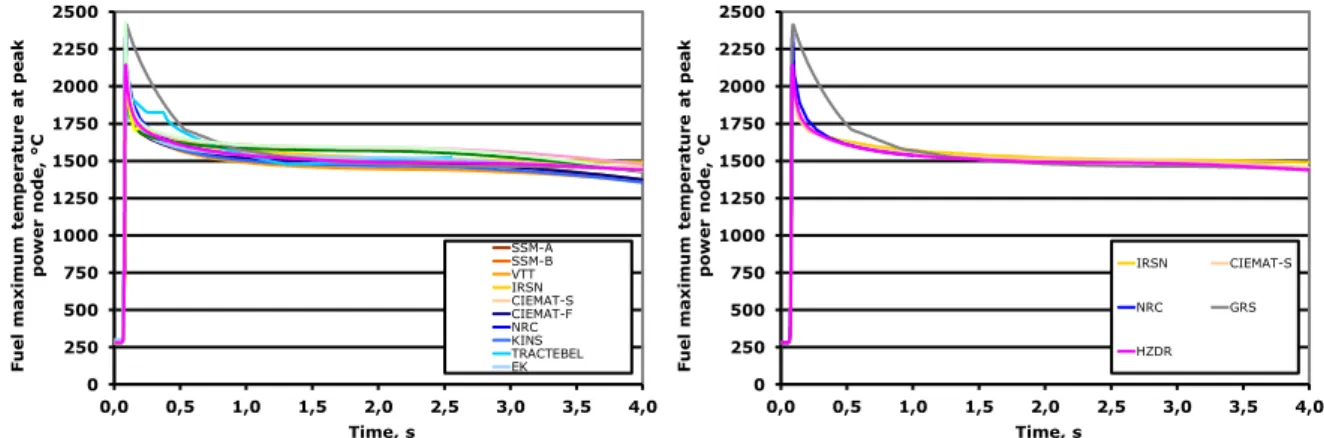
conditions of the transient (benchmark case #3). Left, results provided by all participants of the benchmark; right, selected results from the left side. [25] .... 55 Figure 16: Fuel maximum temperature over time at peak power node (benchmark case #3).
Left, results provided by all participants of the benchmark; right, selected results from the left side. [25] ... 56 Figure 17: Radial location of the maximum of the fuel temperature over time at peak power
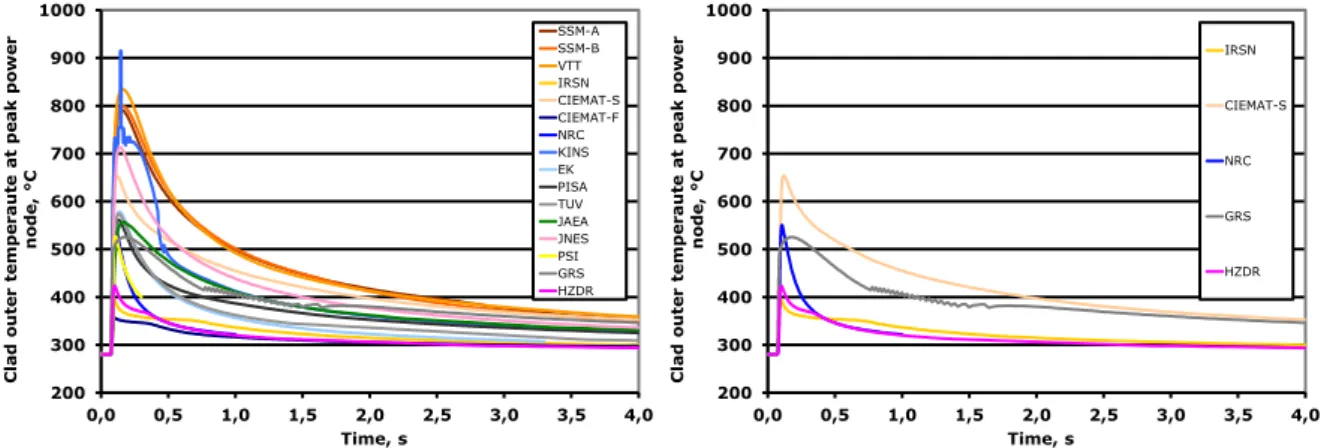
node defined as distance from the centre of the pellet (benchmark case #3). Left, results provided by all participants of the benchmark; right, selected results from the left side. [25] ... 57 Figure 18: Clad outer temperature over time at peak power node (benchmark case #2). Left,
results provided by all participants of the benchmark; right, selected results from the left side. [25] ... 58 Figure 19: Outer fuel radius over time at peak power node (benchmark case #3). Left,
results provided by all participants of the benchmark; right, selected results from the left side. [25] ... 60 Figure 20: Inner clad radius over time at peak power node (benchmark case #3). Left,
results provided by all participants of the benchmark; right, selected results from the left side. [25] ... 60 Figure 21: Outer clad permanent hoop strain at the end of the transient as a function of
height with respect to the bottom of fissile column (benchmark case #1). Left, experimental data and results provided by all participants of the benchmark;
right, experimental data and selected results from the left side. [25] ... 62
iii
Figure 22: Outer clad permanent hoop strain at the end of the transient as a function of height with respect to the bottom of fissile column (benchmark case #2). Left, results provided by all participants of the benchmark; right, selected results from the left side. [25] ... 63 Figure 23: Total axial clad elongation containing thermal, elastic and plastic components
with respect to cold state conditions over time (benchmark case #1). Left, experimental data and results provided by all participants of the benchmark;
right, experimental data and selected results from the left side. [25] ... 64 Figure 24: Burn-up and average irradiation temperature of the 16 stacks of HBRP. The
extremes represent the temperature difference between the surface and the centre of the discs, obtained by a finite element calculation [142] ... 68 Figure 25: Comparison between predicted and measured local xenon concentrations as a
function of the local burn-up for data from HBRP. The prediction is based on the depletion model in Ref. [27] with the threshold burn-up varied between 40 and 70 GWd/tU in steps of 10 GWd/tU. Rod numbering corresponds to the numbering in Figure 24. ... 73 Figure 26: Main principle of the general TRANSURANUS coupling interface, whereas one
fuel rod is calculated per call of the interface. ... 78 Figure 27: Local restructuring of DYN3D to allow determination of the whole fuel rod
behaviour at once (i: count variable; n: total number of axial nodes in the coolant channel). Left, previous local DYN3D code structure; right, new local DYN3D code structure after restructuring. ... 87 Figure 28: Coupling approaches with the reactor dynamics code DYN3D ... 92 Figure 29: Data transfer between DYN3D and TRANSURANUS via the general
TRANSURANUS coupling interface for one-way coupling (prospective in combination with the thermal hydraulics system code ATHLET) [10]. As shown, a later planned extension to DYN3D-ATHLET-TRANSURANUS was already taken into account, e.g. applicable to ATWS in the future (Gin: coolant mass flow density at the core inlet; Gout: coolant mass flow density at the core outlet; hin: coolant specific enthalpy at the core inlet; hout: coolant specific enthalpy at the core outlet; pin: coolant pressure at the core inlet; pout: coolant pressure at the core outlet). ... 94
iv
Figure 30: Data transfer between DYN3D and TRANSURANUS via the general TRANSURANUS coupling interface for two-way coupling (prospective in combination with the thermal hydraulics system code ATHLET) [10]. As shown, a later planned extension to DYN3D-ATHLET-TRANSURANUS was already taken into account, e.g. applicable to ATWS in the future (Gin: coolant mass flow density at the core inlet; Gout: coolant mass flow density at the core outlet; hin: coolant specific enthalpy at the core inlet; hout: coolant specific enthalpy at the core outlet; pin: coolant pressure at the core inlet; pout: coolant pressure at the core outlet). ... 94 Figure 31: Total nuclear power over time (left) and global average fuel temperature over
time (right) for CR ejection at 30% of nominal reactor power. ... 101 Figure 32: Maximum assembly-average fuel enthalpy increase Δh calculated by DYN3D- TRANSURANUS for CR ejection at 30% of nominal reactor power (bordered fuel assembly represents the location of the ejected CR) ... 102 Figure 33: For CR ejection with no onset of DNB, relative difference Δ(Δh)rel in maximum
assembly-average fuel enthalpy increase Δh between DYN3D and DYN3D- TRANSURANUS at 30% of nominal reactor power (> 0%: value of DYN3D is larger; < 0%: value of DYN3D is lower; bordered fuel assembly represents the location of the ejected CR) ... 102 Figure 34: Node-wise differences in maximum centreline fuel temperature over node burn- up for CR ejection without DNB. Differences are defined as two-way coupling approach DYN3D-TRANSURANUS (realistic) minus DYN3D. Left, at 30 % of nominal reactor power; right, at HZP conditions. ... 104 Figure 35: Node-wise differences in maximum centreline fuel temperature over node burn- up for CR ejection at 30% of nominal reactor power for (a) variant I with identical fuel thermal conductivity, (b) variant II with identical power density profile, (c) variant III with identical heat transfer coefficient in gap, and (d) variant IV as combination of (a), (b) and (c). Left, difference defined as two-way coupling approach DYN3D-TRANSURANUS (variant I, II, III or IV) minus DYN3D (standalone); right, differences defined as two-way coupling approach DYN3D-TRANSURANUS (variant I, II, III or IV) minus DYN3D- TRANSURANUS (realistic). ... 106
v
Figure 36: Heat transfer coefficient (HTC) in gap as function of (a) node linear heat rate and (b) node average fuel enthalpy. Left, two-way coupling approach of DYN3D- TRANSURANUS (realistic) for CR ejection with no onset of DNB initiated at 30 % of nominal reactor power (slice with maximum linear heat rate of the fuel assembly containing the ejected CR, cf. Figure 32); right, TRANSURANUS standalone for CR ejection case #3 of OECD RIA Fuel Codes Benchmark with onset of DNB [24] (slice in the middle of the test rodlet). ... 109 Figure 37: Total reactivity vs. time (a), total nuclear power zoomed in for showing
differences vs. time (b) and global average fuel temperature vs. time (c) [values of the 1-way approach taken from the DYN3D part in the coupled code system]
... 111 Figure 38: Node average injected energy vs. time. (a) For the node at the bottom of the fresh
fuel assembly B6 (left) and for the 2nd lowest node of the same assembly (right).
(b) For the node at the bottom of fuel assembly D5 with average assembly burn- up of 31.7 MWd/kgHM (left) and for the node at the bottom of fuel assembly E6 with average assembly burn-up of 50.0 MWd/kgHM (right). ... 113 Figure 39: Maximum assembly-average fuel enthalpy increase Δh calculated by DYN3D- TRANSURANUS (two-way approach) [bordered fuel assembly contains the stuck CR] ... 114 Figure 40: (a) Node-wise differences in maximum average fuel enthalpy as a function of the
node burn-up. Differences are defined as the result of the two-way coupling approach minus the corresponding result of the one-way coupling approach of DYN3D-TRANSURANUS. (b) Maximum node average fuel enthalpy calculated by the two-way coupling approach versus the corresponding value of the one- way coupling approach. The ratio between the CHF and the actual heat flux, at which DNB is assumed, amounted to 1.0 (best estimate value) on the left and to 2.0 (conservative value) on the right. ... 116 Figure 41: Node average fuel enthalpy vs. time. (a) For the node at the bottom of the fresh
fuel assembly B6 (left) and for the 2nd lowest node of the same assembly (right).
(b) For the node at the bottom of fuel assembly D5 with average assembly burn- up of 31.7 MWd/kgHM (left) and for the node at the bottom of fuel assembly E6 with average assembly burn-up of 50.0 MWd/kgHM (right). ... 117
vi
Figure 42: (a) Node-wise differences in maximum clad surface temperature as a function of the node burn-up. Differences are defined as the result of the two-way coupling approach minus the corresponding result of the one-way coupling approach of DYN3D-TRANSURANUS. (b) Maximum node clad surface temperature calculated by the two-way coupling approach versus the corresponding value of the one-way coupling approach. The ratio between the CHF and the actual heat flux, at which DNB is assumed, amounted to 1.0 (best estimate value) on the left and to 2.0 (conservative value) on the right. ... 120 Figure 43: Node clad surface temperature vs. time. (a) For the node at the bottom of the
fresh fuel assembly B6 (left) and for the 2nd lowest node of the same assembly (right). (b) For the node at the bottom of fuel assembly D5 with average assembly burn-up of 31.7 MWd/kgHM (left) and for the node at the bottom of fuel assembly E6 with average assembly burn-up of 50.0 MWd/kgHM (right).
... 121 Figure 44: Node heat transfer coefficient (HTC) in the gap vs. time. (a) For the node at the
bottom of the fresh fuel assembly B6 (left) and for the 2nd lowest node of the same assembly (right). (b) For the node at the bottom of fuel assembly D5 with average assembly burn-up of 31.7 MWd/kgHM (left) and for the node at the bottom of fuel assembly E6 with average assembly burn-up of 50.0 MWd/kgHM (right). ... 123
vii
List of Tables
Table 1 – Potential reactivity initiated scenarios in BWR and PWR (taken from [4] and extended by information in [3]) ... 3 Table 2 – Values of critical heat flux, critical surface temperature and film-boiling heat
flux measured in PATRICIA tests under steady-state conditions and RIA-like transients [3, 51, 55] ... 18 Table 3 – (Transient) fuel performance codes applicable to RIA taken from Ref. [3] ... 20 Table 4 – Features of the simplified fuel behaviour model in DYN3D [94] compared to the
fuel performance codes TESPAROD [95-97] and TRANSURANUS [60]
(according to RIA) ... 34 Table 5 – Cases of the OECD RIA Fuel Codes Benchmark [24] ... 41 Table 6 – Main characteristics of the CABRI tests determined in the OECD RIA Fuel
Codes Benchmark [24] ... 42 Table 7 – Thermal hydraulics conditions in power reactor vs. research reactor (CIP0-1)
[25] ... 44 Table 8 – Codes applied by participants in OECD RIA Fuel Codes Benchmark [24] ... 52 Table 9 – States of stress relevant to the mechanical testing for RIA (assuming isotropic
plasticity) [13] ... 61 Table 10 – Burn-up and calculated temperature at end of life (EOL) reached for the 16
stacks [142] ... 68 Table 11 – Values of the merit function 𝜒2 for temperature values given in Ref. [140] ... 74 Table 12 – Values of the fitted parameters 𝑏𝑢𝑒𝑓𝑓0 and 𝑇𝑡ℎ𝑟𝑒𝑠 with 68% confidence intervals.
... 75 Table 13 – Values of the fitted parameters 𝑏𝑢𝑒𝑓𝑓0 and 𝑇𝑡ℎ𝑟𝑒𝑠 with their standard errors
(dependence on Xe creation rate). ... 76 Table 14 – Critical boron concentration of the initial reactor state for CR ejection transient ... 100 Table 15 – Relative difference Δ(Δh)rel in maximum assembly-average fuel enthalpy
increase Δh in relation to the fuel assembly burn-up for CR ejection transient 103
viii
Table 16 – Differences in maximum values of the node centreline fuel temperature for CR ejection transient (defined as DYN3D-TRANSURANUS minus DYN3D standalone) ... 104 Table 17 – Maximum node average fuel enthalpy for nodes with film boiling (simulation
with increased ratio between CHF and actual heat flux) ... 119 Table 18 – Maximum node clad surface temperature for nodes with film boiling (simulation
with increased ratio between CHF and actual heat flux) ... 122 Table 19 – Overview of computation times without parallelization [159] ... 124
ix
List of Abbreviations
AOO Anticipated Operational Occurrence
ASTRID Advanced Sodium Technological Reactor for Industrial Demonstration
ATWS Anticipated Transient Without Scram
BIGR Bystry Impulsny Graphitovy Reaktor, Russia
BOC Begin Of Cycle
BOCHVAR Joint Stock Company “A.A. Bochvar High-technology Research Institute of Inorganic Materials” (JSC “VNIINM”), Russia
BWR Boiling Water Reactor
CABRI reactor Research reactor in Cadarache, France
CEA Commissariat à l’énergie atomique et aux énergies alternatives, France
CFD Computational Fluid Dynamics
CHF Critical Heat Flux
CIEMAT Centro de Investigaciones Energéticas, Medioambientales y Tecnológicas, Spain
CPU Central Processing Unit
CR Control Rod
CRIEPI Central Research Institute of Electric Power Industry, Japan
CS Control System
CZP Cold Zero Power
DBA Design Basis Accident
DiD Defence In Depth concept
DNB Departure from Nucleate Boiling
EAC-2 European Accident Code (improved version 2)
EDF Electricité de France
EOC End Of Cycle
EOL End Of Life
EPMA Electron Probe Microanalysis
EPRI Electric Power Research Institute, United States
FR Fast Reactor
FUMAC FUel Modelling in Accident Conditions (ongoing IAEA benchmark) FUMEX FUel Modelling at EXtended burnup (IAEA benchmark with three
phases)
FWHM Full Width at Half Maximum
x
Gen-IV GENeration IV reactors (next generation nuclear energy systems) GRS Gesellschaft für Anlagen- und Reaktorsicherheit, Germany
HBRP High Burnup Rim Project
HBS High Burnup Structure
HFP Hot Full Power
HRP OECD Halden Reactor Project, Norway
HTC Heat Transfer Coefficient
HWR Heavy Water Reactor
HZDR Helmholtz-Zentrum Dresden-Rossendorf e.V., Germany
HZP Hot Zero Power
IAEA International Atomic Energy Agency, Austria IFE Institute for Energy Technology, Norway
IFPE International Fuel Performance Experiments database (OECD/NEA) IGR Impulsny Graphitovy Reaktor, Russia
INL Idaho National Laboratory, United States
IRSN Institut de Radioprotection et de Sûreté Nucléaire, France
JAEA Japan Atomic Energy Agency
JNES Japan Nuclear Energy Safety organization
JRC-ITU European Commission, Joint Research Centre, Institute for Transuranium Elements, Germany
KINS Korea Institute of Nuclear Safety
KIT Karlsruhe Institute of Technology, Germany
Konvoi Design of the last three constructed PWRs in Germany (Siemens) LMFBR Liquid Metal Fast Breeder Reactor
LOCA Loss Of Coolant Accident
LWR Light Water Reactor
MOC Mid Of Cycle
MOOSE INL Multiphysics Object Oriented Simulation Environment
MOX Mixed OXide fuel
MTA EK Nuclear Security Department of the Hungarian Academy of Sciences, Centre for Energy Research
MYRRHA Multi-purpose hYbrid Research Reactor for High-tech Applications
NEA Nuclear Energy Agency of OECD
NFIR Nuclear Fuel Industry Research program NRC Nuclear Regulatory Commission, United States NRI Nuclear Research Institute Řež plc, Czech Republic
xi
NSRR Nuclear Safety Research Reactor, Japan
NURESIM European platform for Nuclear Reactor Simulator NURISP NUclear Reactor Integrated Simulation Project
OECD Organisation for Economic Co-operation and Development
PCI Pellet Clad Interaction
PCMI Pellet Cladding Mechanical Interaction
PIE Post Irradiation Examination
PNNL Pacific Northwest National Laboratory, United States PSI Paul Scherrer Institut, Switzerland
PWR Pressurized Water Reactor
RDA Reactivity control rod/blade Drop Accident (BWR) REA Reactivity control rod Ejection Accident (PWR) RIA Reactivity Initiated Accident
ROCOM ROssendorf COolant Mixing model (test facility) SAPR Semi-Analytical Perturbation Reconstruction model
SEM Scanning Electron Microscopy
SGTR Steam Generator Tube Rupture
SIMS Secondary Ion Mass Spectrometry
SSM Strål säkerhets myndigheten (Swedish Radiation Safety Authority) TEM Transmission Electron Microscopy
TEPCO Tokyo Electric Power Company Holdings, Inc., Japan TRACTEBEL Tractebel Engineering S.A. (ENGIE Group), Belgium
TÜV NORD Technischer Überwachungsverein NORD EnSys Hannover GmbH &
Co. KG, Germany UNIPI Università di Pisa, Italy
VTT Technical Research Centre of Finland
VVER Vodo-Vodyanoy Energetichesky Reaktor (Russian PWR)
WGFS OECD/NEA Working Group on Fuel Safety
xii
Nomenclature
Latin variables
𝒂 Fitting constant for thermal conductivity (𝑚𝐾
𝑊) 𝒂 Fitting constant in the Xe rate equation (𝑀𝑊𝑑𝑘𝑔𝑈)
𝒂 Summarizing all fitted parameters of the correlation 𝑦(𝑥𝑘, 𝑎) 𝒂𝟏 Fitting constant for thermal conductivity (𝑚 𝑘𝑔𝑈 𝐾
𝑀𝑊𝑑 𝑊) 𝒂𝟐 Fitting constant for thermal conductivity (𝑊 𝑤𝑡%𝑚𝐾 ) 𝒃 Fitting constant for thermal conductivity (𝑚
𝑊) 𝒃𝟏 Fitting constant for thermal conductivity (𝑚 𝑘𝑔𝑈
𝑀𝑊𝑑 𝑊) 𝒃𝟐 Fitting constant for thermal conductivity (𝑊 𝑤𝑡%𝑚 ) 𝒃𝒖 Local burn-up (𝑀𝑊𝑑
𝑘𝑔𝑈)
∆𝒃𝒖 Increment of local burn-up (𝑀𝑊𝑑
𝑘𝑔𝑈)
𝒃𝒖𝟎 Local threshold burn-up for onset of Xenon depletion (𝑀𝑊𝑑
𝑘𝑔𝑈) 𝒃𝒖𝒆𝒇𝒇 Local effective burn-up (𝑀𝑊𝑑
𝑘𝑔𝑈)
∆𝒃𝒖𝒆𝒇𝒇 Increment of local effective burn-up (𝑀𝑊𝑑
𝑘𝑔𝑈) 𝒃𝒖𝒆𝒇𝒇𝟎 Reference value of local effective burn-up (𝑀𝑊𝑑
𝑘𝑔𝑈) 𝒄 Specific heat capacity ( 𝐽
𝑘𝑔𝐾)
𝒄 Fitting constant for thermal conductivity (𝑊𝐾
𝑚) 𝒄̇𝑿𝒆 Xenon creation rate (𝑤𝑡%∗𝑘𝑔𝑈𝑀𝑊𝑑 )
𝒅 Fitting constant for thermal conductivity (𝐾) [𝑫] Tensor of the elastic constants (𝑚2𝑠𝑁 )
𝒇(𝑻) Factor specifying the temperature influence in the range of defect healing (−) 𝑭𝒍 Friction forces (𝑁)
𝑮𝒊𝒏 Coolant mass flow density at the core inlet (𝑚2𝑠𝑘𝑔) 𝑮𝒐𝒖𝒕 Coolant mass flow density at the core outlet (𝑚2𝑠𝑘𝑔) 𝑮𝒅 Local gadolinium concentration (𝑤𝑡%)
𝒉 Assembly-average specific fuel enthalpy (𝐽 𝑔)
xiii
∆𝒉 Maximum assembly-average specific fuel enthalpy increase (𝐽 𝑔) 𝒉𝒊𝒏 Specific enthalpy of the coolant at the core inlet (𝑘𝑔𝑘𝐽)
𝒉𝒐𝒖𝒕 Specific enthalpy of the coolant at the core outlet (𝑘𝑔𝑘𝐽) 𝒌 Counter variable referring to 𝑥𝑘 and 𝑦𝑘 (−)
𝒌𝒅 Factor taking into account the effects of the initial fuel structure (−) 𝑳𝑯𝑹 Linear rod power or rather linear heat rate (𝑊
𝑚𝑚) 𝑵 Number of data points referring to 𝑥𝑘 and 𝑦𝑘 (−) 𝒑𝒄𝒐𝒐𝒍 Coolant pressure (𝑀𝑃𝑎)
𝒑𝒊𝒏 Coolant pressure at the core inlet (𝑀𝑃𝑎) 𝒑𝒐𝒖𝒕 Coolant pressure at the core outlet (𝑀𝑃𝑎) 𝑷 Local porosity (−)
𝒒′′′ Power density (𝑊
𝑚3)
𝒓 Radius (𝑚)
𝒓𝒓𝒆𝒇 Radius of reference radius (𝑚) 𝑹 Radius of deformed geometry (𝑚) 𝜹𝑹𝒄𝒍𝒂𝒅 Total change in clad radius (𝑚) 𝜹𝑹𝒇𝒖𝒆𝒍 Total change in fuel radius (𝑚)
𝜹𝑹𝒄𝒍𝒂𝒅,𝒆𝒍 Total change in clad radius due to elastic deformation (𝑚) 𝜹𝑹𝒇𝒖𝒆𝒍,𝒆𝒍 Total change in fuel radius due to elastic deformation (𝑚) 𝜹𝑹𝒄𝒍𝒂𝒅,𝒑𝒍 Total change in clad radius due to plastic deformation (𝑚) 𝜹𝑹𝒄𝒍𝒂𝒅,𝒕𝒉 Total change in clad radius due to linear thermal expansion (𝑚) 𝜹𝑹𝒇𝒖𝒆𝒍,𝒕𝒉 Total change in fuel radius due to linear thermal expansion (𝑚)
𝒕 Time (𝑠)
∆𝒕 Time step length (ℎ)
𝑻 Temperature (𝐾)
𝑻 Local fuel temperature for effective burn-up (°𝐶) 𝑻𝟏 Onset-temperature for partial healing in the fuel (°𝐶)
𝑻𝟐 Temperature limit for complete healing of defects in the fuel (°𝐶) 𝑻𝒄𝒍𝒂𝒅,𝒔𝒇 Clad surface temperature (°𝐶)
𝑻𝒄𝒐𝒐𝒍 Coolant temperature (°𝐶) 𝑻𝒇𝒖𝒆𝒍 Fuel temperature (𝐾)1 𝑻𝒎𝒐𝒅 Moderator temperature (𝐾)
1 Unit °C in the section 6.1
xiv 𝑻𝒑 Absolute temperature (𝐾)
𝑻𝒕𝒉𝒓𝒆𝒔 Temperature threshold for effective burn-up (°𝐶) 𝒖 Radial deformation (𝑚)
𝑿𝒆 Local xenon concentration (𝑤𝑡%) 𝒙𝒌 Data point with index 𝑘
𝒚(𝒙𝒌, 𝒂) Correlation fitted iteratively by minimization of 𝜒2(𝑎) 𝒚𝒌 Data point with index 𝑘
Greek variables
𝜶𝒄𝒍𝒂𝒅,𝒔𝒇 Heat transfer coefficient between clad to coolant ( 𝑊
𝑚𝑚2𝐾) 𝜺𝟏 Axial strain (−)
𝜺𝟐 Hoop strain (−)
𝜺𝒂 Axial strain component (−) 𝜺𝒓 Radial strain component (– )
𝜺𝒔 Volumetric ratio of the restructured fuel domain (−) 𝜺𝒕 Tangential strain component (−)
{𝜺𝒄𝒓} Vector of creep strain as component of inelastic strain (−) {𝜺𝒆𝒍} Vector of elastic strain (−)
𝜺𝒂𝒆𝒍 Axial component of elastic strain (−) 𝜺𝒓𝒆𝒍 Radial component of elastic strain (−) 𝜺𝒕𝒆𝒍 Tangential component of elastic strain (−) {𝜺𝒆𝒙} Vector of sum of inelastic strains (−)
{𝜺𝒇} Vector of crack strain as component of inelastic strain (−)
{𝜺𝒑𝒍} Vector of instantaneous plastic strain as component of inelastic strain (−) {𝜺𝒔} Vector of solid & gaseous swelling strain as component of inelastic strain (−) {𝜺𝒔𝒊𝒏} Vector of hot-pressing strain as component of inelastic strain (−)
{𝜺𝒕𝒉} Vector of thermal strain as component of inelastic strain (−) {𝜺𝒕𝒐𝒕} Vector of total strain (−)
𝜺𝒂𝒕𝒐𝒕 Axial component of total strain (−) 𝜺𝒓𝒕𝒐𝒕 Radial component of total strain (−) 𝜺𝒕𝒕𝒐𝒕 Tangential component of total strain (−) 𝝀 Thermal conductivity (𝑚𝐾𝑊)
xv 𝝀𝒇𝒖𝒆𝒍 Fuel thermal conductivity (𝑚𝐾𝑊) 𝝆 Density (𝑚3𝑘𝑔)
𝝆 Reactivity (−)
𝝆𝒄𝒔 Reactivity component due to control system (−) {𝝈} Vector of stress (𝑚𝑚2𝑁 )
𝝈𝒂 Axial stress component (𝑚𝑚2𝑁 )
𝝈𝒌 Experimental uncertainty of 𝑦𝑘 (e.g. standard deviation) 𝝈𝒓 Radial stress component (𝑚𝑚2𝑁 )
𝝈𝒔𝒕𝒂𝒏𝒅 Error band of each fitted parameter related to a 68% confidence interval 𝝈𝒕 Tangential stress component (𝑚𝑚2𝑁 )
𝝓𝒎𝒐𝒅 Void volume fraction of the moderator (−)
𝝌𝟐(𝒂) Merit function with 𝑎 summarising all fitted parameters of the correlation 𝑦(𝑥𝑘, 𝑎) (−)
1
1 Introduction
1.1 Background
The public has to be protected against civilization related radiation exposure occurring additionally beside the natural one, e.g. from medical devices, from nuclear power plants and in airplanes. For nuclear power plants the defence in depth (DiD) concept should ensure this [1]. This concept “consists of a hierarchical deployment of different levels of equipment and procedures in order to maintain the effectiveness of physical barriers placed between radioactive material and workers, the public or the environment, during normal operation, anticipated operational occurrences (AOOs) and, for some barriers, accidents at the plant.” [2]
For example, level 1 refers to normal operation, level 2 to abnormal operation, and level 3 to design basis accidents (DBA) like loss of coolant accident (LOCA) and reactivity initiated accident (RIA).
The operational reactor control system and the safety protection systems must ensure either no radiological impact in the level 1 and level 2 or no radiological impact outside the exclusion area in the level 3 of the DiD concept [1]. Due to the impossibility to consider in each safety analysis the full chain of causation from the release of fission products located in the fuel pellets up to the determination of the radiological doses of a person in the power plant’s environment advanced surrogate criteria were defined. Their compliance has to be guaranteed by the licensee for the operation of its nuclear power plant. These criteria also allow a direct comparison to results of neutron kinetics codes, thermal hydraulic system codes and fuel performance codes. For RIA core coolability/integrity of fuel rods and reactivity control represent the main advanced surrogate criteria. The total change of the reactivity rate 𝜌̇ is defined as following [3]:
𝜌̇ = 𝜌𝑐𝑠̇ + 𝜕𝜌
𝜕𝑇𝑓𝑢𝑒𝑙𝑇𝑓𝑢𝑒𝑙̇ + 𝜕𝜌
𝜕𝑇𝑚𝑜𝑑𝑇𝑚𝑜𝑑̇ + 𝜕𝜌
𝜕𝜙𝑚𝑜𝑑𝜙𝑚𝑜𝑑̇ (1) where 𝜌 is the reactivity, its component 𝜌𝑐𝑠 symbolizes the reactivity due to the control system (CS) and its actuating variables, 𝑇𝑓𝑢𝑒𝑙 presents the fuel temperature in 𝐾, 𝑇𝑚𝑜𝑑 the moderator temperature in 𝐾, and 𝜙𝑚𝑜𝑑 the void volume fraction of the moderator. The rates of change are marked by a point above the symbol in the equation. In light water reactors
2
(LWR), the coolant medium represents also the moderator at the same time. Regarding the first term on the right side in eq. (1), the control rods and additionally boron acid in a PWR (dissolved in the coolant/moderator) are normally used by the CS as actuating variables for management the neutron economy in LWR, hence the control of the reactivity. The control of the reactivity due to CS can be disturbed in case of RIA. For example, the reactivity can be (strongly) influenced by a control rod ejection due to a mechanical failure. In that short time period the CS can’t balance the effect of the control rod ejection. In general various classes of RIA scenarios exist considering for instance control system failure, control rod ejection (PWR) or control blade/rod drop (BWR), coolant/moderator temperature and void effects, and dilution or removal of coolant/moderator poison [3, 4] (cf. Table 1). In some case, the core power can rise rapidly, although the Doppler Effect limits simultaneously the rise in power thanks to the fuel temperature increase (cf. second term on the right hand side in eq. (1)). The last two terms in eq. (1) describe the influence of the change in moderator temperature 𝑇𝑚𝑜𝑑 and moderator void volume fraction 𝜙𝑚𝑜𝑑. Nevertheless, the time constant of the clad-to- coolant heat transfer is larger than that of a sharp power pulse. This leads to an almost adiabatic heating of the fuel [5] in the case of very fast reactivity insertion (see subsection 2.2.1 and subsection 3.3.3).
A few of the events in Table 1 result in a relatively low rate of increase in reactivity (e.g.
increase in heat removal by the secondary side in PWR). Thence the category of these events is named as reactivity initiated transients [3]. On the other side reactivity control rod/blade drop accident (RDA) in BWR and reactivity control rod ejection accident (REA) in PWR belong to the category of reactivity initiated accidents due to a sharp increase in reactivity into the reactor core over a short power pulse width [6]. The separation of drive mechanism and control blade leads to RDA in BWR. REA is caused by mechanical failure of the control rod drive mechanism housing (conservative ejection time of 0.1 s for a fully inserted control rod in a German PWR [7]). The induced power pulse during RIA is influenced by the reactor state, the reactivity worth of control rod, the position of control rod, the insertion of control rod in the core, the axial power distribution and the rod burn-up [8]. In general the power pulse can be characterized by width and shape as core-wide parameters and by amplitude as local parameter. Calculations for a hypothetical REA in a German PWR show pulse widths around 30 milliseconds and larger [9]. The amplitude varies over the core because of the strong dependence on the distance from the ejected control rod occurring in large reactor cores, where the reactor point kinetics approach is not valid. It’s obvious that the most
3
affected fuel rods would be located in the neighbourhood of the ejected or dropped control rod [3, 10].
Table 1 – Potential reactivity initiated scenarios in BWR and PWR (taken from [4] and extended by information in [3])
Class of scenario BWR PWR
Control system failure
▪ Control rod bank withdrawal ▪ Control rod bank withdrawal
Control rod (cluster) ejection/drop
▪ Control rod drop due to separation of a control rod blade from its drive mechanism
▪ Control rod ejection due to mechanical failure of a control rod mechanism housing
Coolant/moderator temperature and void effects
▪ Core coolant flow rate increase
▪ Core coolant temperature reduction (e.g. void collapse due to rapid cooldown)
▪ Steam line valve closure (e.g. void collapse due to overpressurization)
▪ Increase in heat removal by the secondary side
▪ Steamline break
▪ Transients during operation with positive moderator temperature coefficient
Dilution or removal of coolant/moderator poison
▪ Flushing of boron during ATWS ▪ Inadvertent poison removal
▪ Injection of diluted accumulator or refuelling water at shutdown
▪ Injection of diluted water after LOCA
▪ Ingress of secondary water after SGTR
▪ Restart of primary coolant pumps with cold/dilute water in loop
Miscellaneous ▪ Misloading fuel assemblies
▪ Transients while reactor is operating in unstable regions
▪ Inadvertent removal of control rods during shutdown
▪ Misloading fuel assemblies
Depending on the pulse characteristic, the thermal hydraulics conditions and the fuel rod state, the injected energy during RDA or REA can lead to fuel rod failure [11, 12]. Possible failure mechanisms are [3, 6]:
• Pellet cladding mechanical interaction (PCMI) in the low temperature range,
• Ballooning and burst in the high temperature range,
• Disruption during quenching of the cladding embrittled by high temperature oxidation,
• Melting of cladding and of fuel pellets in the high temperature range.
Typically the first failure mode is mainly representative for highly irradiated fuel rods [13].
Fuel rod failure can lead to core un-coolability and even to damages of the reactor pressure
4
vessel due to water hammers caused by interaction of hot fuel and coolant [3]. Thence the proof of the criteria concerning core coolability and reactivity control (defined on the DiD concept) would be difficult to achieve in this case [14]. To guarantee fuel rod integrity and hence the DiD concept, RIA tests have been performed in research reactors like the CABRI reactor in France [15], NSRR in Japan [16], as well as IGR [17] and BIGR [18] in Russia.
However, these experiments are only partly representative for the conditions in power reactors (at least for PWR). For example, the pulse width is sometimes very short in the experiments (e.g. BIGR test RT-3 with 2.5 ms [3]). Furthermore, the coolant can differ in type of medium (e.g. sodium in the test series REP-Na in the CABRI reactor), in coolant velocity (e.g.
stagnant in NSRR for PWR) and in coolant pressure (e.g. atmospheric pressure for PWR).
The ongoing OECD CABRI Water Loop Project will provide more representative data for PWR conditions (see section 3.1).
Several fuel rod failure thresholds were defined worldwide, mainly referring to the peak fuel rod enthalpies as a function of burn-up in the RIA in-pile tests (cf. Figure 1). On the one side, a continuous or stepwise decrease in the thresholds is observable with increasing burn-up in Figure 1. This results from NSRR [16] and CABRI [15] tests indicating less resistance to fuel rod failure for highly irradiated fuel rods, caused by a change in the failure mechanism. For example, due to an increased discharge burn-up a so-called high burnup structure (HBS) is developed in the periphery of the pellet - characterized by recrystallized grains, micron-sized porosity and a depletion of fission gas [19] (see section 2.1). Therefore PCMI becomes more important with higher burn-up [3] as the fission gas filled pores in the HBS extend rapidly due to the sharp temperature increase and a more peaked radial temperature profile at the fuel periphery during a RIA [20]. Furthermore highly irradiated claddings feature a thicker oxide layer on the clad surface, concomitant with a higher hydrogen content [15]. On the other side, some of the failure thresholds shown in Figure 1 differ considerably in certain areas. This indicates the need for further research analysing in more detail influences on the fuel rod failure. For example, key phenomena like fuel fragmentation, transient fission gas release (see chapter 4), clad oxide layer thickness and hydrogen uptake [21]. Afterwards more refined failure thresholds should be defined, i.e. depending on oxide layer thickness as NRC proposed in Ref. [22]. In parallel, the modelling in fuel behaviour codes should be improved for increasing the reliability of safety analysis [3].
5
Figure 1: Most thresholds are within the upper shaded area. The two lower shaded zones represent the envelope of conservative calculations for actual PWR cores. As seen, the core enthalpy can exceed the lower failure thresholds – i.e. for cases with large oxidation and brittle cladding. [23]
Today fuel performance codes are widely used worldwide to ensure a reliable check of the safety limits for RIA. Thence an OECD RIA Fuel Codes Benchmark on highly irradiated fuel rods was initiated by the OECD/NEA Working Group on Fuel Safety (WGFS) for comparison of different modelling approaches, further validation of these models and recommendations for future work [24, 25]. A challenge for the numerical methods of fuel performance codes is the sharp increase in injected power, especially for the detailed mechanical modelling in fuel performance codes [26]. Nevertheless, fuel performance codes can handle such conditions and already showed good agreement in several parameters in the OECD benchmark, e.g. in variation of enthalpy and maximum fuel temperature (see chapter 3).
Most of the thermal hydraulics system codes, sub-channel thermal hydraulics codes, reactor dynamics codes and code systems consisting of these codes include more or less simplified fuel behaviour models (see subsection 2.4.3 and chapter 5). Thence the safety analysis of the fuel performance is often carried out in a conservative manner [10]. For example, either
6
conservative thermal hydraulics boundary conditions are given to the fuel performance code or the simplified fuel behaviour models in thermal hydraulics codes and reactor dynamics codes have to be applied in a conservative manner. At the beginning of this work no full two- way coupling to a fuel performance code had so far been reported in the open literature for calculating a whole LWR core online with detailed and well validated fuel behaviour correlations (see chapter 6). This PhD thesis therefore aims at contributing to assess the potential benefits and costs of the resulting high fidelity simulations.
1.2 Research objectives and stages
Figure 2: Simplified flow structure of research objectives and stages (*due to participation in the OECD RIA Fuel Codes Benchmark in 2011/2012)
7
1. Analysis of state-of-the-art fuel behaviour modelling in traditional licensing approaches
• Selection of the fuel performance code TRANSURANUS after extensive literature and computer code review
• Analysis of RIA tests in the CABRI reactor in France and NSRR in Japan
• Participation as first TRANSURANUS user in the OECD RIA Fuel Codes Benchmark on highly irradiated fuel rods (2011/2012)
• Evaluation of further R&D needs for the development of the RIA version of TRANSURANUS
• Study regarding the benefits of the high-fidelity simulation tool, i.e. from replacement of the simplified fuel behaviour models in thermal hydraulics system codes, sub- channel thermal hydraulics codes and reactor dynamics codes through online coupling to a modern fuel performance code
2. Simulation of the Xe depletion in the high burnup structure (HBS)
• Investigation of electron probe microanalysis (EPMA) performed on samples from the High Burnup Rim Project (HBRP) irradiated in the Halden reactor
• Development of a model describing the matrix Xe depletion in the HBS based on the temperature dependent effective burn-up
• Integration of this new model in a TRANSURANUS “point version” especially developed for this purpose in a standalone testing environment
• Application of this new version and fitting of the effective burn-up and its temperature threshold to experimental data of the High Burnup Rim Project (HBRP)
• Integration of the new standalone Xe depletion model for HBS in the fuel performance code TRANSURANUS
3. Developing of the general TRANSURANUS coupling interface
• Proof that the fuel performance code TRANSURANUS can fulfil the requirements for successful couplings to thermal hydraulics system codes, sub-channel thermal hydraulics codes, CFD codes and reactor dynamics codes
• Identification of important features for the development of a general coupling interface
8
• Implementation of modifications in the source code of TRANSURANUS for coupling applications (under the restriction to apply TRANSURANUS also in standalone mode)
• Development of the general TRANSURANUS coupling interface organizing the data transfer between TRANSURANUS and the code coupled to TRANSURANUS
4. Core wide safety analysis with great degree in detail in fuel behaviour modelling for a control rod ejection scenario (no occurrence of DNB)
• Restructuring of the DYN3D source code for the “docking” of the new general TRANSURANUS coupling interface
• Testing of the general coupling interface with the reactor dynamics code DYN3D and hence the new coupled code system DYN3D-TRANSURANUS
• Application of the two-way coupling approach in the new coupled code system
• Analysis of differences between DYN3D standalone and the two-way approach (identification of potential fuel behaviour processes relevant in coupled code calculations)
5. Core wide safety analysis with great degree in detail in fuel behaviour modelling for boron dilution transient (occurrence of DNB)
• Analysis of a boron dilution transient carried out in the Rossendorf Coolant Mixing model (ROCOM) facility
• Application of both the one-way and the two-way coupling approach in the new coupled code system
• Analysis of differences between the two approaches (“online feedback” from great degree in detail in fuel behaviour modelling)
• Integration of this coupled code system DYN3D-TRANSURANUS in the tools applied to safety analysis at HZDR
9 1.3 Thesis outline
Chapter 2 gives a background about the reactivity initiated accident (RIA) as design basis accident (DBA). In this regard ongoing research on highly irradiated fuel rods shows the important role of the high burnup structure (HBS) on the fuel behaviour in such rapid transients. The reactor must be able to sustain a RIA without environmental impact, ensured by a corresponding safety analysis performed with computer codes validated on experiments.
Thence an overview is given about state-of-the-art modelling of the fuel behaviour in such codes and code systems. Furthermore, general trends are outlined toward coupled code systems with great degree in detail in fuel behaviour modelling.
Chapter 3 describes shortly the RIA tests and the steps to simulate such experiments with TRANSURANUS. In addition, results and conclusions are presented for the fuel performance code TRANSURANUS based on the OECD RIA Fuel Codes Benchmark in 2011/2012. The version of TRANSURANUS for RIA simulations is still under development, hence its performance is evaluated by participation in international benchmarks. The findings in this benchmark resulted amongst others to the work in the following chapter.
Chapter 4 concerns the improved modelling of the high burnup structure (HBS) in the fuel performance code TRANSURANUS. The HBS is of special interest because it may limit the productive life of fuel and has an important potential effect on fuel behaviour during design basis accidents (DBA) such as RIA. A new model is presented for the Xe depletion from the grains in the HBS.
Chapter 5 presents the newly developed general TRANSURANUS coupling interface applicable to thermal hydraulics system codes, sub-channel thermal hydraulics codes, CFD codes and reactor dynamics codes, which enables the coupling to the fuel performance code TRANSURANUS. The main features of this interface are the application at either fuel assembly level or fuel rod level, one-way or two-way coupling and automatic switching from steady-state to transient conditions in TRANSURANUS. The interface is applicable for various scenarios. The chapter gives also a short description for maintenance and the necessary modifications in the code coupled to TRANSURANUS.
10
Chapter 6 focuses on the coupled code system DYN3D-TRANSURANUS as first application of the general TRANSURANUS coupling interface. After successful testing two RIA scenarios for a German PWR (Konvoi) were calculated: a control rod ejection scenario, and a boron dilution transient based on experimental data of the ROCOM facility. Firstly, the differences between DYN3D standalone and the two-way coupling approach of DYN3D- TRANSURANUS are analysed. For this purpose, several variants of the code system differing in level of detail in fuel behaviour modelling were used. In addition, the differences between the one-way and two-way coupling approach are discussed.
Chapter 7 summarizes the key results and conclusions found in this PhD thesis.
1.4 Verification and validation
Chapter 3: The RIA version of TRANSURANUS is still under development. For LWR experimental fuel behaviour data are still limited for RIA scenarios, in particular for highly irradiated fuel rods. Furthermore, it’s not possible from technical point of view to measure every by a fuel performance code calculated parameter in fuel behaviour experiments, e.g.
fuel stress or radial location of the maximum of the fuel temperature. Hence, TRANSURANUS are validated for the RIA test CIP0-1 and verified for the RIA tests CIP0-1 and CIP3-1 in the frame of this thesis (cf. Table 5 and Table 8). This work were performed by participation in the international OECD RIA Fuel Codes Benchmark for highly irradiated fuel rods in 2011/2012.
Chapter 4: The fission gas behaviour in HBS is modelled in the TRANSURANUS fuel performance code assuming its depletion to be dependent on the local burn-up in the HBS.
Nevertheless, a scatter still exists in local burn-up values. To improve the modelling, the belonging TRANSURANUS model was extended to the influence of the local temperature by applying a temperature transition zone with related thresholds of a former work. Afterwards it was validated among new experimental data (not measured in the frame of this work).
Nevertheless, the upper threshold temperature were in disagreement with the experimental data, e.g. due to partly unknown irradiation histories in the former work (see subsection 4.3.2). Hence, the temperature threshold was newly validated on the new and more detailed
11
experimental data (see subsection 4.3.2). Furthermore, the impact of Xe yield was verified at the end of this thesis (see subsection 4.3.3).
Chapter 6: Comprehensive verification work is presented in this chapter for the two RIA scenarios CR ejection event and boron dilution transient for the coupled code system DYN3D-TRANSURANUS. The differences between DYN3D standalone and the two-way coupling approach of DYN3D-TRANSURANUS are verified and analysed in the first RIA scenario (see subsection 6.4.2). For that purpose, several variants of the code system differing in level of detail in fuel behaviour modelling were used. In addition, the differences between one-way and two-way coupling approach are verified and discussed in the second scenario (see subsection 6.4.3). According to both scenarios, a German PWR Konvoi Design was applied for the verification.
Developers and users have been calculating and verifying these both RIA scenarios for more than one decade with DYN3D standalone. In parallel they conducted validation work for the models of DYN3D standalone. Hence this former works allows this kind of verification in the thesis. Furthermore, it allows to draw conclusions for the impact of a great degree in online fuel behaviour modelling on the thermal hydraulics and neutron kinetics behaviour.
Integral data of the design basis accident RIA would be needed to also validate the coupled code system DYN3D-TRANSURANUS. Both verified RIA scenarios didn’t occur in power reactors in the past. Hence integral data didn’t exist to validate both the modelling of neutron kinetics, thermal hydraulics and detailed fuel rod behavior in once and the overall interaction between them in the frame of this thesis.
12
2 Literature review
2.1 Characteristics of the high burnup structure (HBS)
The discharge burn-ups in power reactors increased over the last few decades. Because the highest burn-ups are achieved in the fuel pellet periphery caused by the fuel self-shielding effect [27], a so-called high burnup structure (HBS) occurs in the periphery of the fuel pellets [28, 29]. Due to the location at the pellet periphery this restructured fuel region is often named as rim. Nevertheless, this denotation can be misleading (see section 4). The restructuring of the fuel matrix at higher burn-up was already observed in studies for the uranium bearing fuel in navel reactors in the 1950’s [30]. The HBS is of special interest because it may limit the productive life of nuclear fuel [31] and can have an important effect on the fuel behaviour during design basis accidents (DBA) [3]. The following main characteristics are representative for the HBS (cf. Figure 3):
• Recrystallized grains of 50-200 nm [32]
• Development of micron-sized porosity surrounded by recrystallized grains [33]
• Depletion of fission gas from the fuel matrix into the HBS pores [27]
Figure 3: SEM images of the high burnup structure (HBS). Left, subdivided grains due to restructuring; right, view in a HBS pore surrounded by subdivided grains [33]
The related processes seem to occur at different points in time. Barner et al. observed first the depletion of fission gas from the fuel matrix measured by electron probe microanalysis
![Figure 4: Possible mechanisms for fuel and cladding damage under RIA [45]](https://thumb-eu.123doks.com/thumbv2/1library_info/4564845.1599797/41.892.110.785.317.774/figure-possible-mechanisms-fuel-cladding-damage-ria.webp)
![Figure 9: Stages of the fuel rod in a complex irradiation experiment compared to its simulation in TRANSURANUS (individual figures taken from [125])](https://thumb-eu.123doks.com/thumbv2/1library_info/4564845.1599797/69.892.103.783.601.993/figure-stages-irradiation-experiment-compared-simulation-transuranus-individual.webp)
![Table 7 – Thermal hydraulics conditions in power reactor vs. research reactor (CIP0-1) [25]](https://thumb-eu.123doks.com/thumbv2/1library_info/4564845.1599797/70.892.121.788.649.758/table-thermal-hydraulics-conditions-power-reactor-research-reactor.webp)
![Figure 12: Node linear heat rate over time (benchmark case #1). Left, during pre-irradiation in the power reactor [25]; right, during RIA test CIP0-1 in the research reactor CABRI (extracted from TRANSURANUS (HZDR) results)](https://thumb-eu.123doks.com/thumbv2/1library_info/4564845.1599797/76.892.118.777.118.337/figure-benchmark-irradiation-reactor-research-reactor-extracted-transuranus.webp)