An Empirical Review of the Connection Between Model Viewer
Characteristics and the Comprehension of Conceptual Process Models
Jan Mendling
1· Jan Recker
2· Hajo A. Reijers
3· Henrik Leopold
3©The Author(s) 2018. This article is an open access publication
Abstract
Understanding conceptual models of business domains is a key skill for practitioners tasked with systems analysis and design. Research in this field predominantly uses experiments with specific user proxy cohorts to examine factors that explain how well different types of conceptual models can be comprehended by model viewers. However, the results from these studies are difficult to compare. One key difficulty rests in the unsystematic and fluctuating consideration of model viewer characteristics (MVCs) to date. In this paper, we review MVCs used in prominent prior studies on conceptual model comprehension. We then design an empirical review of the influence of MVCS through a global, cross-sectional experimental study in which over 500 student and practitioner users were asked to answer comprehension questions about a prominent type of conceptual model - BPMN process models. As an experimental treatment, we used good versus bad layout in order to increase the variance of performance. Our results show MVC to be a multi-dimensional construct. Moreover, process model comprehension is related in different ways to different traits of the MVC construct. Based on these findings, we offer guidance for experimental designs in this area of research and provide implications for the study of MVCs.
Keywords Process modeling · Model viewer characteristics · Experiment · Conceptual modeling · Literature review · BPMN
1 Introduction
The complexity of contemporary information systems draws much attention to how their analysis and design can be supported by appropriate methods and tools.
Efforts are spent on new techniques that support the modeling of system requirements and, increasingly, on how these techniques actually aid the analysis and design
Jan Mendling jan.mendling@wu.ac.at Jan Recker
jan.recker@wiso.uni-koeln.de Hajo A. Reijers
h.a.reijers@vu.nl Henrik Leopold h.leopold@vu.nl
1 Wirtschaftsuniversit¨at Wien, Welthandelsplatz 1, 1020 Vienna, Austria
2 University of Cologne, Albertus-Magnus-Platz, 50923 K¨oln, Germany
3 Vrije Universiteit Amsterdam, De Boelelaan 1081, 1081 HV Amsterdam, The Netherlands
process (Xiao and Zheng 2012). Of special interest in this stream are studies that focus on conceptual models as an aid to facilitate the comprehension of certain domain facts that relate to an information system, which will contribute to better design decisions and eventually a better system.
Therefore, investigating the factors that influence the way people make sense of conceptual models is instrumental in improving the analysis and design of information systems in terms of their effectiveness and efficiency. Not surprisingly, conceptual modeling remains an active field of study, with contributions regularly occurring in the field’s main journals.
Studies that discuss the comprehension of various mod- eling artifacts acknowledge model viewer characteristics (MVCs) as a factor of influence. Various aspects of MVCs have been discussed in the literature, partially relating to theoretical knowledge (Khatri et al. 2006; Mendling et al. 2012; Reijers and Mendling 2011), duration of prac- tice (Recker 2010a; Reijers et al. 2011b; Recker and Dreil- ing 2011), education (Recker 2010a), or familiarity (Burton- Jones and Meso 2008).
We observe, however, that MVCs are hardly considered prominently in research on the comprehension of concep- tual models. First, several experiments in this area cover them as control variables, but not as independent variables
Published online: 20 anuary 2018J
in their own right. Second, experiments use different oper- ationalizations of different aspects of viewer characteristics such as the years of modeling experience (Burton-Jones and Meso 2008) or the number of models created (Recker and Dreiling 2011), which makes the results difficult to compare. Third, experiments often involve specific cohorts of potentially limited variation in MVCs such as students, although it is not fully understood in how far they have model viewer characteristics that are similar or different to other cohorts.
These observations call for research into the role of MVCs in model comprehension and into respective profiles of different model readers, such as students and practitioners. We are not the first to make this observation.
Burton-Jones et al. (2009), for example, stated in their review already that “given the importance of these concepts, more work needs to be done” (p. 514). We take this step and examine in more detail how users assign meaning to the elements represented in a conceptual model presented to them. This is important because up until now, it is unclear to which extent results reported for certain cohorts can be extrapolated to other populations, in particular from students to IS professionals or business experts.
Do students possess MVCs that professionals exploit in working with conceptual models or do students lack the decisive type of MVCs altogether? Furthermore, there is a lack of understanding on how different operationalizations of MVCs correlate with one another. For instance, Burton- Jones and Meso (2008) find a negative correlation of self- reported UML modeling experience with comprehension and problem-solving tasks among post-graduate students, while Mendling et al. (2012) find process modeling knowledge to have a significant and positive impact on model comprehension by students. Do these findings relate to different MVCs or to different profiles of the involved participants?
We chose to study, first, how different MVCs as used in prior experiments relate to one another; second, how important populations, namely students and practitioners, differ in these MVCs; and third, and how these differences have an impact on model comprehension performance.
To this end, we designed and conducted an experimental study that compares and contrasts MVCs discussed in the literature in terms of their impact on model comprehension tasks. We use a popular type of conceptual model - BPMN process models, and utilize an experimental treatment of good versus bad layout in order to increase the variance of performance and in this way to better study the connections between MVCs and performance aspects.
The findings advance the literature in two directions.
First, we systematically describe connections between inde- pendent measures, MVCs and their impact on compre- hension. It is a unique feature of our study that these
connections are grounded in empirical data, and in this way pave the way for theory building in future studies (Miller 2007). Second, we derive recommendations for covering MVCs in future experiments on model comprehension.
These contributions are important also for system analysis and design as they extend our knowledge about core subject matters of the field (Sidorova et al. 2008) and the student- practitioner dichotomy (Compeau et al. 2012). They also complement recent research on the process of creating mod- els (Claes et al. 2015) and previous surveys of conceptual modeling research (Houy et al. 2012; Figl 2017; Cognini et al. 2016). In this way, we aim to contribute to improving the external validity of model comprehension experiments toward the population of practitioners (Venable 2007; Kock et al. 2002).
We proceed as follows. Section 2 describes the back- ground of our study. We recap conceptual modeling research and then review in some detail how the notion of MVCs has been operationalized, used and tested in prominent experimental research on model comprehension. Section 3 then presents the design of our study, and Section 4 pro- vides the results. Section 5 discusses implications of this research. Section 6 concludes the paper with a review of its contributions.
2 Background
2.1 Conceptual Modeling
Conceptual modeling is a key task during system analysis and design, where professionals attempt to develop a representation of elements of a real-world domain that they believe to be important to consider when analyzing or designing information systems (Wand and Weber 2002). Thereby, conceptual models are used to facilitate a communicative process among relevant stakeholders, they document relevant process and data requirements pertinent to the implementation of a system, and they guide end users in operating and maintaining the system. For all these purposes, it is of importance that professionals are able to understand the content of these models to be able to reason about them. This makes model comprehension an important and active stream of research (Burton-Jones et al.
2009). Conceptual models are developed by using modeling
grammars that provide various, often graphical, constructs
to model different types of phenomena (Wand and Weber
2002). Depending on the type of grammar chosen, the focus
may be on important things in the real-world and their
properties, which are important to know to understand the
data structure of an information system (Weber 1997). Other
grammars focus on behaviors and dynamics of events and
resulting actions in the real-world; these are important to
understand how processes can be modeled or enacted in an information system (Dumas et al. 2013).
Research in this area has been three-fold. One stream of research has examined how conceptual modeling grammars might be improved such that the ability is enhanced to develop good conceptual models with them. This line of research has established and examined design principles as well as guidelines for the use of conceptual modeling grammars, e.g., Evermann and Wand (2005), Mendling et al. (2010), and Figl et al. (2013a). A second stream of research is examining conceptual modeling in practice and establishes findings about their usefulness (Recker et al.
2011; Becker et al. 2016) or purposes and challenges of its use, e.g., Fettke (2009) and Indulska et al. (2009). A third stream of research, which is most relevant to this paper, is examining the conditions which determine how well a conceptual model is understood by those using it.
This research, to date, has largely examined semantics (i.e., the meaning of constructs in a model, e.g., Weber (1997)), syntax (i.e., the rules about how a model can be constructed with a grammar, e.g., Reijers et al. (2011a) and Mendling et al. (2010)) and to a much lesser extent pragmatics (i.e., how existing user knowledge may influence how a model is understood, e.g., Khatri et al. (2006) and Khatri and Vessey (2016)). Some studies, finally, have attempted to review the relevant works in these areas, e.g., Burton-Jones et al. (2009), with the aim to provide guidelines for future research. Researchers from these and other studies, e.g., Recker et al. (2014), have repeatedly lamented that not enough emphasis has been on non-model related factors, in particular on MVCs (Gemino and Wand 2003), which is the reason we undertook the work reported in this paper.
2.2 Prior Research on Conceptual Model Comprehension
Several authors suggested that the comprehension of a conceptual model can be considered as the outcome of a learning process that requires model viewers to actively organize and integrate the model information with their own knowledge and previous experience (Gemino and Wand 2003; Burton-Jones and Meso 2008; Mayer 2009). This conceptualization explicitly emphasizes the role of MVCs as one important factor for model comprehension. Still, in the wider information systems field of research, the emphasis on MVCs in conceptual model comprehension studies has been cursory at best. This may be because the emphasis of this discipline has been foremost on the model as a representation artifact of an information system - the identity core of the discipline (Weber 2006). Or, it may be that no strong theory base has been available yet to conceptualize MVCs and their influence.
To substantiate our argument, we reviewed the literature on model comprehension studies to examine whether and how relevant operationalizations of MVCs have been previously used. Table 1 summarizes this review. It describes specifically whether and how available studies included variables to capture and consider MVCs in their research models, analyzes, and results.
Table 1 is a comprehensive (not exhaustive) classification of prior studies in this area. It highlights several points relevant to this paper. First, it shows that comprehension as a dependent (affected) variable can be examined in terms of effectiveness (accuracy of comprehension) and efficiency (resources required to attain comprehension) (Burton-Jones et al. 2009). Traditionally, the question of effectiveness or accuracy of comprehension has been of predominant interest (Bodart et al. 2001; Burton-Jones et al. 2009). The reason for this is that the extent of comprehension is a key quality criterion for all model-based problem solving tasks, over and above the question how much time is available to the analysts in developing this understanding.
Furthermore, task completion time is a dimension that has to be considered (Gemino and Wand 2004). Second, Table 1 allows us to develop three key arguments that characterize our current understanding of MVCs and their impact, which are important to our study:
1. The studies differ vastly in their consideration of MVCs in their experimental settings. Most studies to date include MVCs as a control variable, if at all. Only recently have MVCs been considered in some attempts as an independent factor.
2. The studies to date have used inconsistent measures to operationalize MVCs. Some rely on self-report scales, others use counts of experience in years or number of models.
3. The studies to date rely on different cohorts as participants, with under-graduate students being used in the majority of studies. Comparison of results across the participant cohorts is difficult because of the differences between the participant groups used in the studies.
There are notably few studies that involve practitioners in their sample.
The deeper exploration of these three arguments is the
aim of our work. First of all, we wish to establish the
significance of MVCs for predicting model comprehension
performance. Second, it seems important to examine the
different operationalizations of MVCs in more detail. This
paves the way to offer a better conceptual definition
of MVCs in modeling plus an appropriate empirical
examination of the effects of various dimensions of MVCs
on comprehension performance. Third, we wish to reflect
on different cohorts of participants in experiments, notably
whether we can rely on students as adequate proxies for
Table1PriormodelcomprehensionexperimentsandtheconsiderationofMVCs Ref.MeasuresforMVCsVariableStudycontextDependentvariableSamplepopulationFindings AllenandYearsofexperienceindatabaseCovariateDatabasequeryQueryformulationUnder-graduateDomainfamiliarityleadstoincreased Parsons(2010)queryformulationformulationaccuracystudentsqueryformulationaccuracy. Self-reportedlevelofdomainTaskcompletiontimeDomainfamiliaritydoesnotleadto familiaritydecreasedtaskcompletiontime. Self-reportedconfidenceDomainfamiliarityleadstoincreased inqueryaccuracy.confidence. Bera(2012)ExperiencewithBPMNmodelingControlBPMNmodelswithComprehensionaccuracyUnder-graduatestudentsNovicessufferfromcognitiveoverload Self-reportedlevelofdomainandwithoutswimlanesProblemsolvingscorebutswimlanesimproveonthis Beraetal.(2014)Self-reportedlevelofdomainModeratorImportanceofclearComprehensionPost-graduatestudentsThebenefitofclearsemanticsisgreatest knowledgesemanticsindataperformancewhenreadershavemoderateknowledgeof modelstherepresenteddomain. Bowenetal.(2009)UniversitycoursegradeCovariateDatabasequerySemanticcorrectnessofPost-andunder-Universitycourseperformanceisasignificant pointaverageformulationqueryformulationgraduatestudentspredictorofsemanticquerycorrectness. TaskcompletiontimeUniversitycourseperformanceisasignificant predictoroftaskcompletiontime. Self-reportedconfidenceUniversitycourseperformanceisasignificant inqueryaccuracypredictorofconfidenceinqueryaccuracy. Burton-JonesandExperiencewithUMLmodelingControlUMLmodelsComprehensionPost-graduatestudentsNegativecorrelationswithcomprehension Meso(2008) Problem-solvingaccuracyandproblem-solving Easeofunderstanding Figletal.(2013a)WorkexperienceControlProcessmodelswithComprehensionaccuracyUnder-graduatestudentsNotationaldeficienciesinsymbolsets HoursoftrainingdifferentsymbolsasTaskcompletiontimelowercomprehension Self-reportedmodelingconfidencederivedfromasetof differentlanguages Self-reporteddomainknowledge Figletal.(2013b)KnowledgetestscoreCovariateEffectofroutingComprehensionPost-andunder-graduatePerceptualdiscriminabilityandpopout accuracy symboldesigninTimestudentsaffectperceivedcognitiveloadandmodel processmodels Perceivedcognitiveloadcomprehensionaccuracybutnot Perceivedcontrolflowcomprehensionefficiency comprehensiondifficulty GeminoandFamiliaritywithmodelingControlUMLmodelsInformationretentionUnder-graduatestudentsNotsignificantascovariate Wand(2005)Problem-solving Khatrietal.(2006)TestindatamodelingcourseIndependentDatamodelsComprehensionaccuracyUnder-graduatestudentsSignificant Problem-solving
Table1(continued) KhatriandModelcomprehensiontaskIndependentDatamodelsSchema-basedandUnder-graduatestudentsThetwotypesofdomain Vessey(2016)scoreinferentialproblemsolvingknowledge(modelcomprehension Self-rateddomainfamiliarityanddomainfamiliarity)have Kummeretal.(2016)NationalcultureIndependentSyntaxhighlightingComprehensionaccuracyPost-graduatestudentssimilarrolesinexplainingproblem- SelfreportedBPMNControlinprocessmodelsPerceiveddifficultysolvingColorsinAsianculturesaid familiarityControlTaskcompletiontimecomprehension,inGermanic Knowledgetestscoreculturesdifferenteffects. Lukyanenkoetal.(2014)NoneNotavailableinformationNumberofobservationsCitizenscientistsNotavailable completenessinNumberofnewobservations citizenscience Mendlingetal.(2012)KnowledgetestscoreIndependentAbstractandComprehensionperformancePost-graduatestudentsKnowledgecorrelatedwith YearsofExperiencedomainprocessmodelsTaskcompletiontimecomprehensionaccuracy. IntensityofprocessKnowledgeandintensity modelusecorrelatedtocompletiontime. Parsons(2011)NoneNotavailablePropertyprecedenceComprehensionperformanceUnder-graduatestudentsNotavailable Taskconfidence Recker(2013)KnowledgetestscoreCovariateUsefulnessofgatewayComprehensionperformancePost-graduatestudentsUseofgatewayspositivelyaffects constructsTimecomprehension ReckerandNumberofmodelscreatedCovariateEPCvsBPMNmodelsComprehensionperformancePost-graduatestudentsNotsignificantforcomprehension Dreiling(2011)Problem-solvingInteractioneffectsforproblem- Taskcompletiontimessolving Reckeretal.(2014)PriorDomainKnowledgeControlProcessmodelComprehensionscoresModelingpractitionersCognitiveabilities,different PriorMethodKnowledgecomprehensionasalearningstylesandstrategies Self-efficacylearningprocessaffectlevelofcomprehension ReijersandKnowledgetestscoreIndependentProcessmodelComprehensionaccuracyPost-andunder-graduateEducationyieldsdifference Mendling(2011)Intensityofprocesscomplexitystudentsincomprehension. modeluse Education Reijersetal.(2011a)ModelingexpertiseIndependentSyntaxhighlightingComprehensionaccuracyPost-graduatestudentsSyntaxhighlightingaids (noviceorexpert)inprocessmodelsTaskcompletiontimeandindustryexpertscomprehensionaccuracyfor novicesbutnotforexperts. Noeffectsontaskcompletiontime. Shanksetal.(2010)NoneNotavailableClassesofthingsComprehensionPost-graduatestudentswithNotavailable performanceworkingexperience Problem-solving Discrepancychecking Comprehensiontime Shanksetal.(2008)NoneNotavailablePart-wholeProblemsolvingPost-graduatestudentsNotavailable relationshipsTaskcompletiontime Easeofuse
modeling practitioners. To achieve these aims, we now report on the design and execution of an experiment designed as an empirical review.
3 Research Method
To examine the role of MVCs and the measurement thereof in explaining how well users understand conceptual models, several options exist. Our specific objective was to evaluate measures of MVCs and their impact on individuals’
understanding of conceptual models. To that end, an experiment appears to be the best choice, also because it is congruent to past research in this area. In what follows, we describe relevant design choices about this experiment.
3.1 Design
We implemented our study as an online quasi-experiment (Wohlin et al. 2000) that featured MVCs as within-subject variations and layout (good versus bad) as between-subject variations. Our study classifies as a quasi-experiment because a random assignment of participants to groups was not feasible. Instead, we collected and examined several key demographic variables to evidence an appropriate variety in the responses. The main dependent variable was performance in model comprehension tasks, that is, tasks designed to measure how well participants understand a conceptual model presented to them.
The first main design decision concerned the type of conceptual model to use in a model comprehension task.
We chose process models as the type of conceptual model.
This decision was based on the fact that process models, unlike most other forms of conceptual models, are not the sole domain of IT experts. Instead, they are meant to be used by a large variety of business users with little or no training in IT, analysis and design methods, let alone process modeling. For example, the BPMN specification notes that its primary goal is to provide a notation that is readily understandable by all business users, from business analysts that create the initial drafts of the processes, to the technical developers responsible for implementing the technology that will perform those processes, and finally, to the business people who will manage and monitor those processes (OMG 2010). In turn, these models are in use by a largely heterogenous group with various levels of knowledge and experience - which makes the consideration of MVCs in studies an important precondition for ecological validity of the findings. Also, we complement existing studies relating to object or data models, e.g. Aguirre-Urreta and Marakas (2008), with our work.
To tease out performance differences among the partici- pants, we implemented the treatment of good and bad layout
as between-subject variations. This choice was informed by prior research on the relationship between secondary notation and model comprehension. The term secondary notation refers to visual cues that are not part of the actual modeling grammar (Petre 1995). Several studies have shown that particularly layout represents a secondary nota- tion aspect that affects model comprehension (Purchase 1997; Purchase et al. 2001, 2002; Petre 2006; Turetken and Schuff 2007). Among others, these studies suggest that models should avoid line crossings, that constructs should be arranged symmetrically, and that semantically related constructs should be placed close to each other. Besides the general importance of secondary notation for model comprehension, Schrepfer et al. (2009) also discuss the relationship between secondary notation and MVCs. They argue that in particular inexperienced model viewers may benefit from good layout.
3.2 Participants
Suitable subjects for our study were individuals with previous experience in using process models. To examine the MVC differences between two subject groups that are typically encountered in experimental studies, we sought to recruit subjects from two populations: students and practitioners, both of which we could reach via our interactive website. In this way, we could also implement direct feedback on which answers were correct, which allowed for a gamification of the experiment (by assigning scores and ranks to participants in comparison to others) to incentivize participation as well as performance.
To recruit student subjects, graduate students were recruited from our ongoing and prior courses on business process modeling at TU Eindhoven, HU Berlin, QUT Brisbane, and WU Vienna. We sent out invitations via course coordinators to those students that previously received at least basic training on process modeling concepts and theory. They were invited via email and motivated with the hint that answering the comprehension questions and learning from the online feedback would be a good preparation for unit exams. We were not ourselves involved in the teaching of these courses and had no control over course marks or exam composition.
Practitioners were recruited through an international
advertisement campaign using news forums, practitioner
communities, and special interest groups on the inter-
net. The invitation was posted, among others, in rele-
vant XING and LinkedIn groups, Bruce Silver’s BPMN
blog, the ARIS process modeling community, and the
BPMN Forum. Practitioners were attracted by the chal-
lenge to test their understanding of the BPMN stan-
dard and the prospect of receiving feedback on the
results.
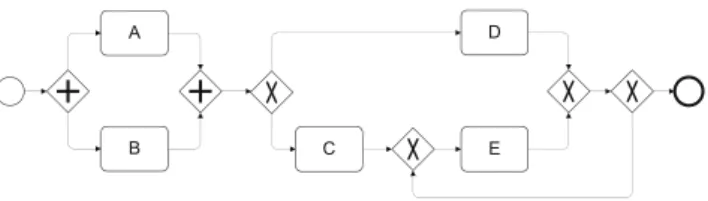
Fig. 1 Example of a simple BPMN process model
3.3 Materials
In the experiment, we designed five BPMN process model comprehension tasks.
1The comprehension challenge with BPMN, as with other types of process models, is to correctly understand the control flow between different activities (e.g. A, B, C, D, E in Fig. 1). The control flow of a process model defines temporal and logical constraints between those activities, for instance whether the execution of certain activities depends upon decisions, whether paths are concurrent, or whether activities can be repeated. Control flow is the key mechanism to describe behavioral dynamics in processes (Dijkman et al. 2008) and is the key differentiator to other forms of modeling, such as object structures or data relationships. Control flow aspects are modeled in BPMN using so-called gateways. In essence, there are gateways with three different routing logics (XOR, AND, OR), which can be used as splits (multiple outgoing arcs) or joins (multiple ingoing arcs). XOR-splits represent exclusive choices and XOR-joins capture respective merges without synchronization. AND-splits introduce concurrency of all outgoing branches while AND-joins synchronize all incoming arcs. OR-splits define inclusive choices of a 1- to-all fashion. OR-joins synchronize such multiple choices, which requires a sophisticated implementation (Kindler 2006; Mendling 2008). Furthermore, there are specific nodes to indicate the start and end of a process.
Figure 1 shows the example of a simple BPMN process model. The process starts at the left with a start event (a circle with a thin line). Then, an AND-split introduces two branches of concurrent execution. Accordingly, both A and B are activated and can be executed without any order constraints. The subsequent AND-join synchronizes the two branches. Once both have been completed, a decision can be taken at the following XOR-split: the process has to continue either with C or D. If C is taken, the process continues via the XOR-join for executing activity E.
Otherwise, only D is executed. In either case, the XOR-join after D and E leads to an XOR-split. There is the option to jump back to execute E, potentially multiple times.
In our study, we focused on behavioral constraints that can be derived from the process model. Domain content,
1The original number of eight models was reduced after piloting in order to avoid potential fatigue.
which is typically included in textual descriptions of activity labels, is ignored. The advantage is that there is an objective basis for judging process model comprehension and effects of domain knowledge are eliminated (Reijers and Mendling 2011). Also, a recent study showed that control flow comprehension is hindered by the presence of domain information (Mendling et al. 2012), which would have masked some of the effects and results that we are interested in in this work.
We utilize binary relationships between two activi- ties in terms of execution order, exclusiveness, concur- rency, and repetition. These relationships play an impor- tant role for reading, modifying, and validating the model.
– Execution Order relates to whether the execution of one activity a
ialways happens before the execution of another activity a
j. In Fig. 1, the execution of A is always executed before D.
– Exclusiveness means that two activities a
iand a
jcan never be executed in the same process instance. In Fig. 1, C and D are mutually exclusive. Note that D and E are not exclusive, since there is the option to jump back to E after having executed D.
– The concurrency relation covers two activities a
iand a
jif they can potentially be executed in an arbitrary order.
In Fig. 1, A and B are concurrent. This means that the execution of A can precede that of B or the other way around.
– A single activity a is called repeatable if it is possible to execute it more than once for a process instance. In Fig. 1, E can be repeated.
Statements such as “Activity a
ican never be executed before a
j” can be formalized and verified using behavioral profiles, which capture the four different relationships described above (Weidlich et al. 2011). Most of the studies to date have perused these questions as comprehension measurement instruments, notably because they allow for an objective measurement of control flow comprehension, e.g., Reijers and Mendling (2011), Reijers et al. (2011a), and Mendling et al. (2012). A key question that emerges now is how individuals with different levels of abilities and skills can identify, comprehend, and reason about these control flow aspects in a process model. This is important because this understanding is essential for any subsequent deeper problem-solving task. In designing the BPMN models used for the comprehension tasks, we neutralized potentially confounding impacts of the notation (Sarshar and Loos 2005), model complexity (Mendling 2008), domain knowledge (Mendling et al. 2012), and the modeling purpose (Dehnert and van der Aalst. W.M.P.
2004) by choosing letters as activity names and models of
comparable size.
To implement the treatment of layout, we created a well laid out version and a badly laid out version of each model.
The variation was guided by well-known esthetic metrics from graph drawing research by Purchase et al. (1997), Ware et al. (2002), Purchase et al. (2002), Petre (2006), and Purchase (2014):
– Line crossings: An increase in the number of crossings has been found to decrease the readability of that layout.
The models with good layout have no crossings while the bad layout ranges from 4 to 23 crossings.
– Edge Bends: An increase in the number of edge bends has been found to negatively affect the understanding of a model. The models with good layout have 29 to 61 bends while the bad layout ranges from 89 to 119 bends.
– Symmetry: Graphical layouts where elements are placed more symmetrically have been found to be easier to read. While the good layout models have only three violations of symmetry altogether, the badly laid out models have between 6 and 14 repositionings of elements that break symmetry.
– Use of Locality: When graphical elements that are related are placed close to each other, it is apparently easier to understand their connection. The models with good layout break locality between 3 and 7 times, the bad ones between 10 and 32 times.
– Reading direction: The direction of arcs should be in line with rightwards reading direction. The models with good layout have between 3 and 9 arcs pointing rightwards, the bad ones between 13 and 25 such arcs.
Participants were then randomly assigned to one of the following settings:
– Setting A: M1 (good) - M2 (bad) - M3 (good) - M4 (bad) - M5 (good)
– Setting B: M1 (bad) - M2 (good) - M3 (bad) - M4 (good) - M5 (bad)
The participants had to answer six questions per model, i.e. 30 questions altogether, with the questions focusing on aspects such as exclusiveness, concurrency, and optionality of activities, as described above. These aspects are based on the formalization of control flow principles by Kiepuszewski et al. (2003) and comparable to the ones previously used by (Mendling et al. 2012). The comprehension tasks were formulated as a statement about how two or three activities in a process model relate to each other in terms of the aforementioned behavioral relations.
In answering the comprehension tasks, subjects were allowed to look at the process models when answering questions, rather than requiring that they work from memory.
3.4 Measurement
As independent variables, we operationalized an extensive set of MVCs identified from our literature review. Table 2 gives an overview of the measures we consider in our experiment and their previous applications in related studies. In the experiment, we gathered the following data for each participant using self-reports following past practice (Gemino and Wand 2005; Mendling et al. 2012):
Position: This variable captured the primary occupa- tion of the participant in relation to the study on pro- cess modeling. Answer choices were “student”, “practi- tioner”, or “other”.
Theory: This variable captures the sum of correct answers in a process modeling knowledge test as used by (Reijers and Mendling 2011; Mendling et al. 2012). This test allows to capture the a priori knowledge of different control flow concepts relevant to process modeling.
Participants are asked to answer seven questions on fundamental concepts of process modeling, including concurrency, gateways, repetition, and choices.
ModelingYears: This variable is a self-reported account of how long ago a participant started with process modeling (“How many years ago did you start process modeling?”). The variable is recorded on a metric scale.
ModelsRead: This variable captures the intensity of working with process models the last twelve months on a metric scale (“How many process models have you analyzed or read within the last 12 months?”).
ModelsCreated: This variable defines the intensity of editing process models in the last twelve months (“How many process models have you created or edited within the last 12 months?”).
Training: This independent variable records the degree of formal eduction in the last year (“How many work days of formal training on process modeling have you received within the last 12 months?”).
SelfEducation: This variable captures self training, which may be acquired through learning-by-doing, or self-study of textbooks or specifications (“How many work days of self education have you made within the last 12 months?”).
FAM1-3: This set of metric items captures familiarity with BPMN using a seven point Likert scale (FAM1:
“Overall, I am very familiar with the BPMN.”, FAM2:
“I feel very confident in understanding process models created with the BPMN.”, FAM3: “I feel very competent in using the BPMN for process modeling.”).
MonthsBPMN: This variable assesses how long ago a
participant started using BPMN (“How many months ago
did you start using BPMN?”).
Table 2 MVCs as a model comprehension variable in the literature
Variable name Measure Scale Relevant literature
theory Level of theoretical knowledge of Metric (Mendling et al.2012)
modeling (Reijers and Mendling2011)
(Khatri et al.2006)
modelingYears Years of experience in modeling Metric (Recker2010a)
modelsRead Number of models read or analyzed Metric (Recker and Dreiling2011)
within twelve months (Reijers and Mendling2011)
(Mendling et al.2012)
modelsCreated Number of models created or edited Metric (Reijers et al.2011b)
within twelve months (Davies et al.2006)
training Days of modeling training Metric (Recker2010a)
within twelve months
selfEducation Days of modeling self education Metric (Recker2010a)
within twelve months
FAM1, FAM2, Level of familiarity with a specific 3-item (Gemino and Wand2005)
FAM3 modeling grammar metric (Burton-Jones and Meso2008)
monthsBPMN Number of months working with a Metric (Recker2010a)
specific modeling grammar
To develop measurements for the dependent variable of conceptual model comprehension performance, we automatically recorded the number of correct answers for each of the five process models presented. This provided a measure for comprehension accuracy. Each of the comprehension questions had an objectively correct answer, which could be answered based on behavioral semantics of the process model (Weidlich et al. 2011). Accordingly, we define the following dependent variables:
Performance: This variable captures the extent of model comprehension accuracy. It is calculated as the sum of correct answers given by the participant for comprehension questions that relate to a particular model. The maximum value for this variable is six, which results from six yes/no questions for each of the models.
Completion Time: This variable captures the time for completing a specific comprehension task. It is calculated as the sum of completion times of the participant for comprehension questions that relate to a particular model.
The Appendix details the tasks and measures used.
3.5 Procedures
The experiment proceeded through a sequence of three tasks:
1. subjects were to self-assess different MVC-related measures,
2. subjects were to answer a theoretical knowledge test, and
3. subjects were to answer comprehension questions for five process models (layout setting A or B).
All tasks were implemented in an online experimentation system accessible on a website. This implementation allowed us to source participants cross-sectionally and globally. However, it also meant that we had to take specific measures to stimulate participation and mitigate potential cheating. The adoption of BPMN Version 2.0 as an OMG standard in 2010 helped us to direct considerable attention to an experiment, which we hosted on-line as a self-test for BPMN with immediate feedback
2. A screenshot from the experiment is shown in Fig. 2. As the name suggests, the website was presented as a tool to test one’s own understanding of BPMN process models and designed such that feedback was given about errors made as well as relative performance ranking in comparison to others. Specifically, after completion of the test, a participant got feedback in different ways. First, a table was listed with the questions that were answered incorrectly along with an explanation on the correct answer. Second, each participant could see at which position of a high score list he or she ranked. Third, we offered a BPMN education course for those participants who provided their email contact details.
As the high score ranking bore the risk that participants would interpret the selftest as a competition, we had to impose countermeasures in order to avoid getting biased
2This website was hosted athttp://www.bpmn-selftest.org, but is no longer available online.
Fig. 2 A BPMN model with a comprehension question as displayed in the experiment
data. First, we included a select bottom before the test, where a participant had to state whether he had done the selftest before. In this way, we aimed to filter out repeated participants. In total, 59 participants were identified as repeaters using this select button. Second, to cover for the case that participants would conduct the selftest a second time without acknowledging repetitive participation, we introduced measures to minimize potential learning effects.
Therefore, we used two versions of each model with a slight variation in layout and randomly sampled the 30 questions.
Finally, we highlighted the activities corresponding to the comprehension question in order to minimize search time.
The selftest not only recorded results of answering questions, but also demographic data and data on MVCs.
We conducted several pilots to make sure that the questionnaire could be completed within 30 minutes, that questions were comprehensible, and that the models could be easily viewed on different screen sizes and with different internet browsers. The website was online from November 2009 until October 2010.
4 Results
We analyzed our data in four steps. First, we checked descriptive statistics and cleansed the data for outliers.
Second, we examined the data to investigate the different measures that have been proposed for MVCs. Third, from the data we develop MVCs that characterize student and practitioner subjects. Fourth, we evaluate effects of MVCs on comprehension task performance and on completion time.
4.1 Data Cleansing
As a first step we evaluated descriptive statistics with the view to perform different data cleansing and filtering
operations. First, we had to drop data from those participants who did not fully complete the experiment.
Altogether, 2199 persons started, out of which 778 completed it. The resulting completion rate is 35%, which can be considered reasonable as compared to web-survey rates of often less than 15% (Porter and Whitcomb 2003).
Furthermore, we had to filter out suspicious data points.
From pilots, we learned that it would require at least five minutes to complete the full set of 30 comprehension questions for a highly skilled process modeler. In case someone was faster, this was seen as an indication of clicking through the experiment without engaging in depth with the tasks. Therefore, we eliminated all participants who completed the experiment in less than five minutes. For this reason, 87 data points were filtered out. We also had to drop cases where participants would be interrupted while working on the selftest. If a participant took longer than 60 minutes, we decided to exclude the case in order to avoid distortions. In this way, we dropped a further 22 cases. Next, we inspected the data for outliers in two steps. First, we conducted an outlier analysis using the Stem-and-Leaf plots for the self-report data in order to identify suspicious data points. For the two independent variables ModelsRead>
500 (three participants) and ModelsCreated> 200 (two participants), we kept the data points because they showed high theory and performance values as would have been expected for an intensive modeling practice. Second, we followed the recommendation by Wohlin et al. (2000) to judge data points according to whether they are reasonable from a domain perspective. The conditions we define in the following are stricter than those being proposed by the formal outlier analysis. As a result, we excluded data points if one of the following conditions was satisfied:
– Theory< 2: We were not interested in answers
from participants without any knowledge in process
modeling. We were conservative in that we omitted not only participants that scored 0 out of 7 questions correct but also those that scored one correct answer because this may have been due to chance. This condition was the case for 42 participants. For all remaining participants, we checked whether the theory score could be ascribed to random guessing. However, a one- sample t-test with 3.5 as the test score showed that our population scored significantly higher (p = 0.00, t = 14.81) than what would have been the result of guesswork.
– ModelingYears> 40: Assuming a life-long career in process analysis, it is unlikely to have more than 40 years of modeling experience. This condition holds for 6 participants.
– Training> 75: Formal training is only realistic for a limited amount of time in a year. We assume a full- time study programm to yield the maximum reasonable value. In case of two semesters of 15 weeks lecturing, each including five days of half-day lectures, this amounts to 75 work days. Three data points are beyond this value.
– SelfEducation> 180: An outliers test with SPSS suggested all cases above 36.50 to be outliers and all values of 200 and above to be extreme values. To settle for a not overly restrictive cutoff, we assumed a person starting as a professional process analyst would not reasonably be able to consider more than every second day of the year as self-education. Thus we eliminated eight participants with reported self-education of 180 or more.
Furthermore, 59 cases of repeaters were excluded.
Finally, we excluded those 21 participants who stated they were neither student nor practitioner. For instance, a number of academics researching in the field of Business Process Management completed the experiment, and were excluded from the analysis. As some data points were identified by more than one filter, we got a cleansed data sample of 530 participants, which forms the basis for the analyzes reported below.
4.2 Defining MVCs
To determine whether MVC profiles can be defined on the basis of the traits we identified, we performed an exploratory factor analysis of the considered MVC measures. This is an appropriate technique to uncover the underlying factor structure of a large set of variables without a priori specifications of the number of factors and their loadings (Hair et al. 2010). We performed this exploratory factor analysis with four goals in mind:
1. to examine different MVCs,
2. to explore the validity and reliability of the measures used,
3. to reduce the set of variables to appropriately weighted factors resembling the different MVCs, and
4. to explore the effects of these factors on model compre- hension performance and completion time below.
First, we explored whether the data distribution assump- tions of exploratory factor analysis were met (Hair et al.
2010). The Kaiser-Meyer-Olkin measure of sampling ade- quacy was above 0.50 (0.75), and Bartlett’s test of sphericity was significant at p = 0.00 with df = 36. Thus, the use of exploratory factor analysis was warranted.
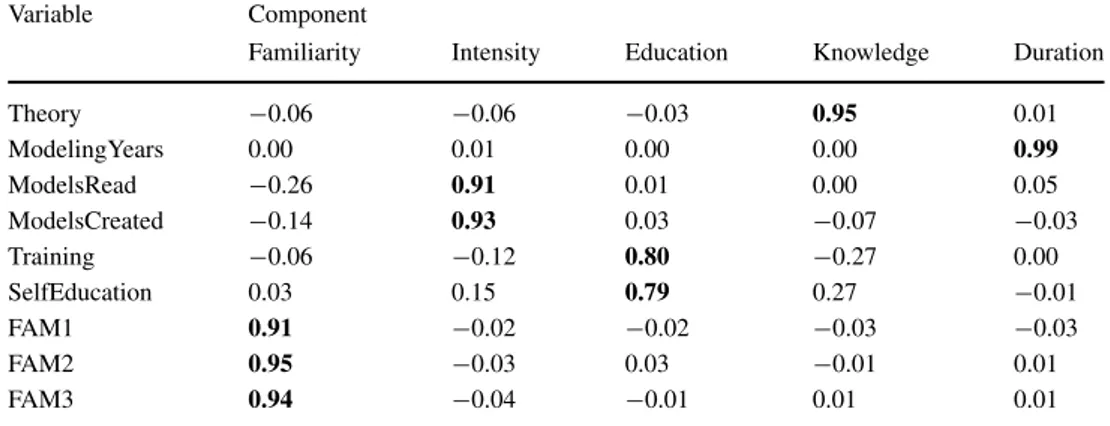
We used a principal component analysis with Varimax rotation to identify factor structures with Eigenvalues greater than 1. Several iterations of the factor analysis were conducted to identify and eliminate problematic measurement items. During this process, it became apparent that one item (“number of months working with a specific modeling grammar”) did not load appropriately on any factor. By excluding this item from the analysis, a strong 5- factor solution emerged, which we summarize in Tables 3 (descriptive statistics), 4 (item factor loadings), 5 (properties of the emerging factors), and 6 (factor correlations).
Our analysis yielded five different factors, which we define as follows:
– Familiarity: the extent to which individuals perceive themselves to be familiar with process modeling.
– Intensity: the extent to which individuals engage in process modeling within a given timeframe.
– Education: the extent to which individuals received formal education in process modeling.
– Knowledge: the extent to which individuals possess knowledge about process modeling concepts.
– Duration: the extent to which individuals have done process modeling in the past.
All items showed adequate reliability: Cronbach’s α and p
cexceeded 0.7 for all multiple-item factors except for
Table 3 Descriptive statistics of independent variables
Variable Mean St. Deviation Min Max
Theory 4.66 1.37 2 7
ModelingYears 4.17 6.62 0 37
ModelsRead 36.36 54.44 0 500
ModelsCreated 17.05 26.66 0 180
Training 5.13 9.51 0 70
SelfEducation 12.57 21.44 0 180
FAM1 3.59 1.67 1 7
FAM2 3.16 1.46 1 7
FAM3 3.58 1.49 1 7
Table 4 Factor loadings
Variable Component
Familiarity Intensity Education Knowledge Duration
Theory −0.06 −0.06 −0.03 0.95 0.01
ModelingYears 0.00 0.01 0.00 0.00 0.99
ModelsRead −0.26 0.91 0.01 0.00 0.05
ModelsCreated −0.14 0.93 0.03 −0.07 −0.03
Training −0.06 −0.12 0.80 −0.27 0.00
SelfEducation 0.03 0.15 0.79 0.27 −0.01
FAM1 0.91 −0.02 −0.02 −0.03 −0.03
FAM2 0.95 −0.03 0.03 −0.01 0.01
FAM3 0.94 −0.04 −0.01 0.01 0.01
Bold entries are statistically significant atp <0.05.
education. The low value for education is not a surprise because of the formative character of this factor. Education is based on formal training and self education, which can only be partially expected to correlate. For the single-item factors, the commonality h
2exceeded 0.9 respectively. The standard deviations of all factors were above 1, suggesting adequate variance in the scales. All factors were correlated with each other, with the highest correlations being between Intensity and Familiarity (-.37), see Table 6). Internal consistency, discriminant validity, and convergent validity were tested by extracting the factor and cross loadings of all indicator items to their respective latent constructs. The results, presented in Table 4 and Table 5, indicate that all items loaded on their respective construct from a lower bound of 0.79 to an upper bound of 0.99, and higher on their respective construct than on any other. Furthermore, each item’s factor loading on its respective construct was highly significant (at least at p < 0.01). Convergent validity was further supported by all composite reliabilities p
cbeing 0.83 or higher and AVE of each construct being 0.85 or higher. Discriminant validity was supported by showing that the AVE of each construct was higher than the squared correlation between any two factors (the highest squared correlation was 0.15 between Intensity and Familiarity).
In turn, our analysis yielded five largely disjoint traits of
Table 5 Factor properties
Factor Reliability pc Communality AVE
Familiarity 0.93a 0.99 0.88 0.94
Intensity 0.73a 0.97 0.86 0.93
Education 0.33a 0.83 0.73 0.85
Knowledge 0.93b − 0.91 0.95
Duration 1b − 1.00 1.00
aBased on Cronbach’sα.
bBased on Commonality h2 as suggested by Christophersen and Konradt (2011).
MVCs. In the following, we will thus explore how these traits enable us to explain and predict model interpretation in terms of comprehension performance across students and practitioners.
4.3 MVCs of Students and Practitioners
Having identified five MVC traits, we now seek to explore the profile of participants that belonged to one of two key user groups (viz., students and practitioners). In particular, we aim at examining the typical MVCs associated with these groups and how these profiles differ across the groups. Our interest was to ascertain whether practitioners and students as experimental subjects vary substantially, as suggested (Compeau et al. 2012). If so, it would be interesting to investigate how MVCs, as identified above, might be used to discriminate between students and professionals.
To that end, we ran a multivariate analysis of variance (MANOVA), with the variable P osition as an indepen- dent factor and the five total factor scores of the identified MVC traits as dependent variables. As a preparatory check, we computed regressed total factor scores, all of which behaved approximately normal and independent samples t-test between the MVC variables by students and prac- titioners, the results of which were significant for some variables. Table 7 gives the MANOVA results. The data shows that, indeed, the profiles of the two subject groups are significantly different for each modeling MVC dimension, except for the factor Education. Table 7 illustrates that stu- dents appear to have a higher F amiliarity with BPMN and a slightly higher Education (but not significantly so). By contrast, practitioners score considerably and significantly higher on I ntensity, Knowledge, and Duration.
Altogether, it can be seen that the profiles between the
two user cohorts are, except for Education, largely and
significantly different, as visualized in Fig. 3. Notably,
practitioners have longer and more intensive engagement in
Table 6 Factor correlations
Factor Familiarity Intensity Education Knowledge Duration
Familiarity 1.00
Intensity −0.37 1.00
Education −0.14 0.09 1.00
Knowledge −0.13 0.16 −0.02 1.00
Duration −0.19 0.14 −0.03 0.05 1.00
process modeling work (I ntensity and Duration), whereas students have higher perceptions of F amiliarity.
Differences in Knowledge and Education appear marginal.
4.4 Effects of MVCs
At this point, we have seen that MVC profiles of students and practitioners are largely different. In our final analysis, we now examine how well the identified five MVCs allow the explanation of model comprehension performance and completion time.
To that end, we first computed the weighted total factor scores for the five MVCs emerging from our factor analysis.
Table 8 summarizes descriptive statistics about the factors.
All factors were normalized to a mean of 0.00 (and thus have a standard deviation 1.00).
Next, we performed two MANOVA, one with compre- hension performance (comprehension) and one with com- pletion time (time) as dependent variable. In both analyses, we included Position and Layout as independent variables and the five identified MVC factors as covariates. Box’s test of equality of covariance matrices had a value of 0.175 indicating that the assumptions are met. Levene’s test of equality of error variances was indicating a violation of the assumption except for Model 4.
4.4.1 Effects of MVCs on Task Performance
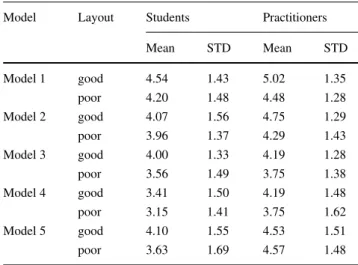
Tables 9 and 10 illustrate the results of the comprehension performance analysis. The results show that particularly Layout is a significant factor for predicting comprehension performance. Both students and practitioners perform significantly better when a model is laid out well. While this effect is not significant for Model 5, we still observe that the Model 5 comprehension performance of the students is higher for the well laid out model and that the Model 5 comprehension performance for good and bad layout of the practitioners 5 is almost equal. The importance of Layout is further highlighted by the fact that the variable Position cannot explain the differences in comprehension performance for any of the models. While we do see a slightly better performance of the practitioners, this difference is statistically insignificant.
With respect to the identified MVCs, we observe that Familiarity, Intensity, and Knowledge can be used to explain performance differences. Both Familiarity and Knowledge are significant for all 5 models. Intensity is significant for models 1, 3, 4, and 5. Interestingly, Education and Duration are not significant for any of the models. This shows that neither the formal education the participant has received nor the extent to which the participant has done process modeling in the past are good
Table 7 Multivariate analysis
of variance on MVCs Dependent Var. Group N Mean St. Dev. F (Sig.) η2p
Familiarity Students 333 0.26 1.00 68.28 0.12
Practitioners 197 -0.44 0.82 (0.00)
Intensity Students 333 -0.24 0.56 58.44 0.09
Practitioners 197 0.41 1.38 (0.00)
Education Students 333 0.02 1.01 0.62 0.01
Practitioners 197 -0.04 0.98 (0.43)
Knowledge Students 333 -0.08 1.00 6.17 0.01
Practitioners 197 0.14 0.97 (0.01)
Duration Students 333 -0.17 0.82 28.31 0.05
Practitioners 197 0.29 1.18 (0.00)
Bold entries are statistically significant atp <0.05.
Fig. 3 Average values of MVCs of students and practitioners
predictors for performance in this experiment. By contrast, self-reported familiarity (Familiarity), actual knowledge about the notation (Knowledge), and intensity with which process modeling was used (Intensity) are good predictors for comprehension performance. Importantly, interactions hardly contribute to explaining performance differences.
Altogether, the MANOVA for comprehension perfor- mance shows that layout and a particular set of MVCs, i.e.
Familiarity, Intensity, and Knowledge, turn out to be signif- icant factors for comprehension performance. Interestingly, the mere fact that a participant is a student or practitioner is not significant in explaining performance differences.
4.4.2 Effects of MVCs on Completion Time
Tables 11 and 12 illustrate the results of the completion time analysis. They show that Layout is also an important factor for predicting completion time. The analysis reveals that all models with good layout had significantly faster completion times. This holds for both practitioners as well as students.
As opposed to the comprehension performance analysis, the variable Position is significant for Model 1, 3, 4, and 5. Interestingly, students completed the comprehension task significantly faster than practitioners. A possible explanation for this observation may be general familiarity of students with problem solving tasks due to regular exams.
With respect to the MVCs, there is no central factor emerging from the analysis. In line with comprehension
Table 8 Descriptive statistics about factors
Factor Range Min Max
Familiarity 4.73 −2.05 2.68
Intensity 6.66 −1.10 5.56
Education 6.74 −0.91 5.84
Knowledge 6.25 −2.51 3.74
Duration 4.90 −0.95 4.95
Table 9 Descriptive statistics about comprehension performance
Model Layout Students Practitioners
Mean STD Mean STD
Model 1 good 4.54 1.43 5.02 1.35
poor 4.20 1.48 4.48 1.28
Model 2 good 4.07 1.56 4.75 1.29
poor 3.96 1.37 4.29 1.43
Model 3 good 4.00 1.33 4.19 1.28
poor 3.56 1.49 3.75 1.38
Model 4 good 3.41 1.50 4.19 1.48
poor 3.15 1.41 3.75 1.62
Model 5 good 4.10 1.55 4.53 1.51
poor 3.63 1.69 4.57 1.48
performance, we observe significant effects of Familiarity and Knowledge for Model 3 and 5, and Intensity for Model 4, but not for the other models. In addition, the MVC Duration is significant for Model 1. Altogether, it appears as if none of the MVCs is a good predictor for completion time.
For interactions, there are hardly any consistent patterns that emerge. Apparently, interactions are of minor relevance also for completion time.
5 Discussion
This section discusses the implications of our research findings. Section 5.1 summarizes the results. Section 5.2 discusses implications for research. Section 5.3 clarifies potential threat to validity of this research.
5.1 Summary of Results
We set out to empirically examine how modeling expertise
relates to model comprehension performance and, based
on the results, develop and explore a multi-dimensional
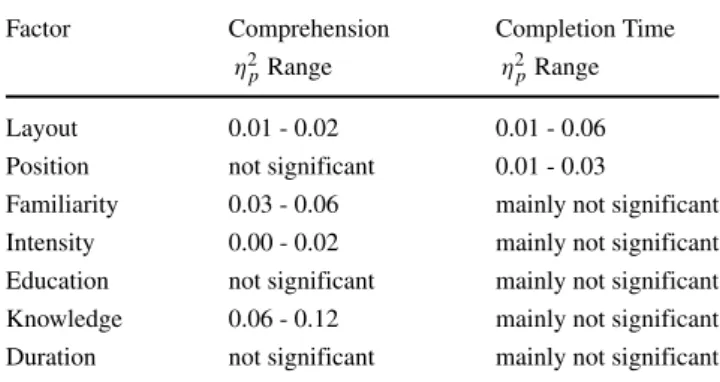
profile of modeling expertise. Table 13 summarizes the
results. Note that η
2phave been suggested to indicate small,
medium and large effects for values of 0.01, 0.06 and 0.14,
respectively (Kirk 1996; Field 2013). It shows that layout
plays a significant role for both comprehension performance
as well as completion time. The position of a participant
(student versus practitioner), by contrast, can only explain
differences in completion time. As for the five MVCs,
we observe that Familiarity, Intensity, and Knowledge can
be used to explain performance differences. Education as
well as Duration were not significant in this context. With
respect to completion time, none of the MVCs appears to be
a good predictor.
Table10Multipleanalysisofvarianceoncomprehensionperformance FactorModel1Model2Model3Model4Model5 F(Sig.)η2 pF(Sig.)η2 pF(Sig.)η2 pF(Sig.)η2 pF(Sig.)η2 p Between-Subjects Layout9.03(0.00)0.027.14(0.01)0.0111.56(0.00)0.0210.20(0.00)0.022.75(0.10)0.01 Position0.38(0.84)0.001.01(0.32)0.002.20(0.14)0.002.25(0.13)0.002.69(0.10)0.01 Within-Subjects Familiarity13.02(0.00)0.0324.29(0.00)0.0519.93(0.00)0.0432.17(0.00)0.0619.22(0.00)0.04 Intensity5.21(0.02)0.011.13(0.29)0.0010.71(0.00)0.025.97(0.02)0.014.79(0.03)0.01 Education0.00(0.95)0.000.20(0.66)0.002.81(0.09)0.010.02(0.88)0.003.09(0.08)0.01 Knowledge31.27(0.00)0.0651.16(0.00)0.0967.45(0.00)0.1233.44(0.00)0.0651.60(0.00)0.09 Duration0.30(0.58)0.000.14(0.70)0.002.61(0.11)0.010.09(0.77)0.000.01(0.92)0.00 Interactions Layout*Familiarity4.84(0.03)0.010.13(0.72)0.001.31(0.25)0.001.09(0.30)0.000.56(0.45)0.00 Layout*Intensity0.10(0.75)0.004.12(0.04)0.010.07(0.79)0.002.17(0.14)0.001.28(0.26)0.00 Layout*Education0.01(0.92)0.000.07(0.80)0.000.10(0.75)0.000.05(0.82)0.003.48(0.06)0.01 Layout*Knowledge2.39(0.12)0.002.04(0.15)0.000.09(0.77)0.000.03(0.86)0.001.86(0.17)0.00 Layout*Duration0.12(0.73)0.001.44(0.23)0.000.36(0.55)0.000.46(0.50)0.000.49(0.48)0.00 Boldentriesarestatisticallysignificantatp<0.05.
Table 11 Descriptive statistics about completion time
Model Layout Students Practitioners
Mean STD Mean STD
Model 1 good 225.11 156.05 249.34 135.30
poor 284.37 173.22 369.76 172.21
Model 2 good 219.70 201.90 226.93 93.09
poor 283.03 169.95 351.69 204.83
Model 3 good 204.05 97.16 261.65 173.98
poor 245.36 145.36 328.22 161.01
Model 4 good 270.61 223.97 313.81 198.47
poor 293.10 158.30 398.54 252.88
Model 5 good 216.58 115.89 265.85 138.27
poor 268.91 165.99 351.43 197.76
5.2 Implications
Our specific aim was to explore three key assumptions prevalent in the literature in this domain, viz., (1) the significance of MVCs for predicting model comprehension performance, (2) potential implications of the (often) uni- dimensional measurement of MVCs, and (3) the use of students as adequate proxies for modeling practitioners.
With respect to (1), our results show that MVCs are key factors contributing to an accurate understanding of process models. One interpretation is to discuss the utilized MVCs and their connection with expertise. Our findings support extant literature, which presumes that the cognitive load of understanding an external schema can indeed be reduced by having expertise in terms of effective storage and processing strategies for these models (Sweller and Chandler 1994). It must be noted that the overall concept of expertise is insufficiently covered by the MVCs used in this study and preceding model comprehension experiments.
The complexity of expertise (Chi et al. 2014) and the diversity of task facets (Spence and Brucks 1997; Reuber 1997; Jacoby et al. 1986) call for theoretical research to complement our empirics-driven approach.
With respect to (2), we find evidence that an appro- priate measurement of MVCs requires at least the record- ing of several factors. This is interesting because general research on expertise emphasizes its task specificity and continuous deliberate practice (Ericsson et al. 2007). Fur- thermore, the different MVCs used in prior literature show different effects on the development of model understand- ing. We empirically found that MVCs relate to different factors, some of which are connected with comprehen- sion performance (I ntensity, Knowledge, F amiliarity and Duration) and some of which may be irrelevant (Education), while apparently the impact on task comple- tion time is quite different (primarily driven by secondary notation, specifically layout here). Research including (Topi
and Ramesh 2002; Batra et al. 1990) can serve as a starting point to integrate these findings into a theoretical model.
With respect to (3), we find that students are distinctively different from practitioners. Specifically, our analysis shows that these groups have significantly different MVC profiles.
Their performance results may differ as well. While the difference in performance appears to be more related to MVCs, the difference in completion time turns out to be significantly connected with the student or practitioner position. These results call for more research to investigate these diverging patterns. Potentially additional factors will have to be included, such as cognitive abilities (Recker et al.
2014), limitations of sight (Permvattana et al. 2013) or risk aversion (Cox et al. 2014). What becomes clear though is the fact that the discussion of the student versus practitioner dichotomy only touches the problem at the surface. The underlying factors of performance differences of these two groups appear to be related to MVC profiles.
Clearly, these points emphasize the need to develop new measurement instruments for MVCs from scratch. The measures of F amiliarity, I ntensity, and Knowledge might be building blocks to be integrated. We also see the potential of not only developing better measurement items for surveys, but for using alternative means of objective measurement. For example, recent studies on process model comprehension by Petrusel et al. (2016) and Petrusel et al.
(2017) utilize eye-tracking devices and find that measures of visual cognition explain comprehension performance well.
The more broader potential of neuroscience in this area
is highlighted by Davis et al. (2017). As long as such
new measures are not available, experimenters are advised
to record F amiliarity, I ntensity, and Knowledge as
used in this study and use them as covariates in their
analysis. Furthermore, prior studies should be replicated
with these measures being added in the data analysis. The
AIS Transactions on Replication Research are an excellent
outlet where these studies can be reported.
Table12Multipleanalysisofvarianceoncompletiontime FactorModel1Model2Model3Model4Model5 F(Sig.)η2 pF(Sig.)η2 pF(Sig.)η2 pF(Sig.)η2 pF(Sig.)η2 p Between-Subjects Layout35.41(0.00)0.0630.47(0.00)0.0619.28(0.00)0.045.96(0.01)0.0126.82(0.00)0.05 Position6.02(0.01)0.013.14(0.08)0.0113.54(0.00)0.035.08(0.02)0.018.23(0.00)0.02 Within-Subjects Familiarity1.47(0.23)0.001.87(0.17)0.007.21(0.01)0.012.69(0.10)0.014.83(0.03)0.01 Intensity0.00(0.96)0.000.10(0.76)0.000.05(0.83)0.005.97(0.01)0.011.85(0.17)0.00 Education0.01(0.94)0.000.09(0.76)0.000.19(0.66)0.002.89(0.09)0.011.45(0.23)0.00 Knowledge0.03(0.86)0.000.19(0.67)0.005.02(0.03)0.010.03(0.87)0.005.50(0.02)0.01 Duration4.69(0.03)0.011.00(0.32)0.000.04(0.84)0.000.11(0.74)0.000.18(0.67)0.00 Interactions Layout*Familiarity4.06(0.04)0.012.86(0.09)0.010.80(0.37)0.007.76(0.01)0.011.13(0.29)0.00 Layout*Intensity0.37(0.55)0.002.99(0.08)0.010.18(0.67)0.006.12(0.01)0.010.25(0.62)0.00 Layout*Education0.11(0.74)0.001.15(0.28)0.000.24(0.63)0.003.32(0.07)0.010.50(0.48)0.00 Layout*Knowledge1.71(0.19)0.0012.03(0.00)0.020.44(0.51)0.008.90(0.00)0.020.11(0.74)0.00 Layout*Duration7.53(0.01)0.010.09(0.76)0.000.44(0.51)0.001.50(0.22)0.000.19(0.66)0.00 Boldentriesarestatisticallysignificantatp<0.05.