Energie & Umwelt / Energy & Environment
Member of t he Helmholtz Association
Energie & Umwelt / Energy & Environment
Photochemistry of Highly Oxidized Multifunctional Organic Molecules:
a Chamber Study
Laura Iida Maria Pullinen
Photochemistry of
Highly Oxidized Multifunctional Organic Molecules:
a Chamber Study
Inaugular-Dissertation zur
Erlangung des Doktorgrades
der Mathematisch-Naturwissenschaftlichen Fakultät der Universität zu Köln
vorgelegt von Laura Iida Maria Pullinen
aus Iitti
Cologne, 2017
Berichterstatter: Prof. Dr. Andreas Wahner PD Dr. Mathias Schäfer Prüfungsvorsitzender: Prof. Dr. Tibor Dunai Beisitzer: Dr. Michael von Papen
Tag der mündlichen Prüfung: 24.10.2016
Forschungszentrum Jülich GmbH
Institute of Energy and Climate Research Troposphere (IEK-8)
Photochemistry of Highly Oxidized Multifunctional Organic Molecules:
a Chamber Study
Laura Iida Maria Pullinen
Schriften des Forschungszentrums Jülich
Reihe Energie & Umwelt / Energy & Environment Band / Volume 387
ISSN 1866-1793 ISBN 978-3-95806-260-3
Bibliographic information published by the Deutsche Nationalbibliothek.
The Deutsche Nationalbibliothek lists this publication in the Deutsche Nationalbibliografie; detailed bibliographic data are available in the Internet at http://dnb.d-nb.de.
Publisher and Forschungszentrum Jülich GmbH Distributor: Zentralbibliothek
52425 Jülich
Tel: +49 2461 61-5368 Fax: +49 2461 61-6103 Email: zb-publikation@fz-juelich.de www.fz-juelich.de/zb
Cover Design: Grafische Medien, Forschungszentrum Jülich GmbH Printer: Grafische Medien, Forschungszentrum Jülich GmbH Copyright: Forschungszentrum Jülich 2017
Schriften des Forschungszentrums Jülich
Reihe Energie & Umwelt / Energy & Environment, Band / Volume 387 D 38 (Diss., Köln, Univ., 2017)
ISSN 1866-1793 ISBN 978-3-95806-260-3
The complete volume is freely available on the Internet on the Jülicher Open Access Server (JuSER) at www.fz-juelich.de/zb/openaccess.
This is an Open Access publication distributed under the terms of the Creative Commons Attribution License 4.0,
which permits unrestricted use, distribution, and reproduction in any medium, provided the original work is properly cited.
Zusammenfassung
Hoch oxidierte multifunktionale Moleküle (HOMs) sind eine Klasse von Molekülen deren Existenz in der Gasphase erst kürzlich nachgewiesen wurde. Wegen ihrer hohen O:C Verhältnisse haben HOMs geringe Dampfdrücke und spielen sie eine bedeutende bei der Neubildung von Partikeln und deren Wachstum.
Mit dem Ziel ein besseres Verständnis der Mechanismen der Partikelbildung zu erhalten, wurden in dieser Arbeit die photochemische Bildung von HOMs, deren chemische Umwandlungen sowie deren Verlustprozesse untersucht.
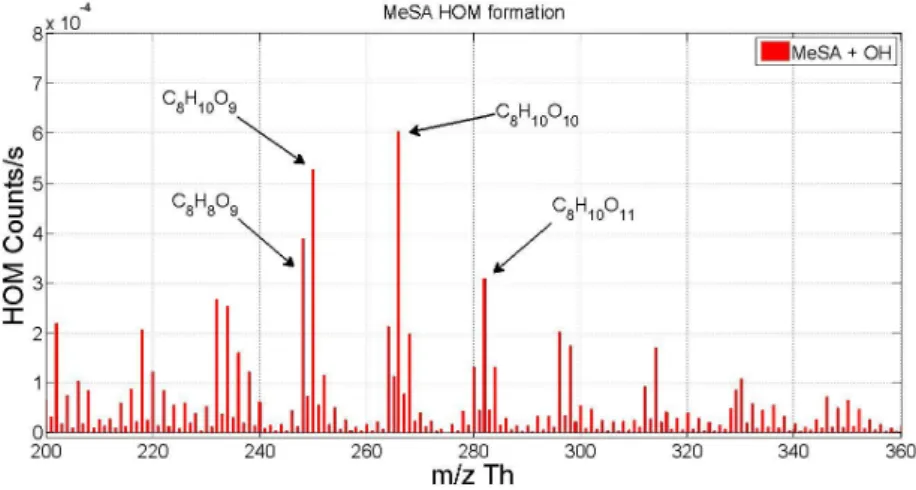
OH its das hauptsächliche Oxidtionsmittel in der Troposphäre. Trotzdem wurde die photochemische Bildung von HOMs bislang nicht intensiv untersucht, sondern hauptsächlich deren Bildung aus der Ozonolyse. Es stellte sich daher die Frage nach der Bedeutung der Photochemie bei der Bildung der HOMs. In Fokus der Arbeiten stand die HOM Bildung aus -Pinen, es wurde aber auch die photochemische HOM Bildung aus -Pinen, Methyl salicylat und Benzol nachgewiesen. Methyl salicylat und Benzol haben keine Doppelbindung und reagieren somit nicht mit Ozon. Der Nachweis der HOM Bildung aus diesen bedeutenden biogen- bzw. anthropogen emittierten Verbindungen weist darauf hin, dass auch Reaktionen mit OH eine wichtige Quelle für HOMs sind.
Dominierender Mechanismus der photochemischen HOM Bildung ist die Autoxidation, d.h. die sequentielle Anlagerung von O
2an Alkylradikale, die sich nach interner H-Migration aus Peroxy- oder Alkoxyradikalen bilden. Die Autoxidation muss sehr effektiv ablaufen da eine Verringerung der O
2Mischungsverhältnisse auf unter 1% keinen Einfluss auf die HOM Bildung zeigte.
Sequentielle Reaktionen mit OH sind weniger bedeutend obwohl die weitere Oxidation von in hohen Konzentrationen auftretenden Oxidationsprodukten als Quelle von HOMs nicht ausgeschlossen ist. Die Ausbeute von HOMs aus der Photooxidation von a-pinen sind abhängig von der OH Konzentration und wurden zu 1.8 and 7% abgeschätzt.
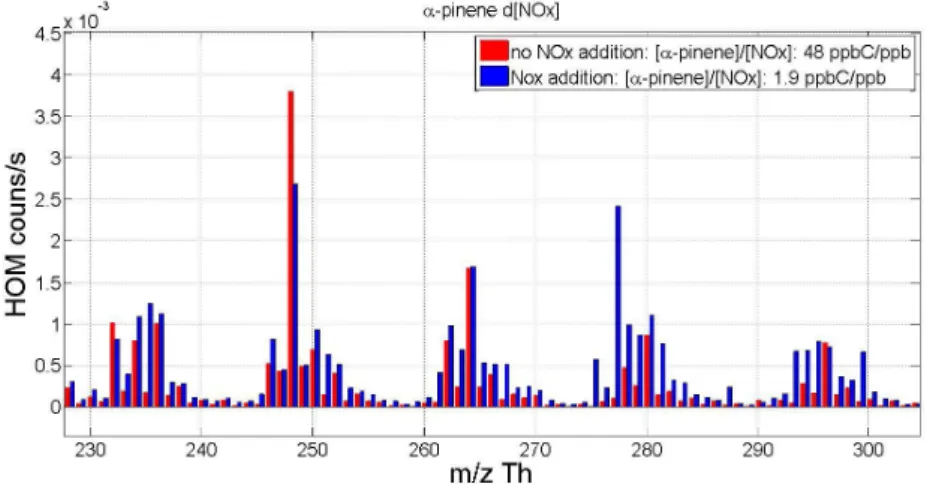
Die Zugabe von Stickoxiden (NO
X) führte zur Bildung organischer Nitrate und zu insgesamt verstärkter HOM Bildung. Die Bildung der organischen Nitrate bestätigte die vorherige Zuordnung der Moleküle als Peroxyradikale, Hydroperoxyde und Ketone. Die insgesamt verstärkte HOM Bildung kam durch erhöhtes [OH] zustande was seinerseits auf die Rezyklierung von OH über die Reaktion von NO mit HO
2zurückgeführt wurde. Auch bei sehr hohen [NOx] konnte die Bildung von Terminierungsprodukten aus RO
2+ RO
2Reaktionen nachgewiesen werden. Grund hierfür ist wahrscheinlich eine Rückbildung von Peroxyradikalen aus Alkoxyradikalen die nicht zerfallen. H-Migration im Alkoxyradikal führt zu einem Alkylradikal und nachfolgender Anlagerung von O
2und Bildung eines Peroxyradikals. Wie auch Experimente mit CO zeigten, folgt die Umwandlung von HOMs der klassischen Vorstellung der Chemie von Peroxyradikaln.
Wichtige Senke für HOMs ist deren Kondensation auf Partikeln. Hierfür wurden effektive
Aufnahmekoeffizienten bestimmt. Für Monomere lagen diese im Bereich von 0.5-0.9 Für Dimere bei
eins. Schon bei Massendichten von etwa 3 µg m
-3konnte die Beeinflussung der Chemie von
Peroxyradikalen durch Partikel gezeigt werden. Möglicherweise ist dieser Einfluss in der realen
Atmosphäre stärker als in der genutzten Reaktionskammer, zur Abschätzung der Bedeutung dieses
Einflusses bedarf es aber mehr Experimente als in dieser Arbeit durchgeführt werden konnten.
Abstract
Highly oxidized multifunctional organic molecules (HOMs) are a newly-found class of compounds that are formed in volatile organic compound (VOC) oxidation. Due to high O:C ratios of the HOMs, they are suggested to participate in atmospheric processes, such as new particle formation (NPF) and particle mass formation. Thus studying HOMs gives important insight into mechanisms of particle formation and growth under different chemistry regimes.
OH is the main oxidant during daytime chemistry, however so far the photochemical HOM formation has not been studied in detail. This study focusses on the photochemical HOM production from
-pinene, on chemical transformation of HOMs as well as on their loss processes.
Autoxidation was found to be a dominant process of photochemical HOM formation. However, comparison of the photochemical HOM patterns from α-pinene and its main primary oxidation product pinonaldehyde showed that also secondary OH oxidation is likely to contribute to some extent. In one experiment the oxygen content of the chamber during the experiment was lowered below 1% and the HOM formation was not affected, which indicates that autoxidation must be very fast.
OH oxidation of pinonaldehyde, β-pinene, cyclohexene, benzene, and methyl salicylate led to HOM formation. If at all, these compounds do not react efficiently with ozone, suggesting that photooxidation might be a source of HOMs in general. The effect of photochemistry on HOM formation from -pinene was studied in more detail. The yield of HOMs from α-pinene photooxidation was found to depend on [OH] and estimated to be between 1.8 and 7%.
Adding NO
Xled to the formation of organic nitrates as well as to a general increase of HOM formation.
The formation of organic nitrates confirmed the assignment of HOMs being peroxy radicals. The general increase of HOM formation observed up to moderate NOx levels was mainly due to OH recycling by HO
2+ NO reactions leading to increased [OH]. Additionally, the presence of NO
Xalso activated the
“alkoxy-peroxy pathway”. Alkoxy radicals formed in reactions of NO with peroxy radicals might undergo internal H-shifts and subsequent O
2additions, instead of degrading. This pathway can form peroxy radicals and explain why even at very high [NOx] there were still termination products of RO
2+ RO
2reactions observable.
High [HO
2] favoured hydroperoxide formation and diminished formation of other termination products.
Altogether, the behaviour of HOMs was compatible to classical models of peroxy radical chemistry.
Effective uptake coefficients for HOMs on particles were determined to be in the range of 0.5-0.9 for
monomers and unity for dimers. At mass loads above ~ 3 µg m
-3impacts of particles on peroxy radical
chemistry became obvious suggesting an impact of particles on photochemistry also under atmospheric
conditions.
Table of Contents
Zusammenfassung V
Abstract VI
Table of Contents VII
1. Introduction 1
1.1. Highly oxidized multifunctional organic molecules (HOMs) in the atmosphere 1 1.2. Formation mechanism of highly oxidized multifunctional organic molecules via
ozonolysis 3
1.3. Volatile organic compounds (VOC) in atmospheric photochemistry 5
2. Methods and experimental set-up 10
2.1. Experiment set-up 10
2.1.1. Jülich Plant Atmosphere Chamber 10
2.1.2. General instrumentation 12
2.2. Chemical ionization mass spectrometer 12
2.2.1. Instrument introduction 12
2.2.2. Calibration 17
2.3. Experiment protocols 19
2.3.1. Experiment overview 20
3. Photochemical HOM formation mechanism: Sequential oxidation versus autoxidation 25 3.1. HOM formation and autoxidation: setting the problem 25
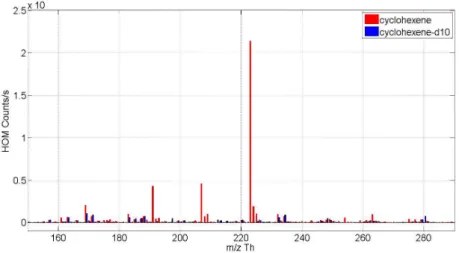
3.2. Cyclohexene versus cyclohexene-d10 26
3.3. Monoterpenes: α-pinene 27
3.3.1. Photochemical HOM formation α-pinene 27
3.3.2. HOM formation from secondary OH oxidation: pinonaldehyde 29
3.4. HOM formation rate comparison 31
3.5. Effect of OH concentration on end product pattern 32
3.6. Conclusion: Autoxidation versus sequential oxidation 34 3.7. Experiment to study the role of O
2in the photochemical HOM formation 34 3.8. Photochemical HOM formation under reduced influence of ozonolysis 37
3.8.1. Photochemical HOM formation from β-pinene 37
3.8.2. Photochemical HOM formation from methyl salicylate and benzene 38
4. Photochemical HOM production 41
4.1. OH dependency of photochemical HOM from α-pinene 41
4.2. Yield estimation from photochemical HOM production from α-pinene 50 4.3. Photochemical HOM production from exocyclic double bonds: β-pinene 52
4.4. Concluding remarks on photochemical HOM production 54
5. Chemical transformation of HOMs 55
5.1. Photochemistry of α-pinene in the presence of NO
x55
5.1.1. Formation of organic nitrates and PAN-like nitrates 58 5.1.2. The effect of NO
Xon peroxy radical chemistry 59
5.2. Photochemistry of β-pinene in the presence of NO
X68
5.3. CO + HOMs 71
5.4. Concluding remarks on chemical transformation HOMs 77
6. Sinks of HOMs: condensation on particles and wall loss 79
6.1. Condensation on particles 82
6.2. Concluding remarks 91
7. Summary and Conclusions 93
References i
Appendix viii
Abbreviations xv
Acknowledgements xvii
Chapter 1 Introduction
1.1 Highly oxidized multifunctional organic molecules in the atmosphere
Volatile organic compounds (VOC) are important players in atmospheric chemistry. VOC are emitted either from biogenic or anthropogenic sources. They are mainly pure hydrocarbons and are easily oxidized by the major atmospheric oxidants, OH, ozone and NO
3. The oxidation products of VOC contribute to the formation of secondary organic aerosols (SOA), either by condensation of existing particles or by new particle formation. The oxidation products formed according to established understanding of atmospheric VOC oxidation (e.g. Master Chemical Mechanism 3.3.1.) have too low oxygen content and are thus too volatile to directly contribute to SOA formation. However, the oxygen number is crucial, as increasing the amount of oxygen in a molecule will lower its vapour pressure making it less volatile. So, high oxidation degree of the oxidation products is required to participate in particle formation and growth. It was proposed, that higher oxidation degrees should be achieved by sequential, multiple oxidation of the first generation oxidation products by the OH radical. Besides chemical ageing via sequential oxidation, accretion reactions in the particle phase are forming high molecular oligomers with low vapour pressures (Hallquist et al., 2009).
The search for the non-volatile organic molecules explaining the observed new particle and SOA formation received a new angle when Ehn et al. (2010; 2012; 2014) discovered a new class of organic molecules in measurements made in Hyytiälä, SMEAR II boreal forest measurement station (Finland).
Using a new instrument called Atmospheric Pressure interface Time of Flight Mass Spectrometer (APi-TOF-MS) they detected a group of naturally negatively charged organic molecules dominating the night-time spectrum at masses between 280-650 Th. These molecules had very high O/C ratios, and were named highly oxidized multifunctional molecules (HOMs)
Several studies show that observed HOMs are obviously produced very fast by -pinene ozonolysis in gas phase, i.e. by reaction of a monoterpene (a VOC class with large atmospheric source strength) with one of the major atmospheric oxidants, O
3(Jokinen et al., 2014; Mentel et al., 2015; Rissanen et al., 2015; Berndt et al., 2015; Kurtén et al., 2015).
The atmospheric relevance of HOMs is based on their role in the formation of secondary organic aerosols (SOA) because SOA themselves are important atmospheric compounds. Atmospheric aerosols (particles and the surrounding gas medium) in general have effect on human health and on climate (Nel, 2005; IPCC, 2013). They can scatter and absorb solar radiation, and act as cloud condensation nuclei (CCN), as well as regulate cloud properties (Rosenfeld et al., 2008; Clement et al., 2009). Aerosol particles are also counted as pollution deteriorating air quality (Nel, 2005). A large fraction (up to 90%) of atmospheric sub-micrometre particle mass consists of organic compounds (Jimenez et al., 2009).
To assess the relevance of HOMs on SOA formation it is required to understand the role of organic vapours in new particle formation (NPF) and particle growth, as well as on CCN formation. It was long believed that sulfuric acid is driving new particle formation (Kulmala et al., 2004; Weber et al., 1996;
Kerminen et al., 2010; Sipilä et al., 2010), and atmospheric SA has been showed to be linked to particle
formation and growth (Kulmala et al., 2013). However there was a need for additional vapours, likely organic, to explain observed particle formation and growth rates (Kurtén et al., 2008; Loukonen et al., 2010; Ortega et al., 2016; Paasonen et al., 2012; Kulmala et al., 2013), and the role of organic vapours had been hypothesised and tested before (Hoffmann et al., 1998; Yu et al., 1999; Metzger et al., 2010;
Paasonen et al., 2010; Wang et al., 2010; Riipinen et al., 2011). ). Also the location of NPF (often clean atmosphere at forested regions with low SA concentration) gives reason to believe SA alone cannot explain all particle formation events (Zhang et al., 2004; Metzger et al., 2010; Paasonen et al., 2010;
Donahue et al., 2011; Riipinen et al., 2011, 2012; Ehn et al., 2012, 2014; Riccobono et al., 2014;
Schobesberger 2013; Kulmala et al., 2013). However, directly measuring these theorized organic compounds was not possible until development of APi-TOF-MS.
Ehn et al. (2014) report on the role of organics (HOMs) on SOA mass formation, and to highlight it they introduce a new concept, extremely low-volatility organic compound (ELVOC), in analogy to the style of pre-existing terms such as low-volatility organic compounds (LVOC) and semi-volatile organic compounds (SVOC). Due to structural properties HOMs are suggested to irreversibly condense on particles, and thus contribute to the growth. The relative importance of HOMs to growth was highest at low particle loading/surface, when nearly all of the growth could be attributed them. Ehn et al. (2014) compar measurements from AMS (Aerosol Mass spectrometer) to the HOMs data, and offer the similarity of O/C and H/C ratios of HOMs to those measured from formed SOA as further evidence of the role of HOMs on particle growth.
From these studies it can be concluded that in the critical range of particle growth, presence of HOMs in the atmosphere can differentiate whether particles grow to relevant sizes. The studies mentioned here concentrate on clean boreal atmosphere (Kulmala et al. 2013) and monoterpene ozonolysis (Ehn et al., 2014), so the importance of HOMs and organics on SOA formation in more polluted areas cannot be concluded yet. HOMs are the (at least one of the) group of organic vapours that have been suggested to be relevant in NPF (Schobesberger et al., 2013; Ehn et al., 2014; Jokinen et al., 2015; Tröstl et al., 2016;
Bianchi et al., 2016).
To conclude, Figure 1.1 depicts the relative importance of different vapours in the atmosphere to
particle formation and growth as suggested by Ehn et al. (2014). As can be seen, at the very small scale,
clusters of few molecules, sulphuric acid and amines/ammonia constitute most of the particle. When
the cluster grows, organic vapours (ELVOC/HOMs) begin to contribute to growth, until the particle is
large enough and eventually also low-volatility and semi-volatility organic compounds begins to
condense, and contribute to growth. Ehn et al. (2014) show results from ambient measurements at
Hyytiälä SMEAR II forest station to show how the HOM concentrations measured are abundant enough
to explain the growth of particles in the range of 5-50 nm.
Figure 1.1 Relative importance of ELVOC to particle growth (Ehn et al., 2014).
1.2. Formation mechanism of oxidized multifunctional organic molecules via ozonolysis.
Ozone is one of the main oxidants during night time chemistry, and a tropospheric pollutant. It is also involved in primary OH production (R1.3a-b) and it has two important sources in the troposphere. One source is the intrusion from the Stratosphere leading to a background level; the other is photochemical ozone production. Main precursor of O
3during photochemical production is NO
2that can be photolyzed at wavelengths below 430 nm:
NO
2+ h ( < 430 nm) -> O + NO (R1.2a)
O +O
2+ M -> O
3+ M (R1.2b)
Ozone is reactive towards VOC with C=C double bond, such as unsaturated alkenes.
RH + O
3-> R˙ + OH -> RO
2˙ (R1.2c)
The formed peroxy radical then has classical pathways to terminate (see R1.3c-R1.3i).
It has been established that ozonolysis produces highly oxidized multifunctional compounds, HOM (Ehn
et al., 2012; Ehn et al., 2014; Jokinen et al., 2014; Mentel et al., 2015; Berndt et al., 2015; Rissanen et
al., 2015; Hyttinen et al., 2015). The pathway to ozonolysis HOM formation has been suggested to be
autoxidation and peroxy radical formation (i.e. Ehn et al., 2012, 2014; Mentel et al., 2015; Rissanen et al., 2015).
Mentel et al. (2015) suggest a detailed mechanism of alkene ozonolysis HOM formation. Ozonolysis of endocyclic double bond containing alkenes leads to opening of the ring structure, with Criegee intermediate on one end of the chain, and carbonyl group on the other. The Criegee radical further reacts via several pathways, from which the formation of vinylhydroperoxide is highlighted. When decomposing, vinylhydroperoxide forms a radical with mesomeric structures, and an O
2addition leads to an oxo-alkyl radical i.e. to a peroxy radical with four oxygens. This vinylhydroperoxide pathway is the starting point of their consideration as HOM compound.
H-shifting ability of C-H bond for peroxy radicals is assumed, which allows addition of O
2into the molecule, and will lead to a peroxy radical with -OOH functionality. This process is known from high temperature reactions (Cox & Cole, 1985; Glowacki & Pilling, 2010; Jorand et al., 2003; Perrin et al., 1998)), but was not considered of importance at atmospheric conditions until recently (Crounse et al., 2012; 2013). Mentel et al. (2015) conclude that most ozonolysis HOM result from internal H-shift and subsequent O
2addition of the peroxy radical, combined with intramolecular rearrangement. This addition of O
2into the molecule would account for the 32 Th progressions observed in ozonolysis HOM spectra, and this process only requires one initial attack by ozone and further oxidation occurs with intramolecular H-shift and molecular O
2addition. This sequential internal H-shift and addition of molecular O
2into a compound is what is meant by term “autoxidation” later in this work.
In parallel to internal H-shift and subsequent O
2addition, the HOM peroxy radicals can undergo termination reactions leading to closed shell HOMs, i.e. HOMs that are no longer radicals but chemically stable molecules. For all peroxy radicals formed by H-shift and subsequent O
2addition the classical peroxy radical chemistry pathways apply and typical termination products are ketones, alcohols, hydroperoxides, and percarboxylic acids (as shown later, Figure 1.4).
Figure 1.2 Alkoxy-peroxy pathway of alkoxy radical (Mentel et al., 2015).
According to classical peroxy radical chemistry also alkoxy radicals are formed in peroxy radical-peroxy radical reactions. Also alkoxy radicals can undergo H-shifts with the formation of an alkyl radical at which an O
2molecule is added (Vereecken & Peeters, 2010; Vereecken & Franscisco 2012). The forming peroxy radical has one O atom more than the “parent” peroxy radical, and is shown to be of minor importance in case of HOM formation from ozonolysis (Mentel et al., 2015). But as shown in Chapter 5, this pathway is relevant for the results later shown in this work. It will therefore be given a notice here (Figure 1.2). The alkoxy radical RO˙ formed in reaction R1.3h (R6a in Figure 1.2) can undergo intramolecular rearrangement (internal H-shift) and attain O
2, forming hydroxyl-peroxy radical, with three oxygens attached. This can then terminate in accordance with classical peroxy radical pathways, or experience further rearrangement. In this work the term alkoxy-peroxy pathway is used to refer to this pathway.
The vinylhydroperoxy radical pathway combined with further autoxidation can explain progressions of 32 Th observed in data where the formed HOM molecule has an even number of oxygen, while the alkoxy-peroxy pathway and autoxidation would be plausible explanations for the progression of 32 Th in HOM with odd number of oxygen in the molecule. In the case of ozonolysis formed HOM, most are with even number of oxygen, but with OH it is not as simple, and thus the latter pathway may gain importance.
1.3. Volatile organic compounds (VOC) in atmospheric photochemistry
Up to now it is evident that HOM are formed by ozonolysis of endocyclic (biogenic) molecules, and the principle pathways via autoxidation are more or less established. However, in the atmosphere the OH radical is the main oxidant of volatile organic compounds during atmospheric daytime chemistry.
Formation of OH in the atmosphere occurs via ozone photolysis (primary OH production):
O
3+ h -> O
2+ O(
1D) ( < 335 nm) (R1.3a)
O(
1D) + H
2O -> 2 OH (R1.3b)
OH is unreactive towards O
2, N
2, CO
2or H
2O, which is why it “survives” in the atmosphere long enough to react with VOC and other trace gasses. Additional to reaction R1.3b, OH is also produced in the atmosphere in HONO photolysis and secondary sources (photolysis of CH
2=O and HO
2) in catalytic cycles, which means that it regenerates in the same cycle of reactions that consume it, leading to daytime concentrations in the order of 10
6cm
-3.
VOC reactions with OH consume OH in the atmosphere, but VOC also affect OH budget in other ways.
For example alkene ozonolysis produces OH (Atkinson, 1997). Alkene ozonolysis can be an important
source for atmospheric OH during night-time and, in laboratory experiments, a source for OH during
ozonolysis.
Unlike ozone, for example, that requires a carbon double bond where to attack, OH is less selective as a reactant. Although OH mainly attacks a VOC at the double bond (e.g. monoterpenes) it can also abstract hydrogen atoms (for -pinene and -pinene ~10 % of attacks at double bond, MCM version 3.3.1.). OH can also attack C-H bonds in molecules without double bonds. It is therefore also possible that a VOC can be sequentially oxidized by OH even after reaction of the double bond. Addition of OH to double bonds or H-abstraction leads to peroxy radicals (see below R1.3c, R1.3b), which can then undergo autoxidation. This makes it more difficult to find out the pathways of HOM formation from OH initiated VOC oxidation.
A further aspect of photo-oxidation that is important for the interpretation of the results is the impact of NO
X(NO
X= NO + NO
2) on photochemical systems. NO can react with peroxy radicals. In this reaction NO
2is formed without loss of an ozone molecule in contrast to the fast reaction of NO with O
3, making the reaction of peroxy radicals with NO to an important source for Tropospheric ozone. Figure 1.3 sketches the basic reaction pathways mentioned so far.
Figure 1.3 Simplified overview on tropospheric OH chemistry (Geyer, 2000).
Photooxidation is at first described for H abstraction (R1.3c):
RH + OH -> R˙ + H
2O (R1.3c)
R˙ + O
2-> RO
2˙ (R1.3d)
Where RH is the VOC, R˙ is alkyl radical, and RO
2˙ represents the peroxy radical that is formed from the alkyl radical after addition of O
2. An overview of the VOC oxidation pathway is shown in Figure 1.4.
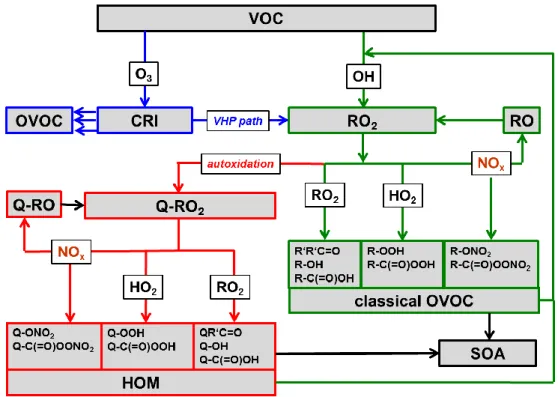
Figure 1.4 Pathways of VOC oxidation. Ozonolysis (blue arrows) also leads to Criegee reactive intermediates
(CRI) which on several pathways can form OVOC, similar to those from OH. The vinylhydroperoxide (VHP)
path leads to peroxy radicals which can undergo autoxidation. The green frames indicate the established
OVOC formation pathway via peroxy radicals (RO
2) induced by the OH radical. The red frames show the
newly discovered additional pathway via autoxidation (H-shift + O
2addition). The HOM termination scheme
is supposedly similar to the classical scheme, however, the very fast autoxidation process led to higher O/C
and functionalization as indicate by using Q. The introduction of NO
Xin both subsystems increases the
importance of alkoxy radicals. OH can sequentially oxidize OVOC to higher oxidation products. Once the
vapour pressure is sufficiently low, HOMs (and OVOC) condense and form SOA.
The fate of the RO
2˙ depends on the atmospheric conditions. When considering low NO
Xconditions, the peroxy radical chemistry runs via several (termination) pathways.
Hydroperoxy channel:
RO
2˙ + HO
2˙ -> ROOH + O
2(R1.3e)
Carbonyl channel:
RO
2˙ + R’O
2˙ -> R
HC=O + R’OH + O
2(R1.3f)
Hydroxy channel: RO
2˙ + R’O
2-> ROH + R’
HC=O + O
2(R1.3g) Alkoxy channel:
RO
2˙ + R’O
2˙ -> RO˙ + O
2+ products (R1.3h)
Additional to these there is the dimerization pathway
RO
2˙ + R’O
2˙ -> ROOR’ + O
2(R1.3i)
Where RO
2˙ and R’O
2˙ can be same or different peroxy radicals.
Presence of NO into the system introduces more channels, and those will be further discussed in Chapter 5. Shortly, organic nitrates and alkoxy radicals are formed:
RO
2˙ + NO -> RONO
2(R5.1a)
RO
2˙ + NO -> RO˙ + NO
2(R5.1b)
Addition of NO in the system has also direct impact on OH concentrations. [OH] is enhanced via reaction R5.1d, and decreased by reaction R5.1e. At low [NO
X] and high rates of NO
2photolysis (J(NO
2), reactions of NO with HO
2can lead to increased [OH], while under high [NO
X] reactions of NO
2with OH lead to HNO
3formation, and subsequent OH net loss (R5.1d and R5.1e).
HO
2˙ + NO -> NO
2+ OH˙ (R5.1d)
OH˙ + NO
2+ M -> HNO
3+ M (R5.1e)
The effect NO
Xhas on total OH and HO
2concentration will be relevant when discussing the effect NO
Xon HOM formation from photooxidation in Chapter 5.
Dominant pathway of -pinene and -pinene photooxidation is the OH attack at the double bond. OH
adds to the double bond that opens whereby the OH radical is attached to one position of the double
bond. The other end of the former double bond has alkyl radical character and by this OH addition a
hydroxy substituted alkyl radical is formed. In analogy to reaction R1.3d a hydroxyl substituted peroxy
radical is formed and the principles of further RO
2reactions are the same as those given above at the
example of H-abstraction reactions.
As most of the published results with respect to HOM formation from -pinene were obtained from ozonolysis experiments, there are open scientific questions regarding OH induced HOM photochemistry.
Therefore this work is focused on OH initiated HOM formation. The possible importance of sequential O
2addition (autoxidation) on the one hand and sequential OH oxidation on the other hand was studied, as
well as whether ozonolysis is required to induce autoxidation (Chapter 3). OH dependency of HOM
formation was studied in order to estimate the efficiency of HOM. Herein analysis of product
distribution should give indication for the mechanism of HOM formation (Chapter 4). In the atmosphere
nitrogen oxides (NO
X) react with peroxy radicals and shift the product pattern to alkoxy radicals and
organic nitrates. Besides NO
Xthe HO
2radical reacts fast with peroxy radical, on average the reaction of
HO
2with RO
2is about a magnitude larger than the RO
2- RO
2reactions. Both effects were investigated by
looking at the changes of HOM abundance and HOM patterns after adding NO
Xor carbon monoxide
(CO) to the chemical system. This way also the assignment of HOMs to peroxy radicals and the
respective termination products could be confirmed (Chapter 5). As many HOMs are also ELVOC, losses
to surfaces are an important factor in the HOM concentration balance. The presence of particles led to
substantial losses of HOM in competition to losses onto the wall, moreover the presence of particles
affected the radical concentration and thus the HOM formation pathways (Chapter 6).
2. Methods and experimental set-up 2.1. Experiment set-up
2.1.1. Jülich Plant Atmosphere Chamber
Figure 2.1 (Adapted from Mentel et al., 2009). Schematics of experiment chamber set-up. Purified air is divided into two separate inlet air flows, both which are humidified to similar degree to avoid problems at mixing the air masses in the chamber. To one of these flows the air from a diffusion source containing the wanted VOC was added. The use of different splits at the outlet of the diffusion source allowed varying BVOC concentrations in the chamber. The other flow is guided via an ozonator to introduce ozone into the chamber. The chamber is constantly stirred tank reactor (CSTR), with a mixing time of about 2 minutes.
Residence time in the chamber during the experiments was about 45 minutes. The glass chamber is situated in a temperature controlled container. A host of instruments are used to measure the conditions in the chamber during the experiments. Most instruments can be switched to measure either inlet or outlet of the chamber, to gain data on changes, such as reacted VOC.
All the experiments were conducted at Jülich Plant Atmosphere Chamber (JPAC) shown in Figure 2.1.
The chamber set-up is well explained by Mentel et al. (2009), but an overview will be given here. The
reaction chamber used was a 1450 L Borosilicate glass chamber, and all the connecting tubes were made
of either Teflon (PFA or PTFE) or glass. This was to minimize the potential wall losses during transport of
gas and air into the analytical devices. The attached fan allowed constant stirring and well mixing of the
air in the chamber, leading to a mixing times of about 2 minutes.
The chamber itself was located in a climate controlled container, which allowed temperature stability of
±0.5 °C between 10 °C and 50 °C. In the experiments the temperature was set to 15 °C. The lamps in and around the chamber produced some heat, and during experiments the temperature varied between 15-16 °C.
There were two main inlet airflows into the chamber. Both main inlet flows were set between 10-16 LPM, depending on experiment. They were humidified by using double-distilled purified water vapour. One of them was then guided through an ozonator to add ozone in the chamber. To the other air flow, the desired VOC was added. When NO
Xor CO was introduced into the chamber, the air containing NO
Xor CO was mixed with this flow. Sometimes additional air flows were introduced, for example for seeding experiments when the aerosol seed was led to the chamber via separate inlet. This 2 LPM flow was not humidified, and the other two flows were usually adjusted slightly to compensate the additional dry air inflow to keep humidity constant in the chamber.
The seed particles were generated using a constant output aerosol generator (TSI, Model 3076) based on atomizing. (NH
4)
2SO
4solution (typical concentration ~40 mg/L) was sprayed by a jet of compressed purified air passing through an orifice at a pressure of around 1.4 bar. The generated aerosol then passed through a silica gel diffusion drier and entered the reaction chamber. In the control experiments, distilled water was used for atomization to keep the experimental conditions constant.
Several lamps were used during the experiments. There were 12 discharge lamps (HQI 400 W/D;
Osram), which were used to simulate the solar spectrum in the chamber. These are referred to as “top lamps”. There was one internal UVC lamp (Phillips, TUV 40W, with a λmax = 254 nm) to photolyse ozone and to produce O
1D, which reacts with water vapour to produce OH. The UVC lamp was covered by adjustable glass tubing, which could be moved to vary the photolysis rate of O
1D, and thus OH production. For NO
2photolysis there were 12 discharge lamps (Phillips, TL 60, W/10-R, 60W, λmax = 365 nm). The glass of the chamber had a short wavelength cut-off close to 350 nm, which means no shortwave radiation could enter the chamber through the glass into the chamber to produce O
1D when UVC lamp was off. Additionally, the absorption cross section of NO
2at wavelength used by the UVC lamp is over one order of magnitude lower than at 356nm (Davidson et al., 1988). This allowed nearly independently varying J(O
1D) and J(NO
2).
The instrument suite did not include a direct OH measurement device, which means that determining OH concentration during the experiment must be achieved indirectly. The method used in the experiments was based on monitoring the concentration of reacting VOC, and its changes during the experiment. When the initial concentration of the VOC is known, the decrease of the VOC can be used to determine the amount of OH reacting with the VOC according to equation Eq.2.2.
𝑑[𝑉𝑂𝐶]
𝑑[𝑡]
=
𝐹𝑉∙ ([𝑉𝑂𝐶
𝑖𝑛] − [𝑉𝑂𝐶]) − (𝑘
𝑂𝐻∙ [𝑂𝐻] ∙ [𝑉𝑂𝐶] + 𝑘
𝑂3∙ [𝑂
3] ∙ [𝑉𝑂𝐶]) (Eq.2.1.)
Assuming steady state conditions:
𝑑[𝑉𝑂𝐶]𝑑𝑡= 0 , OH can be calculated using Eq.2.2:
[𝑂𝐻] =
𝐹
𝑉∙[𝑉𝑂𝐶]𝑖𝑛−[𝑉𝑂𝐶]
[𝑉𝑂𝐶] −𝑘𝑂3∙[𝑂3]
𝑘𝑂𝐻
(Eq.2.2.)
Where [VOC]
inis the initial concentration of VOC in question, [VOC] is the concentration of the VOC in the chamber during experiment, F is total air flow through the chamber, and V is the volume of the chamber. k
OHand k
O3are the rate coefficients of the VOC in question with OH and O
3, respectively.
Details of the experiments reported here are given in Chapter 2.3.
2.1.2. General instrumentation
Several instruments are used to measure the chamber experiment conditions. Ozone was measured by two UV photometric devices: Thermo Environment 49 and Ansynco, O3 42M ozone analyser. For NO measurements, chemiluminescence was used (Eco Physics, CLD 770). For NO
2measurements NO was measured after photolysis of NO
2(Eco Physics, PLC 760). In some cases an optimized chemiluminescence instrument with a blue light diode NO
2converter was used (Eco Physics 780 TR; Details in Li et al., 2014).
Particle concentration was measured by CPC (TSI 3783, > 3nm) and particle size distribution (13-740nm) by SMPS (Waltz, TS-1 3081 electrostatic classifier combined with TSI 3025 CPC). To monitor humidity dew point mirrors were used at both inlet and outlet flows. VOC concentrations were measured by Proton Transfer Reaction – quadrupole- Mass Spectrometer (PTR-Q-MS, Ionicon), Proton Transfer Reaction – time-of-flight- Mass Spectrometer (PTR-TOF-MS, Ionicon), or Gas-Chromatography- Mass spectrometer (GC-MS, Agilent). All instruments could be switched from inlet to outlet, to follow the differences caused by reactions in the chamber.
The instrument used to detect HOM in the chamber was connected to a separate outlet, and could not be switched to inlet. More details on this instrument below.
2.2. Chemical ionization mass spectrometer 2.2.1. Instrument introduction
The instrument used to detect HOMs in the experiments is called Chemical Ionization Atmospheric Pressure interface time-of-flight Mass Spectrometer (CI-APi-TOF-MS, from here on termed as “CIMS”).
The CIMS can be divided into two main parts; to the mass spectrometer that is used to actually detect
and measure HOMs (APi-TOF-MS), and an inlet piece that can be attached to the mass spectrometer to
enhance HOM detection by increasing HOM ionization (CI). First an overview on the APi-TOF part of the
instrument will be given, and then an introduction and some details about the ionization method and
inlet used during the experiments. A short introduction on a calibration system set-up for CIMS will also
be introduced.
The technical details of APi-TOF-MS are described in Junninen et al. (2010). The instrument uses three staged pumping process to lower the sample pressure from atmospheric pressures to the range of 10
-6mbar needed by the TOF (see Figure 2.2). Sample flow into the APi-TOF-MS is determined by a critical orifice, which in the set-up is 300 μm in diameter, allowing 800 mLPM sample flow. There is no ionization in APi-TOF-MS (and it should not be confused with atmospheric pressure ionization, API). The APi-TOF-MS was manufactured by Tofwerk AG, Thun, Switzerland and Aerodyne Research Inc., USA. The instrument has two modes that offer different mass resolving powers (R), V- and W-modes. The letter used depicts the path of ions in the TOF (time-of-flight) region, with W mode offering longer flight path and thus higher mass resolution. All results shown in this work were measured using the V mode. The resolving power achieved in the experiments ranged from 3000 to 4000 Th/Th, with accuracy higher than 20 ppm (0.002 %). Resolving power is defined as
R=M/ΔM
Where M is mass/charge and ΔM is the width of the peak at its half maximum. The mass range of the instrument was set to 4-1400 Th, which is more than enough for the purposes of this work. More than 95 % of the peaks observed in these studies were at masses below 700 Th.
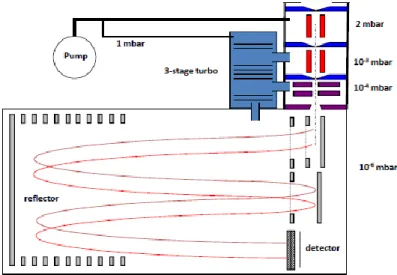
Figure 2.2 Schematic figure of APi-TOF-MS (Junninen et al., 2010). There is no ionization method at this
stage; ionization happens at an additional inlet figuration (Figure 2.3). Sampling is done at atmospheric
pressure, after which the sample is focused and air is pumped out to reach low pressure (< 10
-6mbar) as
used at the TOF region. Time-of-flight mass spectrometer (TOF-MS) is used to mass separate and detect
ions. Normal operating mode of TOF-MS in the experiments was the V-mode, which gives somewhat lower
mass resolution (3000-4000 Th/Th compared to c. 8000 Th/Th at W-mode), but has better sensitivity, and
allows higher time resolution. In experiments shown here, only the V-mode was used. Critical orifice
(300 μm) limits the sample flow into the APi-TOF-MS system to approximately 800 mLPM.
The chosen ionization method used in the studies presented here was chemical ionization, which is a
“soft” ionization method, and doesn’t cause fragmentation of the sample. The CI-inlet design has been described by Eisele and Tanner (1993), Kurtén et al. (2011), and Jokinen et al. (2012). It is specially designed to measure atmospheric sulphuric acid and its clusters, but can be used to modify APi-TOF-MS into a specific measuring instrument for HOMs when run with nitric acid (nitrate, NO
3-) as reagent ion.
Figure 2.3 shows a schematic cross view of the inlet design. Simplified, the inlet consists of ¾ inch stainless steel sample line and a stainless steel reaction tube/drift tube. Nitric acid vapour is introduced into a 20 LPM sheath flow of pure air/purified, which is then exposed to α-radiation from
241Am source to create nitrate ions. The sheath flow now containing the nitrate ions then flows into the reaction tube.
An electric field in the outer wall of the reaction tube is used to guide the nitrate ions from the sheath flow into the sample flow, where they cluster with HOMs. The calculated interaction time between the ions and the sample gas is approximately 200 ms. The volume of the reaction tube/drift tube is
~240 mm
3. With 10 LPM sample flow this gives a residence time of 1.5 ms.
Figure 2.3 Schematic of NO
3-CI-inlet. The inlet is attached directly in front of the critical orifice leading to
the APi-TOF part pf the instrument, and is used to ionize the sample flow before it enters the mass
spectrometer for detection. Nitric acid is introduced into the system via 20LPM sheath flow and ionized by
alpha radiation from 10 MBq Americium-241 source. Electric field is then used to focus the nitrate ions in
the reaction chamber into the sample flow, where they cluster with HOM (adapted from Jokinen, 2015).
The ionization in NO
3-CIMS is done at atmospheric pressure, and it’s based on clustering of the HOMs with the reagent ion (NO
3-), by collisions with nitrate ions (Eq2.1.), nitrate ion-nitric acid dimers (Eq2.2.) and nitrate ion-nitric acid trimers (Eq2.3.):
NO
3-+ HOM <-> (HOM)(NO
3-) (Eq2.1.)
NO
3-(HNO
3) + HOM <-> (HOM)(NO
3-(HNO
3)) <-> HNO
3+ (HOM)(NO
3-) (Eq2.2.) NO
3-(HNO
3)
2+ HOM <-> (HOM)(NO
3-(HNO
3)
2) <-> 2HNO
3+ (HOM)(NO
3-) (Eq2.3.) Eq2.1. leads directly to a formation of HOM-NO
3- cluster. The formation free energy of the cluster can be used to calculate the equilibrium constant and collision rate, which in turn determine the evaporation lifetime of the cluster (Hyttinen et al., 2015). Collisions with reagent ion dimer and trimer (Eq2.2. and Eq2.3.) lead to intermediate state clusters, from which either the HOM, or one or two HNO
3can be lost depending on the relative stabilities of the clusters.
Nitrate was chosen as a reagent ion since HOMs are known to readily cluster with it in ambient conditions (Ehn et al., 2012). Based on quantum chemical calculations, the HOMs are usually detected when they are able to form two hydrogen bonds with NO
3-, which requires two OOH groups, or, hypothetically, another H donating group such as OH (Hyttinen et al., 2015). These structures allow the HOMs to form clusters with NO
3-that are energetically more favourable than nitric acid dimer or trimer clusters. This means that higher oxidation state molecules cluster efficiently with the reagent ion and are detected, while low oxidation state compounds do not cluster with NO
3-and are not detected. This means the results presented here might be biased towards highly oxidized end product spectrum.
However, as the high O/C ratio is what makes HOMs interesting in particle formation and growth, the highly oxidized products were of main interest of this study.
In the experiments reported here, in addition to normal nitric acid (H
14NO
3), isotopically labelled nitric acid (H
15NO
3, 98%
15N) was used as a reagent ion compound. This was originally done to better distinguish in the mass spectra nitrogen from the reagent ion from nitrogen originating from NO
Xaddition into the HOM molecule. High resolution of the instrument allows differentiation, and could be used to show organic nitrate formation occurring during the experiments.
However, during very high NO
Xconcentration experiments, it was noticed that there was sufficient HNO
3formation happening in the chamber to compete with the labelled HNO
3in the instrument inlet.
Figure 2.4 shows an example mass spectrum from the reagent ion monomer range (
14NO
3-at 62 Th and
15
NO
3-at 63 Th) and dimer (H
14NO
3·
14NO
3-at 125 Th and H
15NO
3·
15NO
3-at 127 Th) during an experiment without NO
Xaddition, and when we had high NO
Xaddition (~80 ppb at the chamber inlet). A clear decrease in the proportion of labelled
15NO
3-can be seen, and an increase in the unlabelled NO
3-. In the
case of the dimer cluster, the increase can be seen at one unit mass lower, with only one molecule of
the cluster being from H
14NO
3(either
14NO
3-or H
14NO
3), and the other still from the labelled nitric acid
from the inlet source. Same behaviour can be seen in the trimer nitrate peak as well (not shown).
Figure 2.4 Comparison of reagent ion monomer and dimer regions between high NO
X-experiment with experiment of no added NO
X. The reagent ion used in the experiments was
15NO
3-, which gives mean peaks at masses 63 Th (monomer) and 127 Th (dimer). During high NO
Xexperiments there was sufficient H
14NO
3formation taking place in the chamber for it to ionize in the inlet, and start competing with the labelled reagent ion. An increase on signal can be seen at 62 Th (
14NO
3-) and 126 Th (either H
14NO
3·
15NO
3-or H
15NO
3·
14NO
3-, cannot not be distinguished). The monomer peak at 63 Th decreased from 0.40 counts/s to 0.36 counts/s (a little under 10 % decrease), while the peak 62 Th increased by factor of four (0.011 counts/s to 0.045 counts/s). At reagent ion dimer the fully isotopically labelled cluster decreased by about 20 % (to 0.23 counts/s), while the mixed cluster increased from 0.014 counts/s to 0.046 counts/s (an increase of 240 %). Peak at 81 Th is water cluster (H
2O·
15NO
3-).
This mixing of unlabelled nitric acid from the chamber into the inlet in concentrations high enough to compete with the reagent ion caused some unforeseen complications. With a mixing ion clustering from
14
NO
3-and
15NO
3-, reading the mass spectrum becomes complex, with a portion of all compounds being clustered with either ion. This problem only occurred with the highest concentration of NO
Xused in this work, and was overcome by using total monomer and dimer concentrations in most analyses shown later. Compound analysis and identification was made with data sets obtained with low enough NO
Xconcentrations that this competing clustering did not happen, and when comparing total HOM formation, integrating over whole monomer or dimer range by-passed this issue. This applies to the
-pinene + NO
Xexperiments shown in Chapter 5.
However, to prevent this from further confusing the results from later NO
Xexperiments, H
14NO
3was used in -pinene + NO
Xexperiments. The advantage of distinguishing between reagent ion nitrate and reaction product nitrate was lost, but for peak identification one nitrogen atom was always assumed to come from NO
3-.
In following chapters when showing results in a form of mass spectra, the mass from nitrate cluster will be subtracted, and the mass axes will all be the same, showing only the mass of the actual compound.
This allows for easy comparison of the results obtained with different isotopic reagent ions, and showcases the mass of the actual reaction product, without additional mass from reagent ion clustering.
In practice this means that a compound C
10H
16O
7, for example, will be shown at mass 248 Th instead of 310 Th (
14NO
3- cluster) or 311 Th (
15NO
3- cluster), and so forth.
2.2.2. Calibration
Calibrating the nitrate CIMS has been a challenge since the instrument was first modified to measure HOMs. The combination of low vapour pressures of the compounds of interest, and the very sensitive instrumentation, has proven finding a calibration set-up and suitable calibration compound to be difficult.
In the calibration set-up, there was a temperature controlled diffusion source, with two stage dilution to reach the low ppt levels required by the instrument, while at the same time achieving high enough evaporation loss from the source to calculate reliably the concentration given by the source. The lines leading from the calibration source into the instrument were heated at ~50 °C to prevent condensation of the calibration compound into the lines.
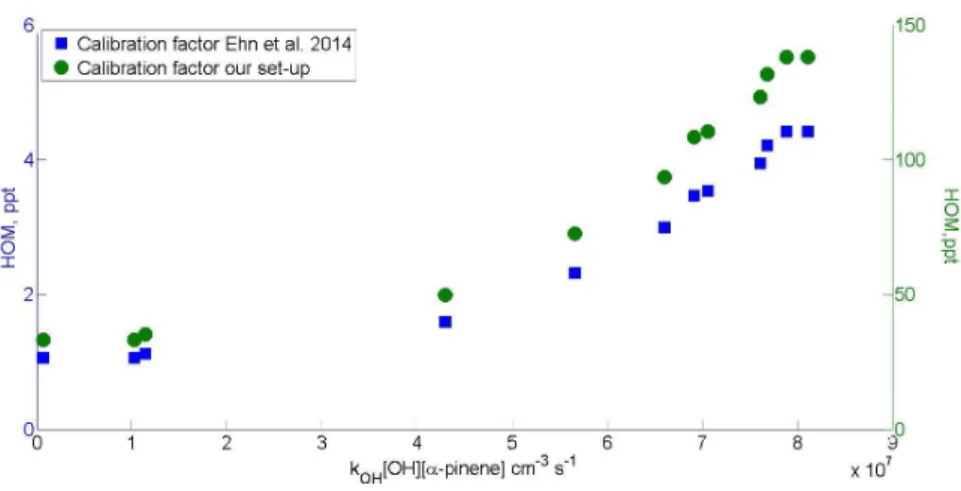
Figure 2.5 Calibration at two separate temperatures. 15.5 °C is within the normal operating temperature of
the experiments; 20 °C was chosen as an example of higher summer time ambient temperatures. Higher
temperatures were not possible as the instrument itself was situated in the temperature housing, and
higher temperatures may cause mechanistic changes inside the instrument. Using linear regression a
concentration calibration equation for HOM was acquired. R
2for the linear fit was 0.99.
Figure 2.5 shows results from the calibration experiment in two different temperatures, using perfluoro- octanoic acid (C
8HF
15O
2) as a calibration compound. The main peak given by the compound is given at mass 476 Th (as a cluster with
14NO
3-; mass without reagent ion 414 Th). This is at the upper limit of the HOM monomer range that is the focus of the results here. The calibration method is still limited by only giving calibration for one mass, and not the whole mass range, so linearity over mass range must be assumed. Both temperatures give very consistent calibration results, with a linear dependence over entire range of concentrations.
Calibration factor C
xcan be calculated using method described by Ehn et al. (2014, supplements):
[𝑋] = 𝐶
𝑥∙ ∑
2𝑖=0[(𝐻𝑁𝑂
3)
𝑖(𝑁𝑂
3−)(𝑋) + (𝐻𝑁𝑂
3)
𝑖(𝑋 − 𝐻)
−]/ ∑
2𝑖=0(𝐻𝑁𝑂
3)
𝑖(𝑁𝑂
3−) ≡ 𝐶
𝑥∙ 𝐴 Here X is the concentration of the neutral calibration compound that was measured, the numerator consists of the sum of all detected ion clusters containing the calibration compound X, and the denominator is the sum of all reagent ions. A is the ratio that can be determined from calibration measurements. Solving for C
xgives the calibration factor which can then be used to calculate HOM concentrations.
Previously it was mentioned that linearity over the mass range is assumed when applying the calibration factor due to only having one m/z point to use. According to a study concerning the transmission times in a CIMS, the sensitivity might not be linear over the m/z (Heinritzi et al., 2016). The authors describe how using different fluorinated compounds they charted the transmission over the m/z range used to detect HOMs, and concluded that in their set-up the transmission of average dimer range molecule might be up to twice as strong as that of monomer range molecule. However, the behaviour of charged clusters in the instrument is highly dependent on the tuning of the instrument, and thus the results cannot be directly applied to measurements reported in this work. Yet, the results presented by Heinritzi et al. are a good reminder that linear approach will potentially include large errors when applied to masses far smaller or larger than the mass of the calibration compound we used. In the future it is planned to include a range of different calibration compounds to achieve more accurate calibration over larger m/z range in the CIMS.
When using the calibration measurements made with the set-up, a calibration factor C
Xwas calculated to be in 5 · 10
11. This is an order of magnitude higher than what has been reported in literature for CIMS (Jokinen et al., 2012; Ehn et al., 2014). It is possible that the CIMS used here, which is one of the older models in use, has much lower sensitivity. It is also possible that there are some errors introduced from weighing the calibration compound (to calculate the mass loss over time to derive the concentration), or that despite heating the calibration set-up tubing there might have been some condensational losses between the calibration source and the instrument. The error of actual concentration calculations is thus in the order of one magnitude.
In this work the concentration will be on the photochemistry side of the HOM formation, and as the goal
of this work is to present qualitative and not quantitative results, the actual concentrations are not
crucial. For this reason the results in this work will be given as counts/s, although an example of absolute HOM concentrations will be given in Chapter 4.
2.3. Experiment protocols
Several experiments were conducted in the study of photochemical HOM formation. Here an overview on the made experiments is given, as well as the motivation behind each experiment.
Figure 2.6 shows an example experiment of HOM production from OH oxidation. The chamber was run until the system reaches a steady state at ozone regime, then the UVC lamp was turned on to initiate OH production. A typical behaviour of HOM formation was a rapid increase when OH production began, followed by slower decrease into steady state. After a new steady state under OH HOM production was reached, the UVC lamp was turned off and the experiment finished. Figure 2.7 shows an example from NO
Xaddition experiment. The difference of NO
Xexperiment is that before starting OH production, NO
Xis introduced in the chamber and then waited to reach steady state before initiating OH production. The ending of the experiment varied according to the purpose, with sometimes NO
Xaddition stopped before OH production, or vice versa. The two examples for the procedures of experiments are representative, although in individual experiments the procedure might deviate from this pattern depending on the objective of the experiment.
Figure 2.6 Example of experiment run without NO
X. After chamber has reached steady state under ozone,
UVC lamp is turned on to start OH production. Experiment is continued until chamber has reached (pseudo)
steady state under OH regime, then UVC lamp is turned off, and experiment ended. Example shown here is
with α-pinene HOM production. Time scale is in hours.
Figure 2.7 Example of NO
Xdependence experiment run. After NO
Xaddition is started, steady state is waited before starting OH production by switching on UVC lamp. UVA lamp is on during NO
Xaddition to photolyse NO
2into NO. Ending of a NO
Xexperiment varied, either first stopping NO
Xaddition, or OH production, depending on the goal of the experiment. Time scale is in hours.
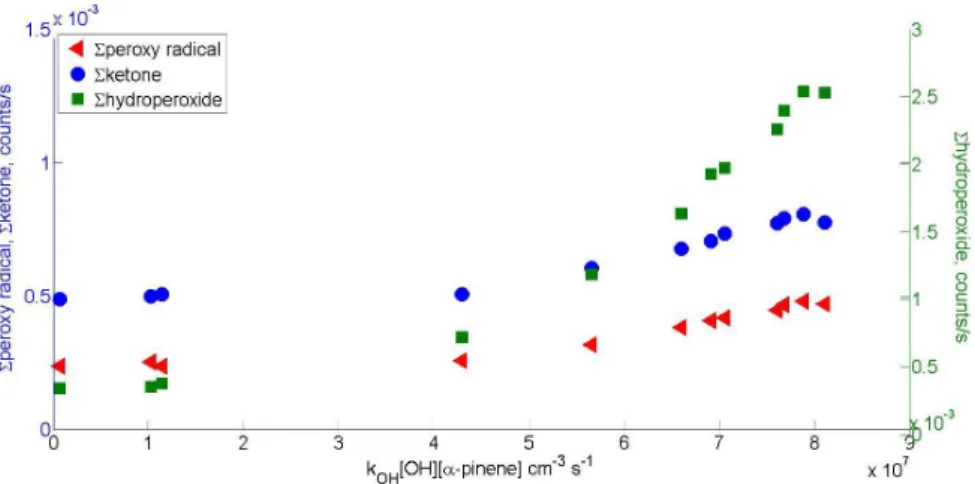
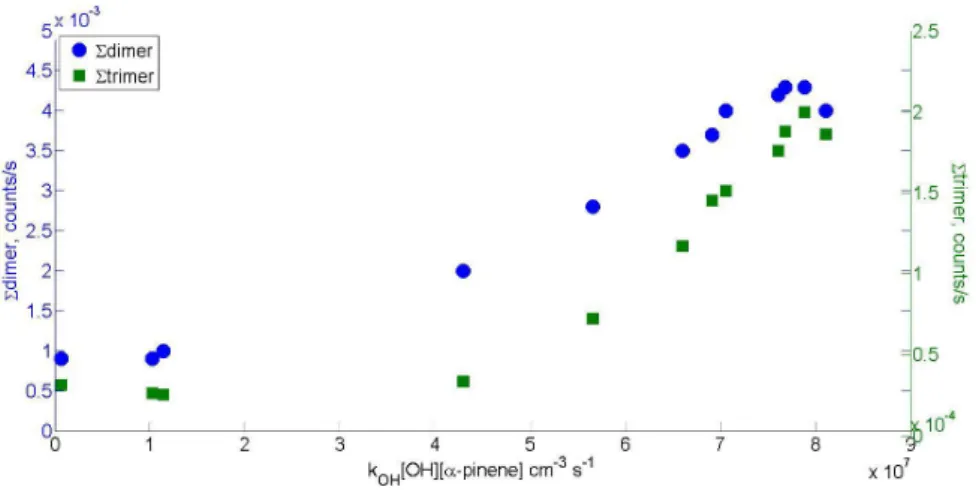
When discussing results in later chapters, a notation introduced by Mentel et al. (2015) is sometimes used. Peroxy radical with a certain molar mass is referred to as m, hydroperoxide as m+1, ketone as m-17 and organic nitrate as m+30. Additionally a notation m+46 to refer to PAN-like nitrates is used.
Numbers used are based on the mass differences of the termination products of the peroxy radical.
Reaction rates used for the calculations as well as peak lists for α-pinene, β-pinene, and cyclohexene can be found in Appendix. Example mass spectra for photochemical HOM formation from α-pinene with and without NO
Xcan also be found in the Appendix.
2.3.1. Experiment overview
The mechanistic side of photochemical HOM formation will be presented in Chapter 3. The purpose was to investigate if the same basic autoxidation mechanism reported to be responsible for ozonolysis HOM formation is behind photochemical HOM formation as well, or whether OH attacks the molecule several times is a sequential oxidation. To better study this, the effects of these two mechanisms needed to be separated.
To start, photochemical HOM formation from cyclohexene and cyclohexene-d10 is compared. In
molecules where hydrogen is replaced by deuterium the H-shift is inhibited, suppressing autoxidation
(Kurtén et al., 2015). Tables 2.1. and 2.2. give the initial experimental conditions of these experiments,
i.e. the VOC input concentration before any reactions have happened in the chamber. The given [OH] is the actual OH concentration during experiment.
Table 2.1. Initial experiment conditions for cyclohexene experiment. Concentrations are calculated concentrations in the chamber before any reactions have taken place.
Experiment set OH
a[cyclohexene] 26 ppb
[ozone] 54 ppb
[OH] cm
-31.0 · 10
7cm
-3RH 60 %
particle surface - temperature 15 °C
a
: simple test of initiating OH production in the chamber and observing formed HOMs.
Table 2.2. Initial experiment conditions for deuterated cyclohexene (cyclohexene-d10) experiment. Concentrations are calculated concentrations in the chamber before any reactions have taken place.
Experiment set OH
a[cyclohexene-d10] 95 ppb
[ozone] 54 ppb
[OH] cm
-3-
RH 60 %
particle surface - temperature 15 °C
a
: simple test of initiating OH production in the chamber and observing formed HOMs.
In order to investigate the α-pinene photochemical HOM formation the photochemical reaction system was varied by changing the OH source strength (e.g. J(O
1D)). The OH experiments served also to compare the formation rates of HOM molecules with different number of oxygen atoms as this is indicative whether they are formed instantaneously (autoxidation) or by sequential oxidation. In same sense it is compared whether the gross pattern of end products is changing with changing [OH]. The initial conditions of OH experiments of α-pinene can be seen in Table 2.3., column one.
On top of this an oxygen replacement experiment was performed with the idea to inhibit RO
2formation, thus inhibiting the autoxidation process (compare Jokinen et al., 2014; Berndt et al., 2015). The experiment was conducted by replacing the oxygen in the air flow leading into the chamber by nitrogen.
The goal was to reach oxygen concentrations <1 %. During this experiment both photochemical HOM formation and ozonolysis initiated HOM formation was tested.
As pure OH chemistry is an unlikely occurrence in the real atmosphere, next objective was to study the
effect of NO
Xaddition on HOM formation. The NO
Xconcentrations used in this study are given in the
second column of Table 2.3. In addition, CO was added to system in order to study the response of increasing HO
2(Table 2.3. column 3). Results obtained from these experiments will be covered in Chapter 5.
For chemical mass balance of HOMs it is important to consider the gas-phase loss processes, i.e.
condensation on particles due to their low vapour pressures. The particle concentration was regulated by changing the HOM precursor concentrations to change the rate of nucleation, or by introducing seed particles from a particle generator (see Chapter 2.1.1.). Details of these experiments are given in column four of Table 2.3, and will be discussed in Chapter 6.
Table 2.3. Initial experiment conditions for -pinene experiments. If several values were used during the experimentation (for example in OH dependency experiment), the total range is given. Concentrations are concentrations in the chamber before any reactions have taken place ([OH] during experiments). Variations of [OH] were obtained by variations of J(O
1D), variations of [NO
X] and [CO] were obtained by varying the inflow of the respective trace gas and variation of surface was obtained by changing the inflow of ammonium sulfate particles.
Experiment set f(OH)
af(NO
X)
bf(CO)
cf(surface)
d[α-pinene] 9.9 ppb 18 ppb 12 ppb 11 ppb
[ozone] 32 ppb 30 – 38 ppb 45 ppb 47 ppb
[OH] 0.5 · 10
6– 5 · 10
7cm
-32.8 – 7.6 · 10
7cm
-32.6 · 10
6– 4.3 · 10
7cm
-30.5 – 9.4 · 10
7cm
-3RH 60 % 60 % 60 % 60 %
[NO
X] - 0.5– 121 ppb - -
[CO] - - 0 – 57 ppm -
particle surface - 0 - 6 · 10
-5m
2m
-37.2 · 10
-5m
2m
-30 – 1 · 10
-3m
2m
-3temperature 15 °C 15 °C 15 °C 15 °C
a
: f(OH) = variations of [OH] by changing J(O
1D).
b
: f(NO
X) = variations of [NO
X].
c
: f(CO) = variation of [CO].
d
: f(surface) = variation of particle surface.
Table 2.4. Initial experiment conditions for pinonaldehyde experiment. Concentrations are calculated concentrations in the chamber before any reactions have taken place. Pinonaldehyde could not be measured with the PTR-Q, and thus [OH] and [pinonaldehyde] data are not available. Experiment results will be only qualitative.
Experiment set OH
a[pinonaldehyde] several ppb
[ozone] 190 ppb
[OH] cm
-3-
RH 60 %
particle surface - temperature 15 °C
a
![Figure 4.12 Ratio HOM dimer to HOM monomer from β-pinene photooxidation as a function of β-pinene destruction rate under high [OH]](https://thumb-eu.123doks.com/thumbv2/1library_info/3693447.1505673/65.722.128.594.89.352/figure-ratio-monomer-pinene-photooxidation-function-pinene-destruction.webp)